Eye Tracking
Eye-tracking is the process of measuring the point of the human gaze (where one is looking) on the screen.
Decode CX Eye Tracking uses the standard webcam embedded with the laptop or desktop to measure eye positions and movements. The webcam identifies the position of both the eyes and records eye movement as the viewer looks at some kind of stimulus presented in front of him, either on a laptop, desktop, or mobile screen.
The data is processed in real-time, and the results are shown second by second in terms of Affective parameters.
Experience Eye Tracking✨
To experience how Eye Tracking works, click here: https://www.entropik.io/experience/eye-tracking
Read the instructions and start Eye Tracking on your Laptop or Desktop. Eye Tracking begins with a calibration, post which the system will identify your point of gaze on prompted pictures in real-time.
Please enable the camera while accessing the application.InsightsfromEyeTrackingStudy results are made available to users in Affect Labs Insights Dashboards. To view the results and insights available for Eye-tracking studies, please click Eye Tracking Insights.

Eye trackers are used in marketing as an input device for human-computer interaction, product design, and many other areas.
Insights from Eye Tracking🔍
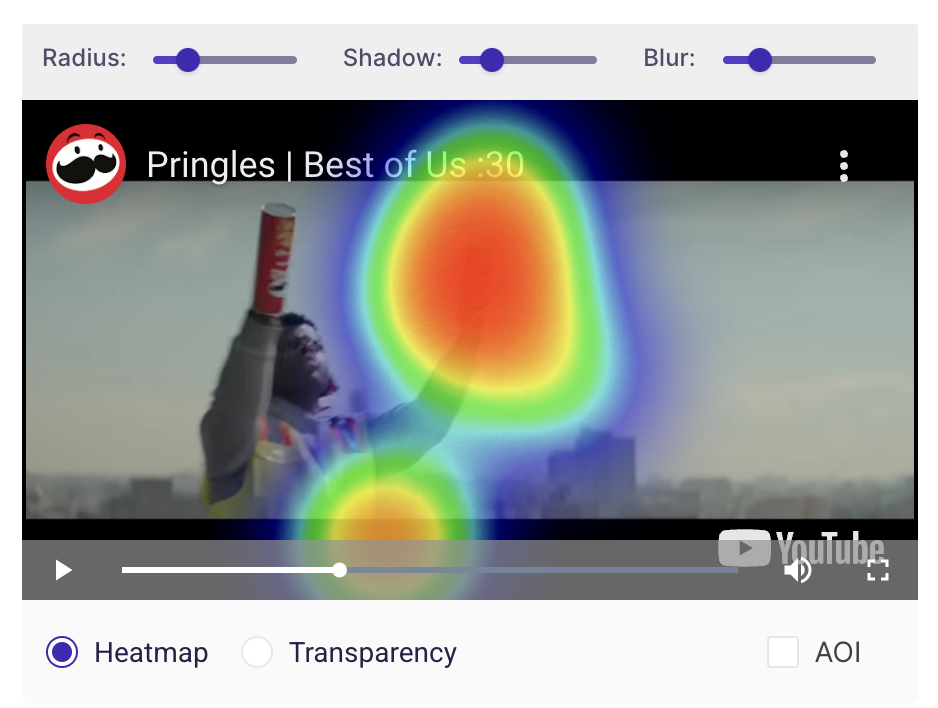
Eye Tracking results provide insight into the point of gaze and time to discover the objects in the visual content shown to them by tracking and automatically producing a heat map, gaze map and transparency map.
We have the following metrics for eye tracking:
Area of Interest (AOI): Area of Interest(AOI) functionality allows users to define specific areas within their stimuli which need to be measured for their noticeability, earned attention, etc. Examples of such areas of interest can be a brand logo on a pack, pack clusters on a shelf, or a character in a video.

An area of interest will have its coordinates (xmin,xmax,ymin,ymax) and time segment (t-start, tend) associated with it. For each AOI, we calculate the following metrics:
- Exposure time duration: Calculated as the total time spent on a particular AOI
- Average Time to first discovery: Average time elapsed when the tester first discovers the Area of Interest (AOI) across all the testers meant to measure the noticeability.
Desirable: The Lower, the better.
- Percentage People watched: Calculated by the number of people who looked at the AOI vs the total number of testers, meant to measure the pack relevance with respondents.
Desirable: The higher, the better.
- Earned Attention/Held Attention: Number of seconds of continuous view held by the AOI meant to measure efficacy.
Desirable: The higher, the better.
Maps from Eye Tracking
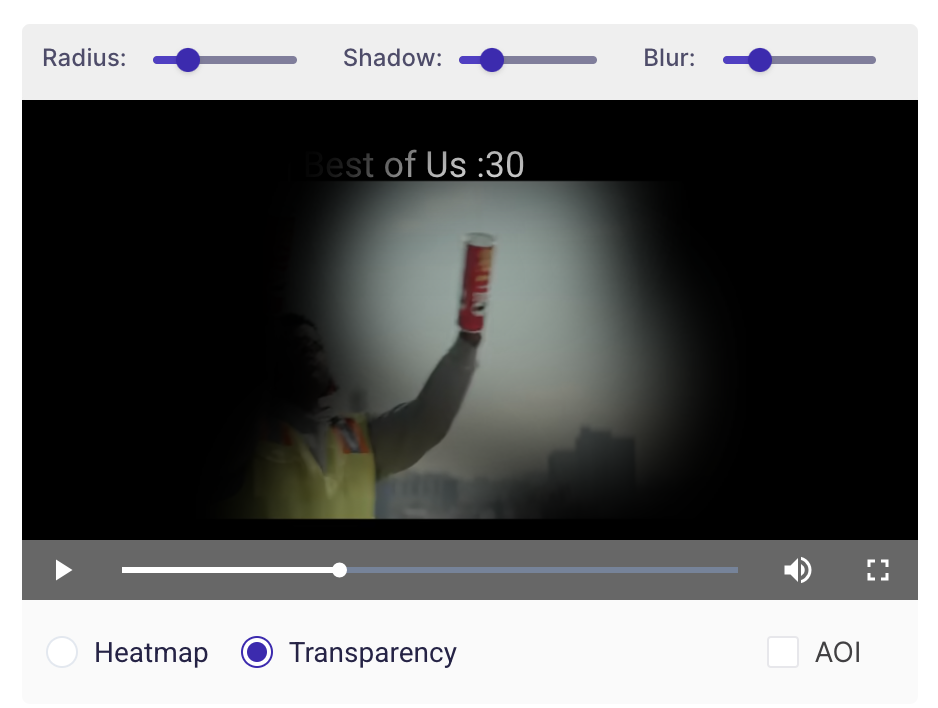
- Heatmap: Eye Tracking Heat maps use varying colour intensity to highlight areas that were viewed most by the respondents.
- Transparency Maps: Just like Heat maps, Transparency maps are also plotted using the participant's Gaze Points on top of the Stimulus. But instead of using varying colour intensities, the Stimulus is made transparent where the gaze points aggregate. A higher concentration of points results in clear visibility compared to segments with fewer points. Segments with no Eye Gaze points are hidden.