How to generate charts for highlights?
Overview
Using the decode platform, you can generate visuals for the tags you have created in the media and view all the critical points in the form of charts. In this article, we'll guide you through the process of generating charts for highlights in Decode.
Steps
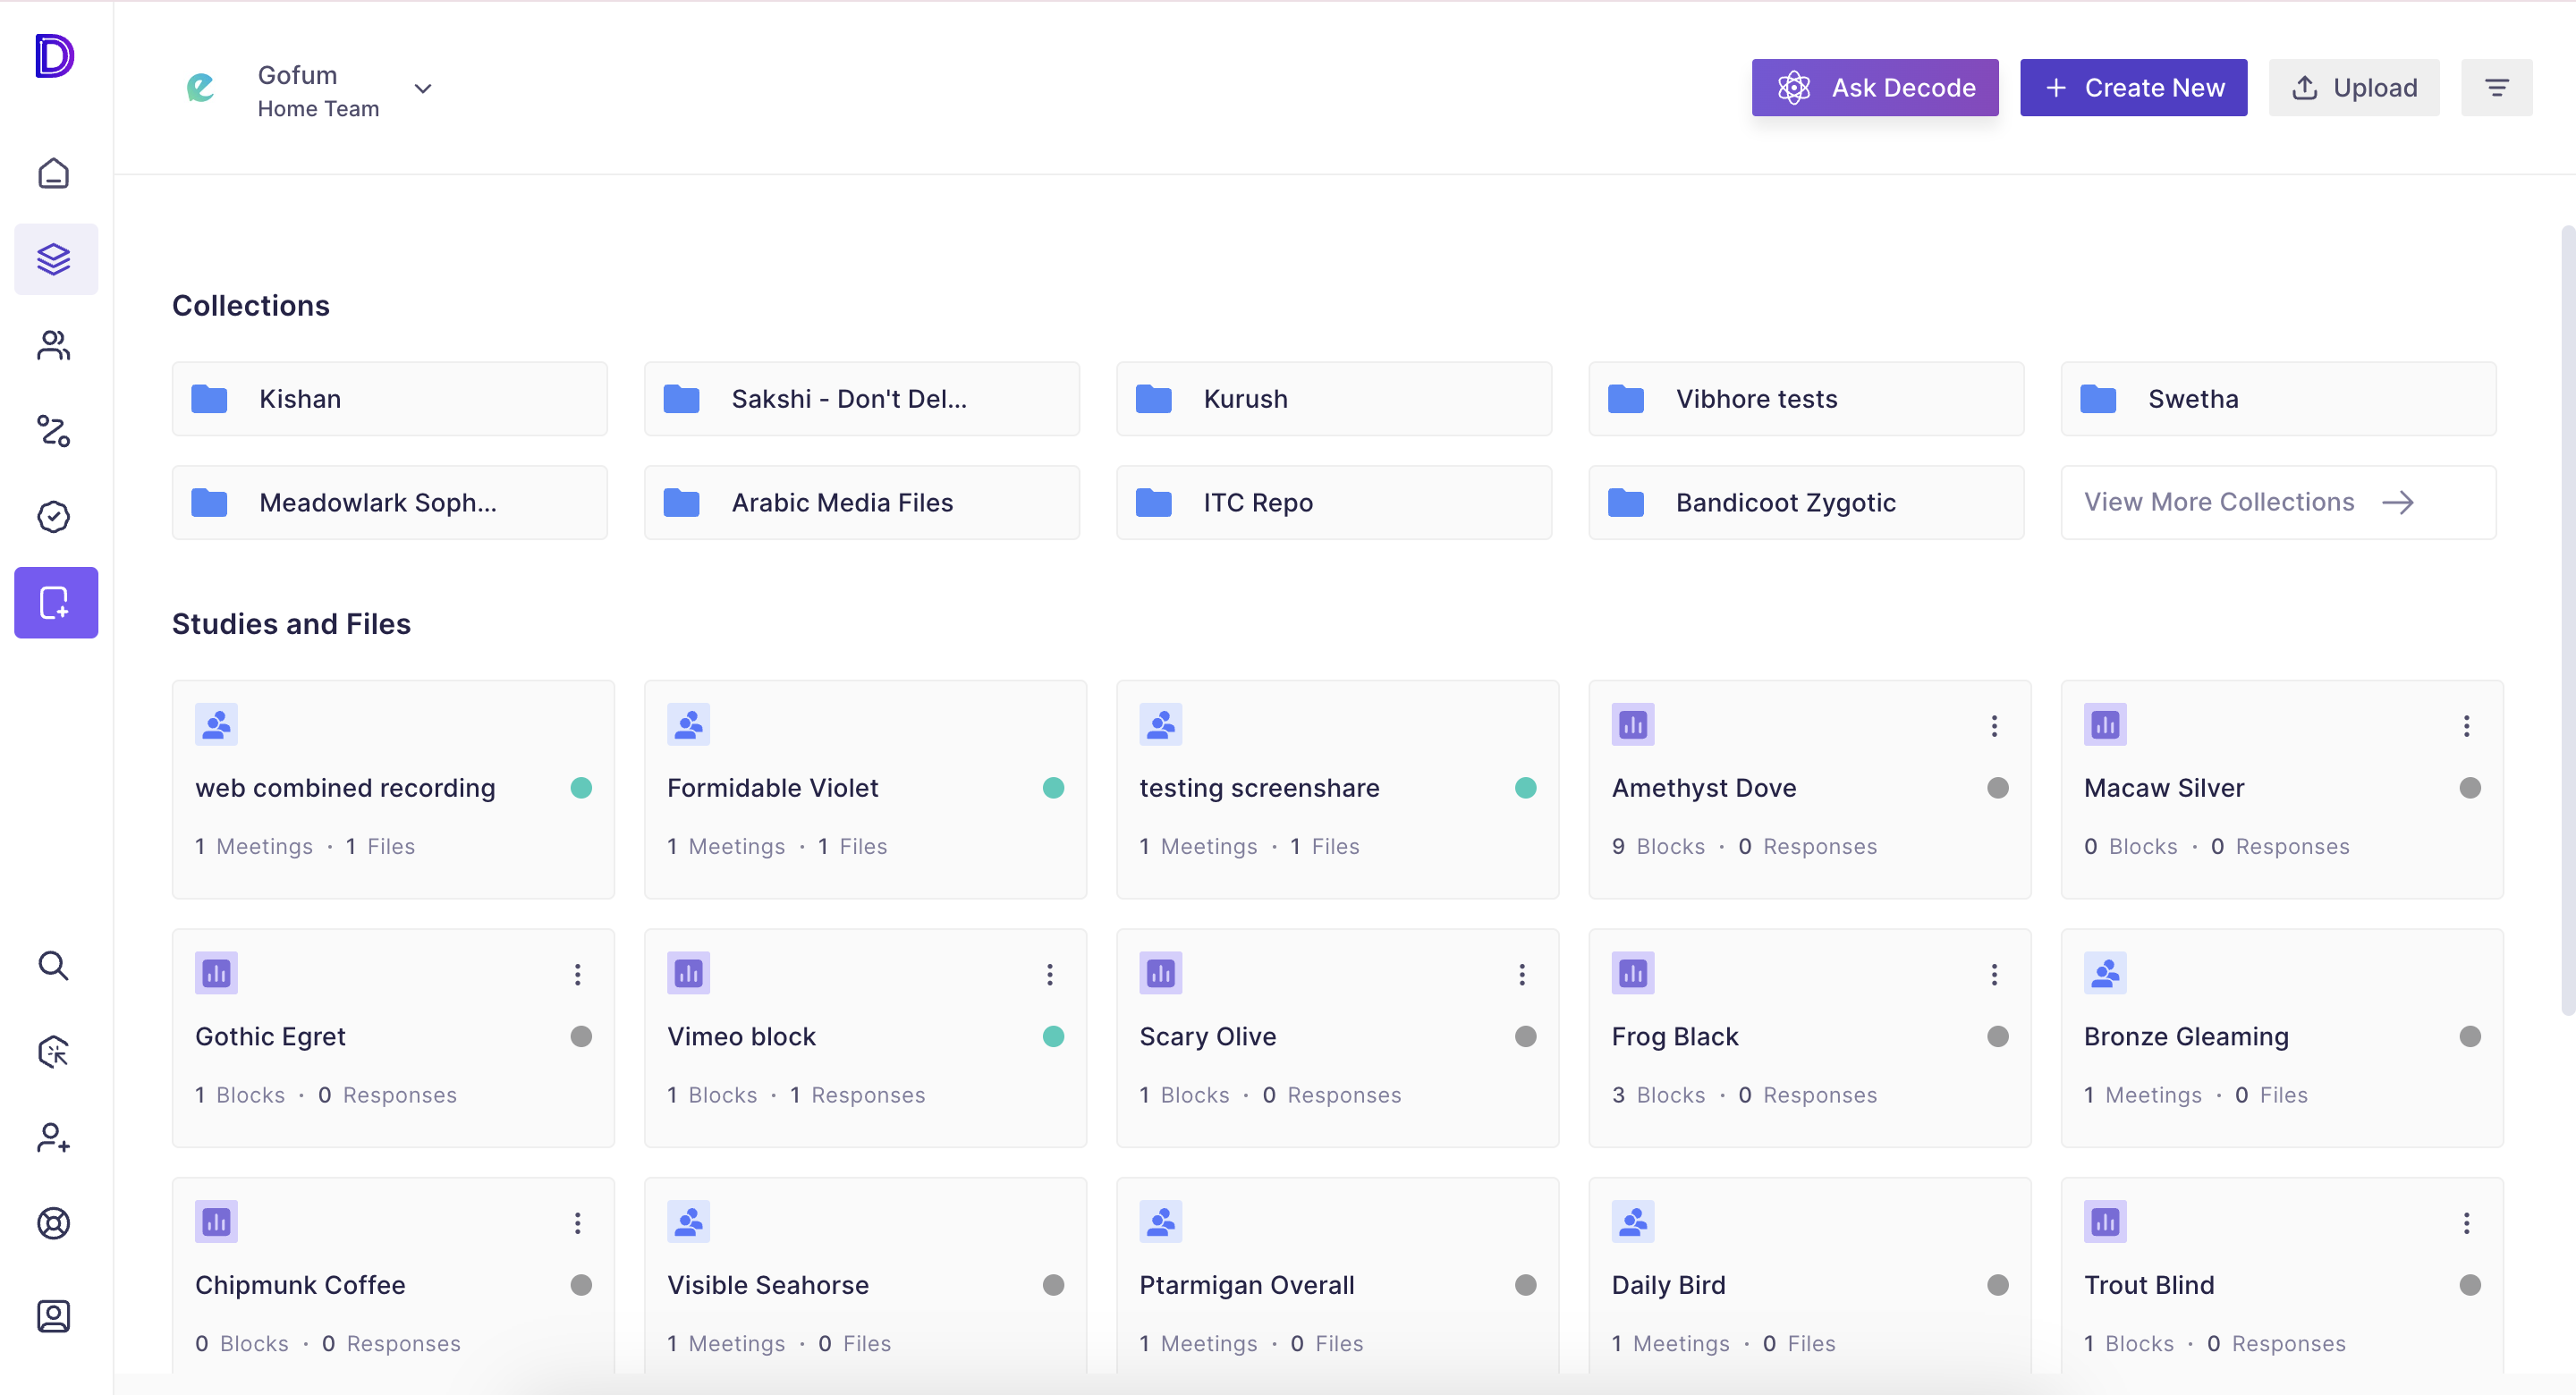
Step 1: Once you log into your Decode account, you will be automatically directed to your home page. Click on the library icon from the let navigation panel.

Step 2: You will see all the media, studies and collections . Click on any media to open it.
Step 3: The "Media Detail" tab will open by default; go to the charts section from the right navigation bar. You will find a default bar chart created for all your tags.
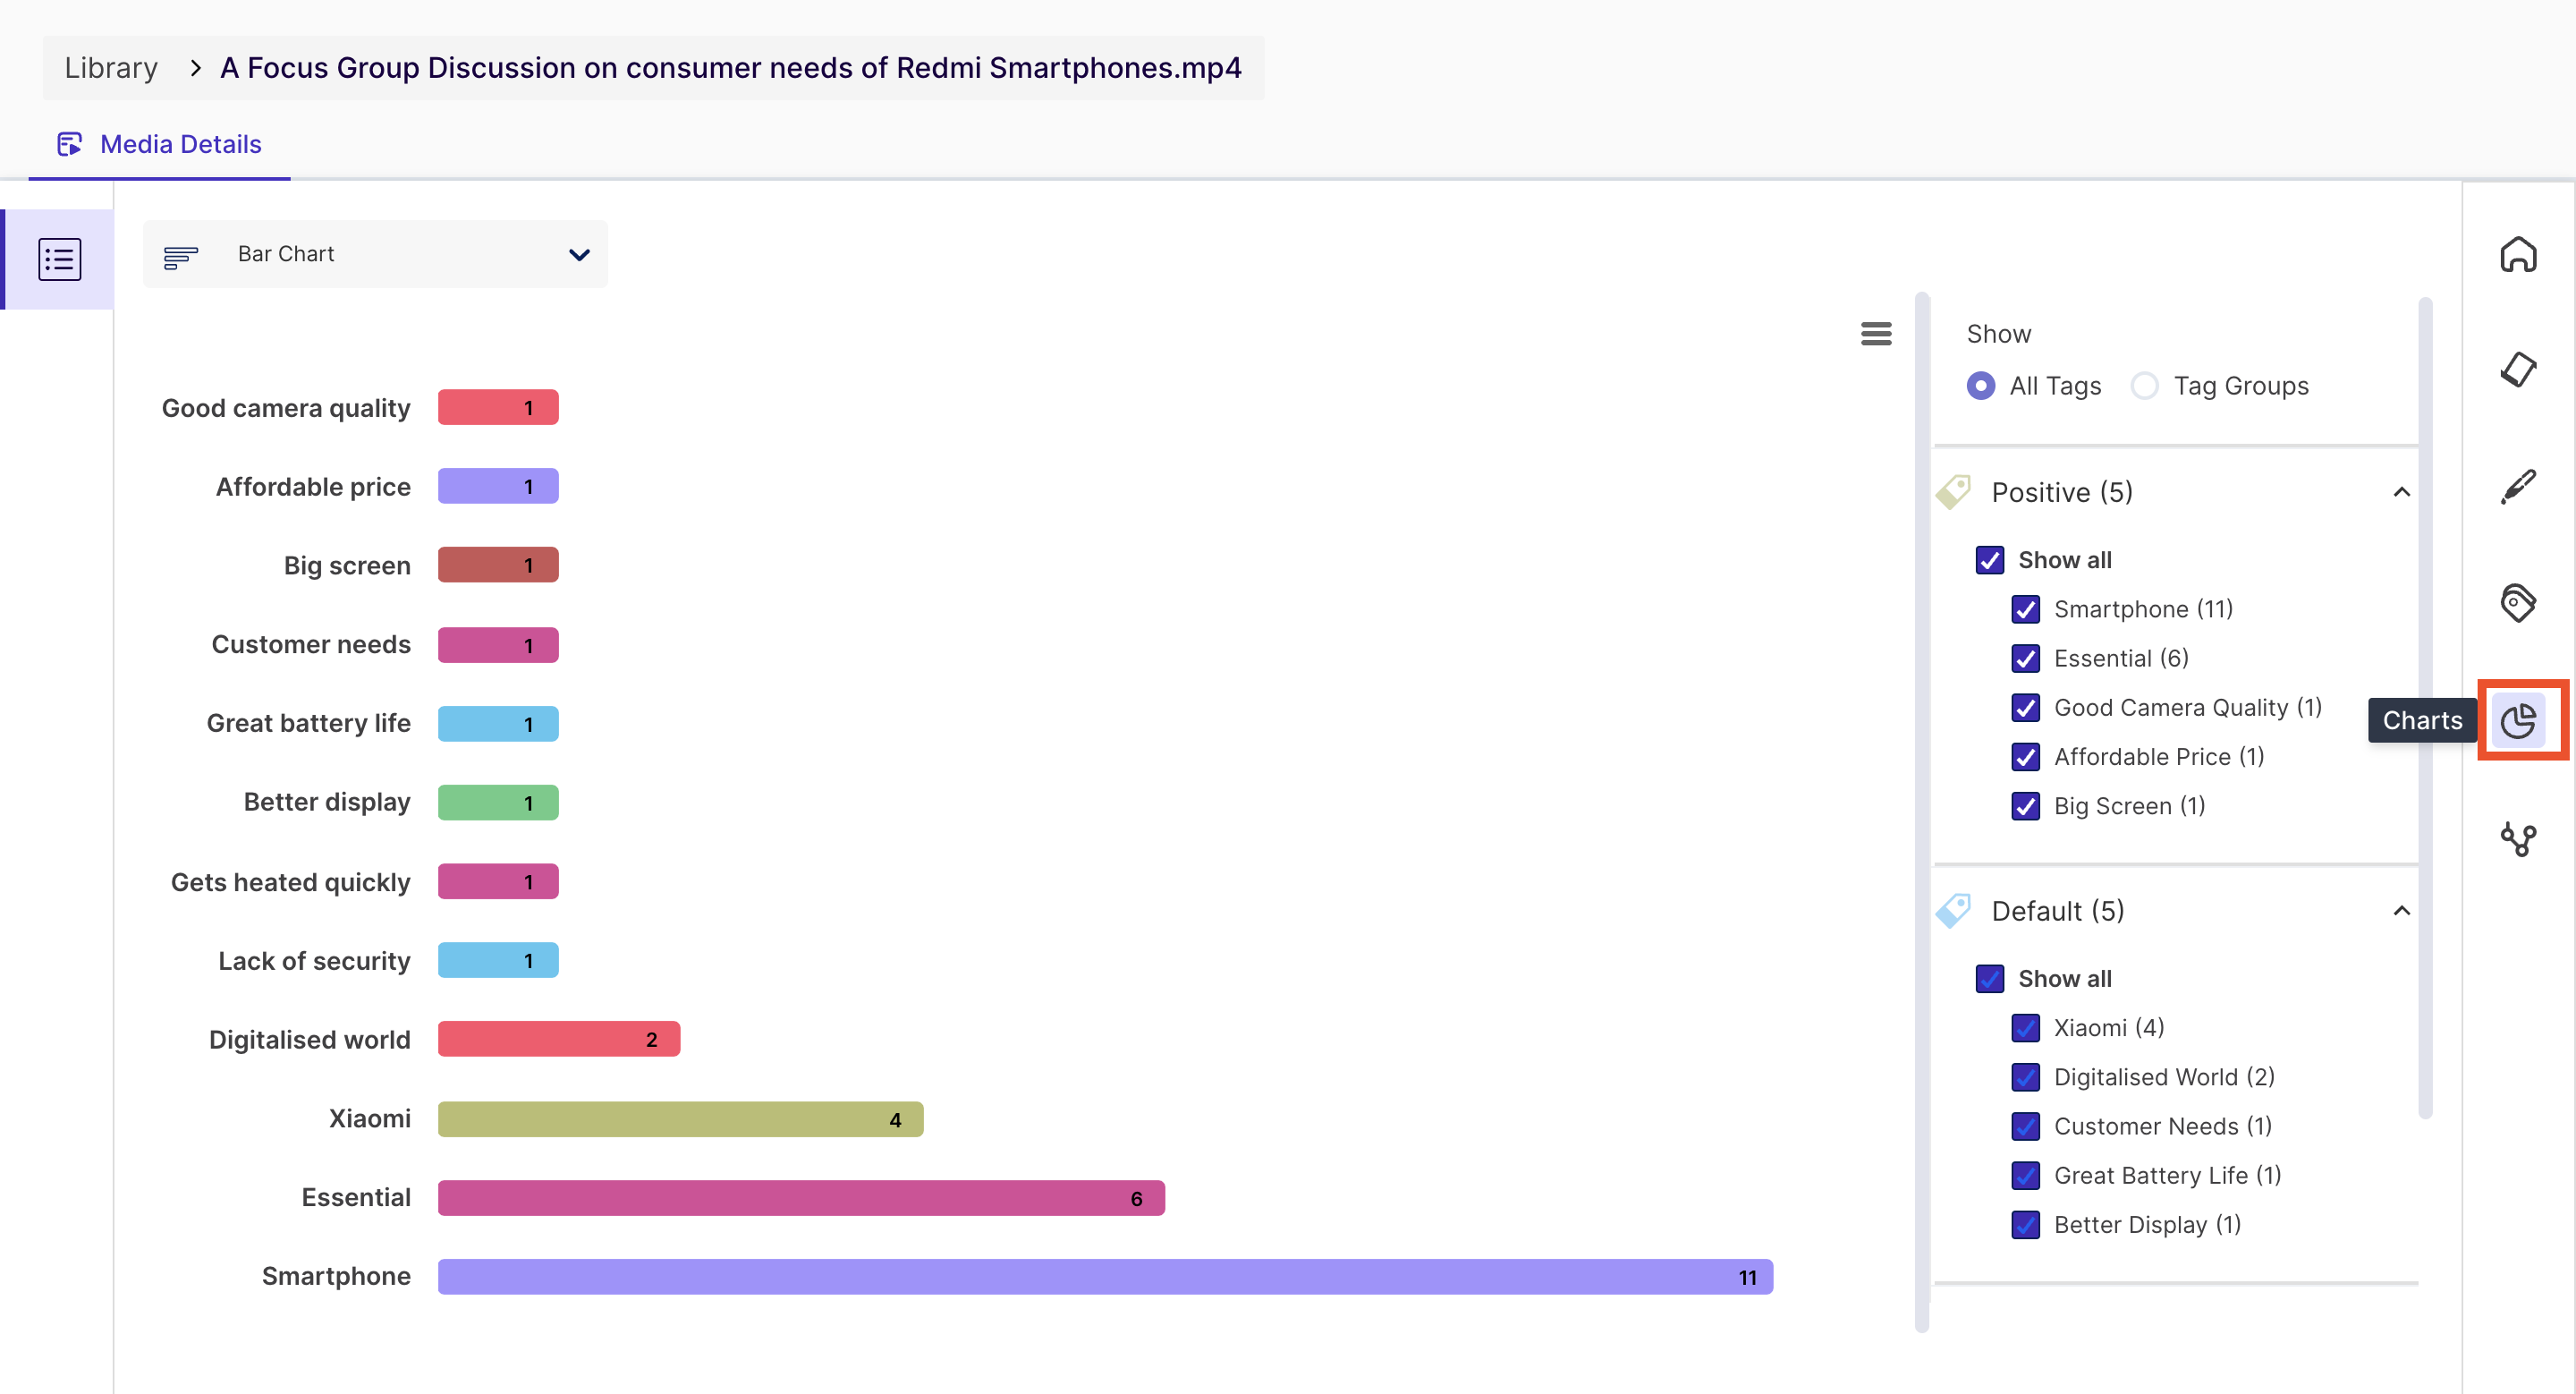
Using the chart selection dropdown, you can select the chart type. The available charts are:
- Bar Chart
- Bubble Chart
- Pie Chart
- Tree Map
- Radar Plot
Step 4: From the panel available on the right-hand side, you can customise the chart by selecting or deselecting the tags, just check or uncheck the checkboxes for the tags.
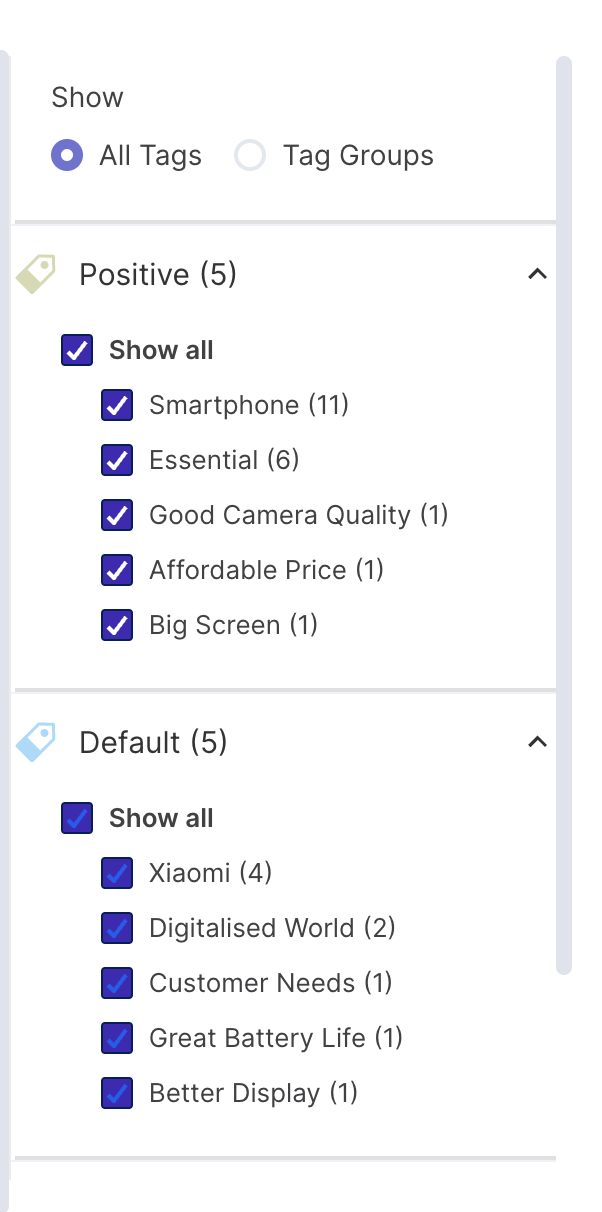
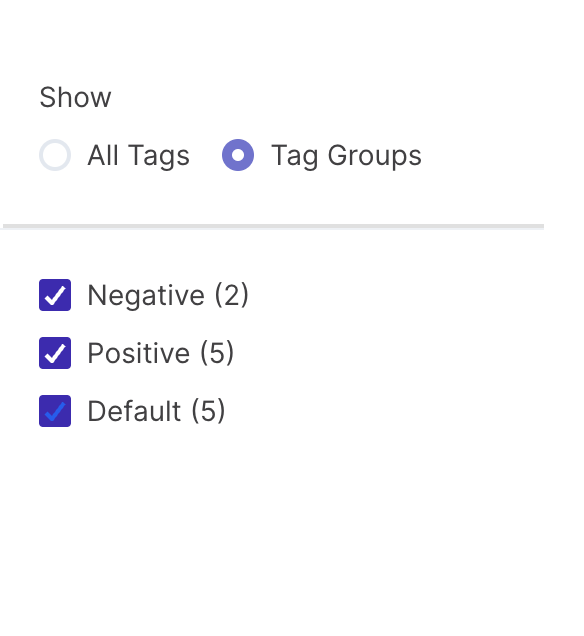
You can also view charts based on the tag groups you created in the “Tags” section.
For this, click on the radio button “Tag Group” and select or deselect the tag groups for the chart.