In-Context Blocks Insights
Overview
Once your study is live and responses are collected, you can view the results in the Results tab. For each Social Media In-Context block, results are shown at the block level, across all creatives in the block and at the individual creative level.
Overall Results
This section provides an overview of how your study performed across all blocks.
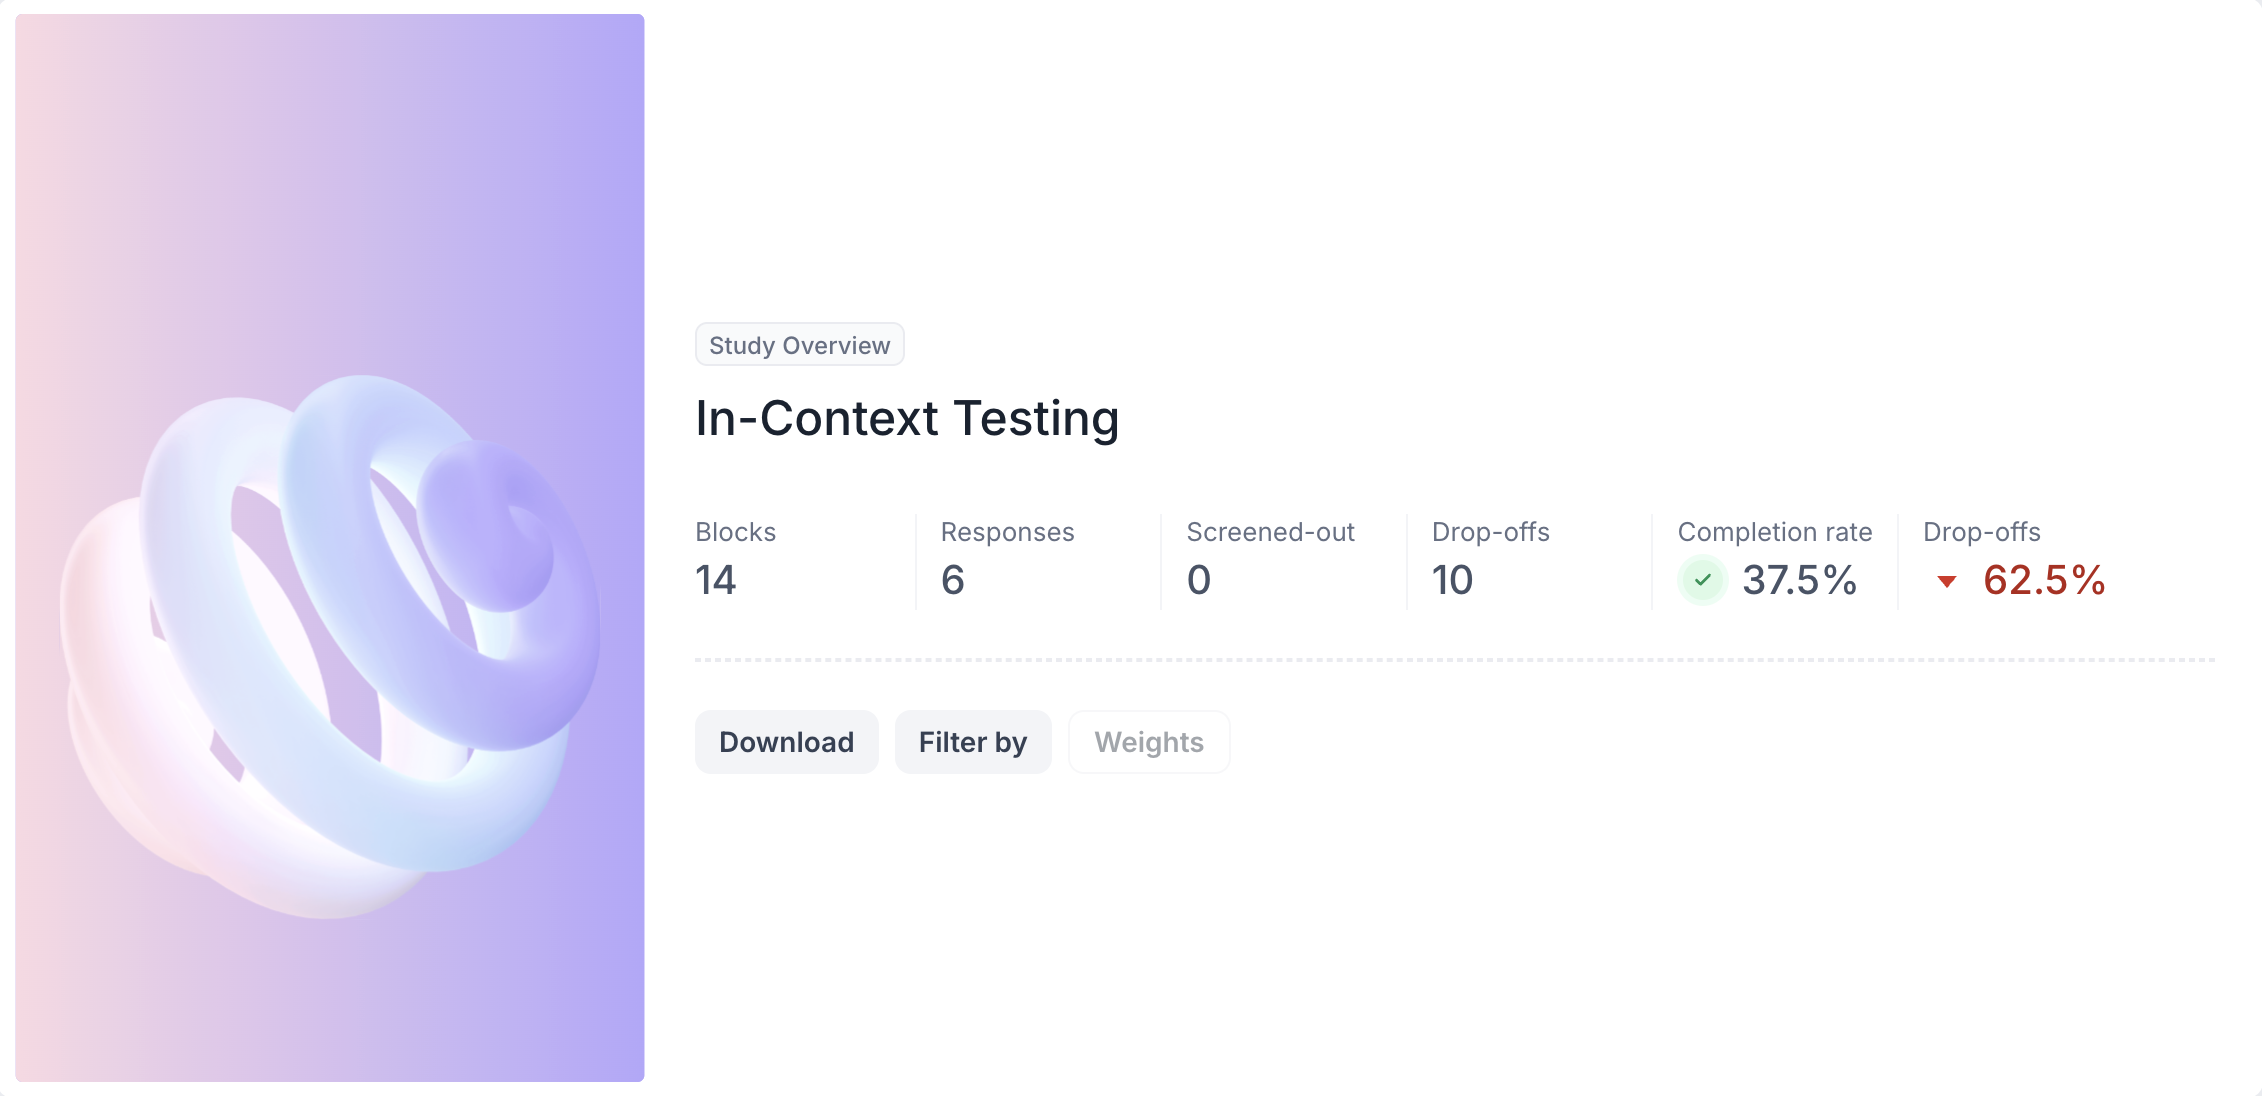
1. Top Summary
- Total Blocks: Number of question blocks included in the study
- Total Responses: Count of completed responses across all blocks
- Screened Out: Respondents who did not qualify based on screener logic
- Dropped Off: Respondents who exited the study midway
- Completion Rate: Percentage of respondents who completed the full study
- Drop Off Rate: Percentage of respondents who exited before completion
2. Study Level Download
Download all collected response data at the study level, covering every block and question.
3. Filter Responses
Use the filter panel at the top of the results view to analyse specific respondent segments. You can filter based on:
- Answers from previous questions
- Device type such as mobile or desktop
- Browser used such as Chrome or Safari
Block Level Summary
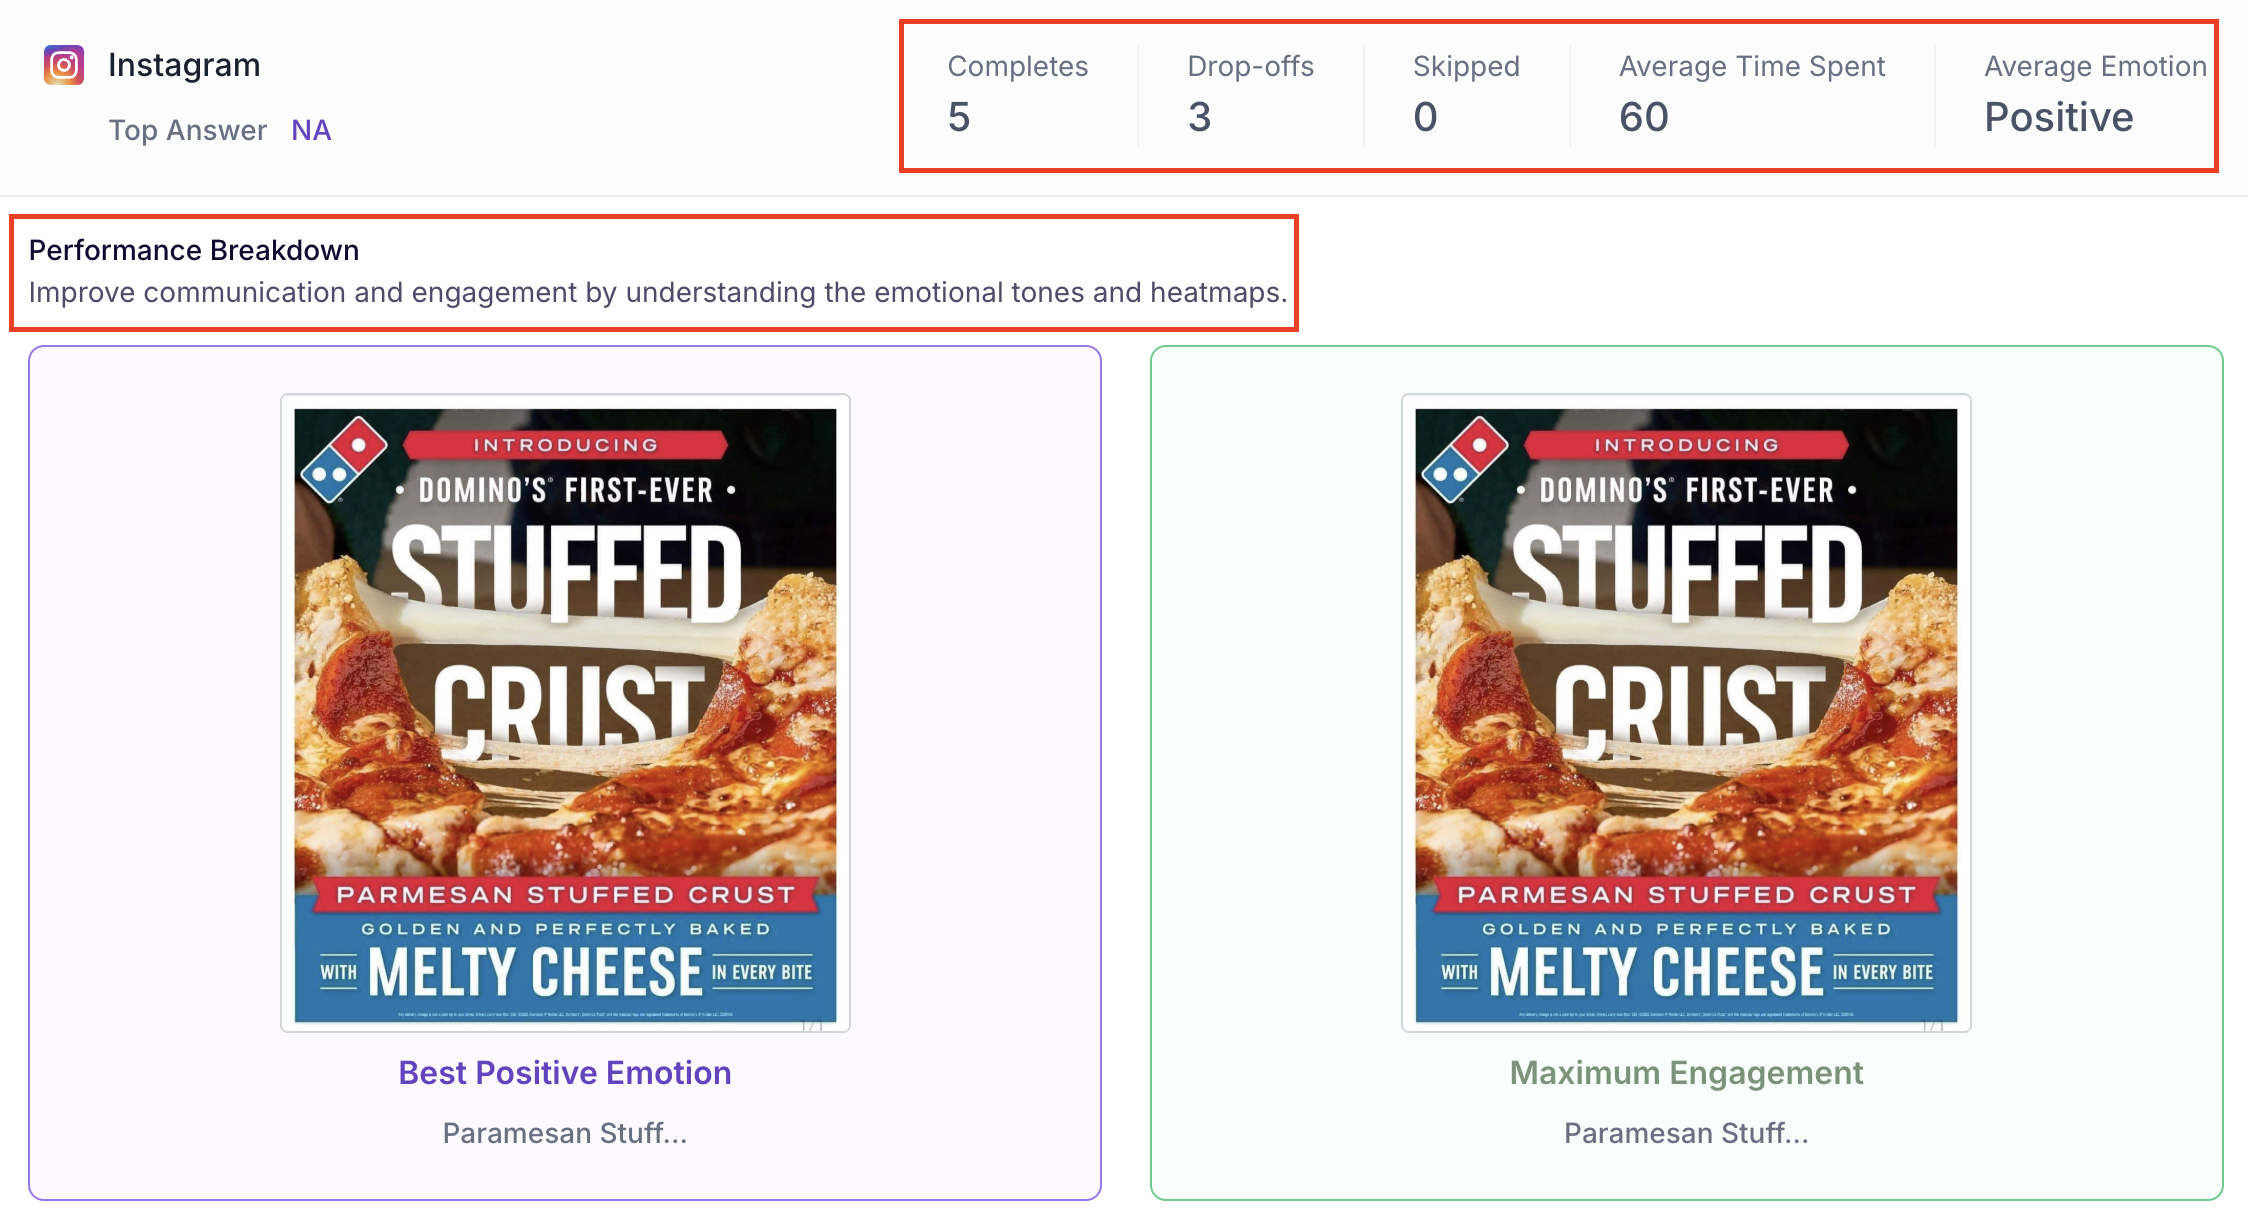
At the top of each block's results view, the following metrics are displayed.
- Completes: Number of participants who completed this block
- Drop-offs: Participants who exited the study before reaching this block
- Skipped: Participants who viewed the block but did not respond
- Average Time Spent: Average time participants spent viewing the creatives in this block
- Average Emotion: The overall emotional sentiment expressed by participants across all creatives in this block, shown as Positive, Negative or Neutral
- Top Answer: The most selected response if a follow up question is attached to this block
Performance Breakdown
Below the block metrics, two highlight cards identify the top performing creatives in the block.
- Best Positive Emotion: the creative that generated the most positive emotional response across participants
- Maximum Engagement: the creative that received the highest engagement score
These cards help you quickly identify which creative performed best before diving into the detailed results.
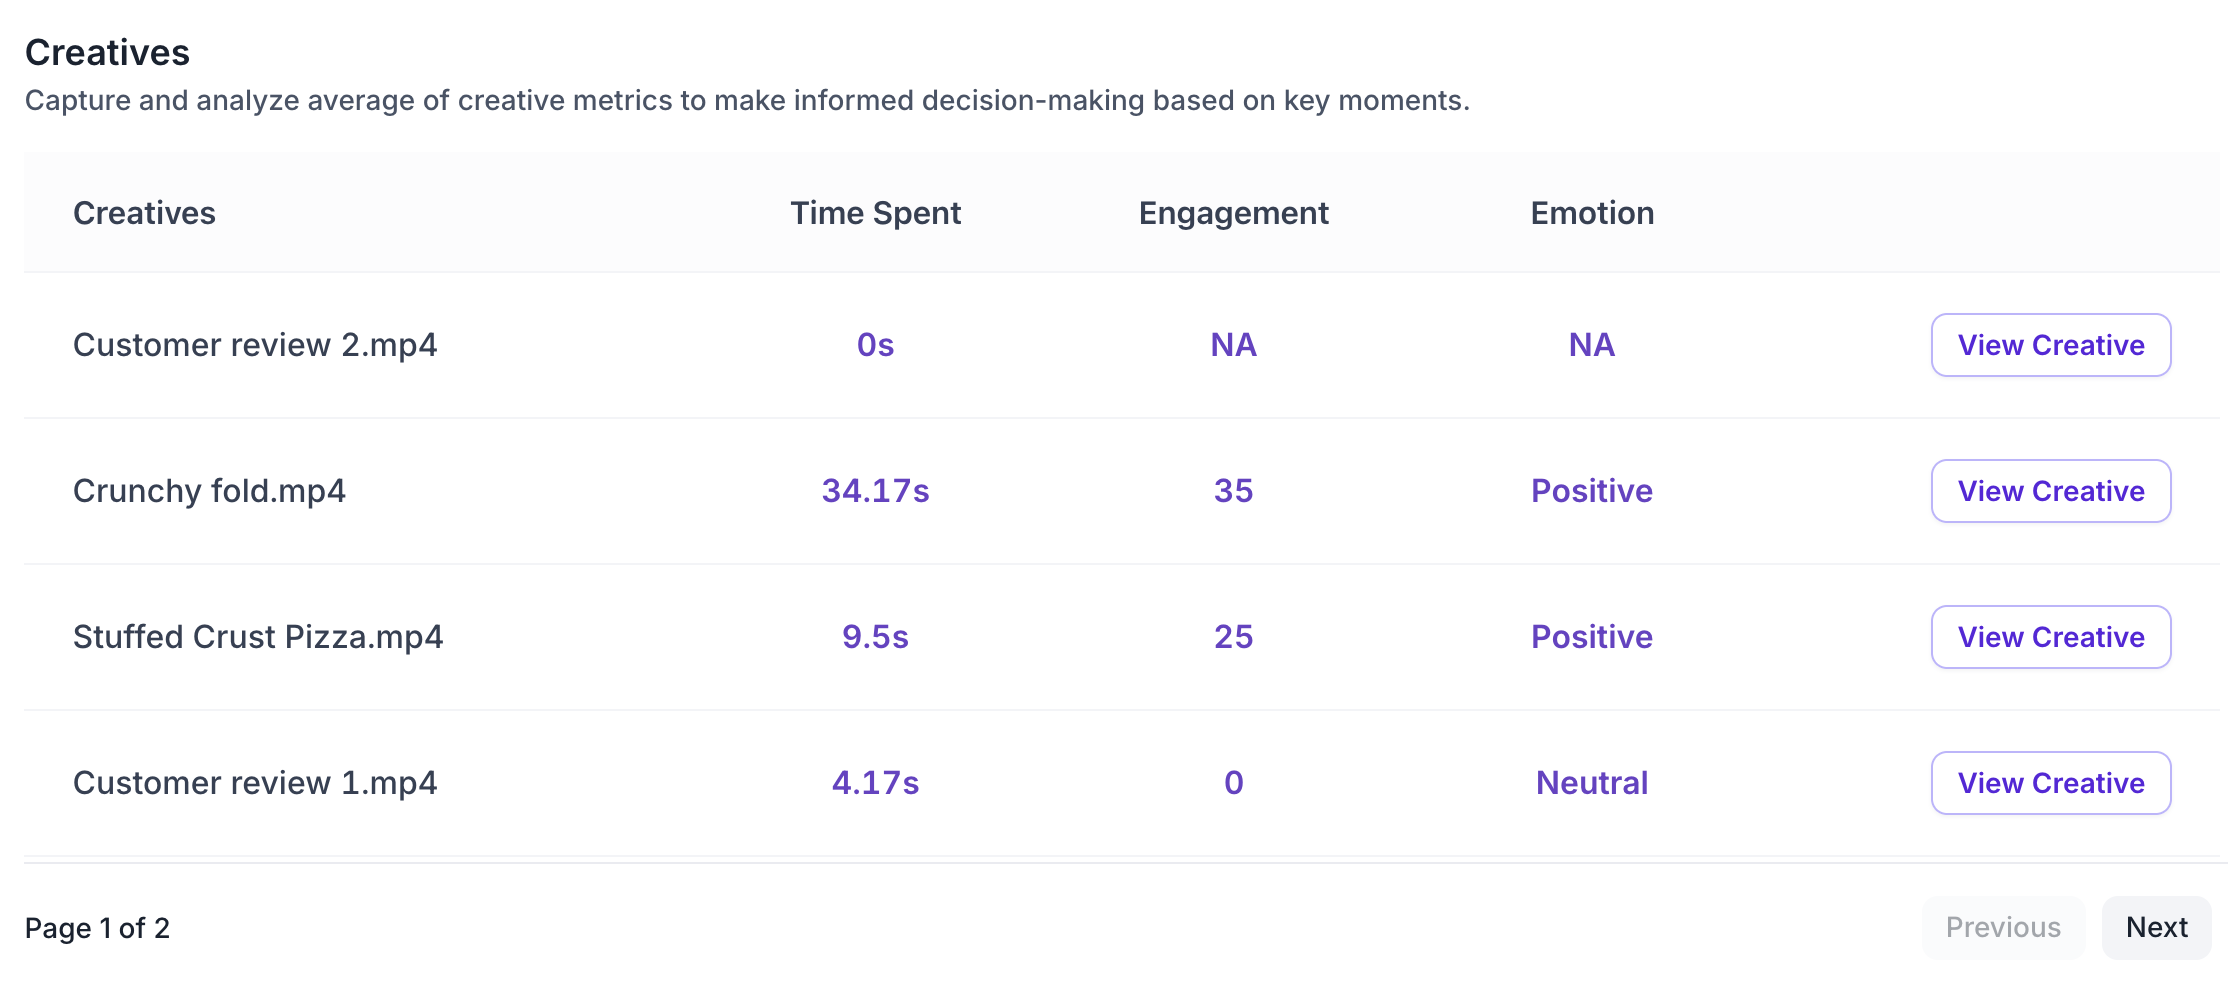
Creatives List
Below the performance breakdown, all creatives uploaded to the block are listed in a table. This gives you a comparative view of how each creative performed. For each creative, the table shows:
- Time Spent: average time participants spent viewing this creative
- Engagement: average engagement score for this creative
- Emotion: overall emotional sentiment for this creative, shown as Positive, Negative or Neutral
Click View Creative to access the detailed results for an individual creative.
Creative Level Results
The creative level view provides a detailed breakdown of how participants responded to a single creative. It includes summary metrics, visual attention data, Areas of Interest and graph based analysis.
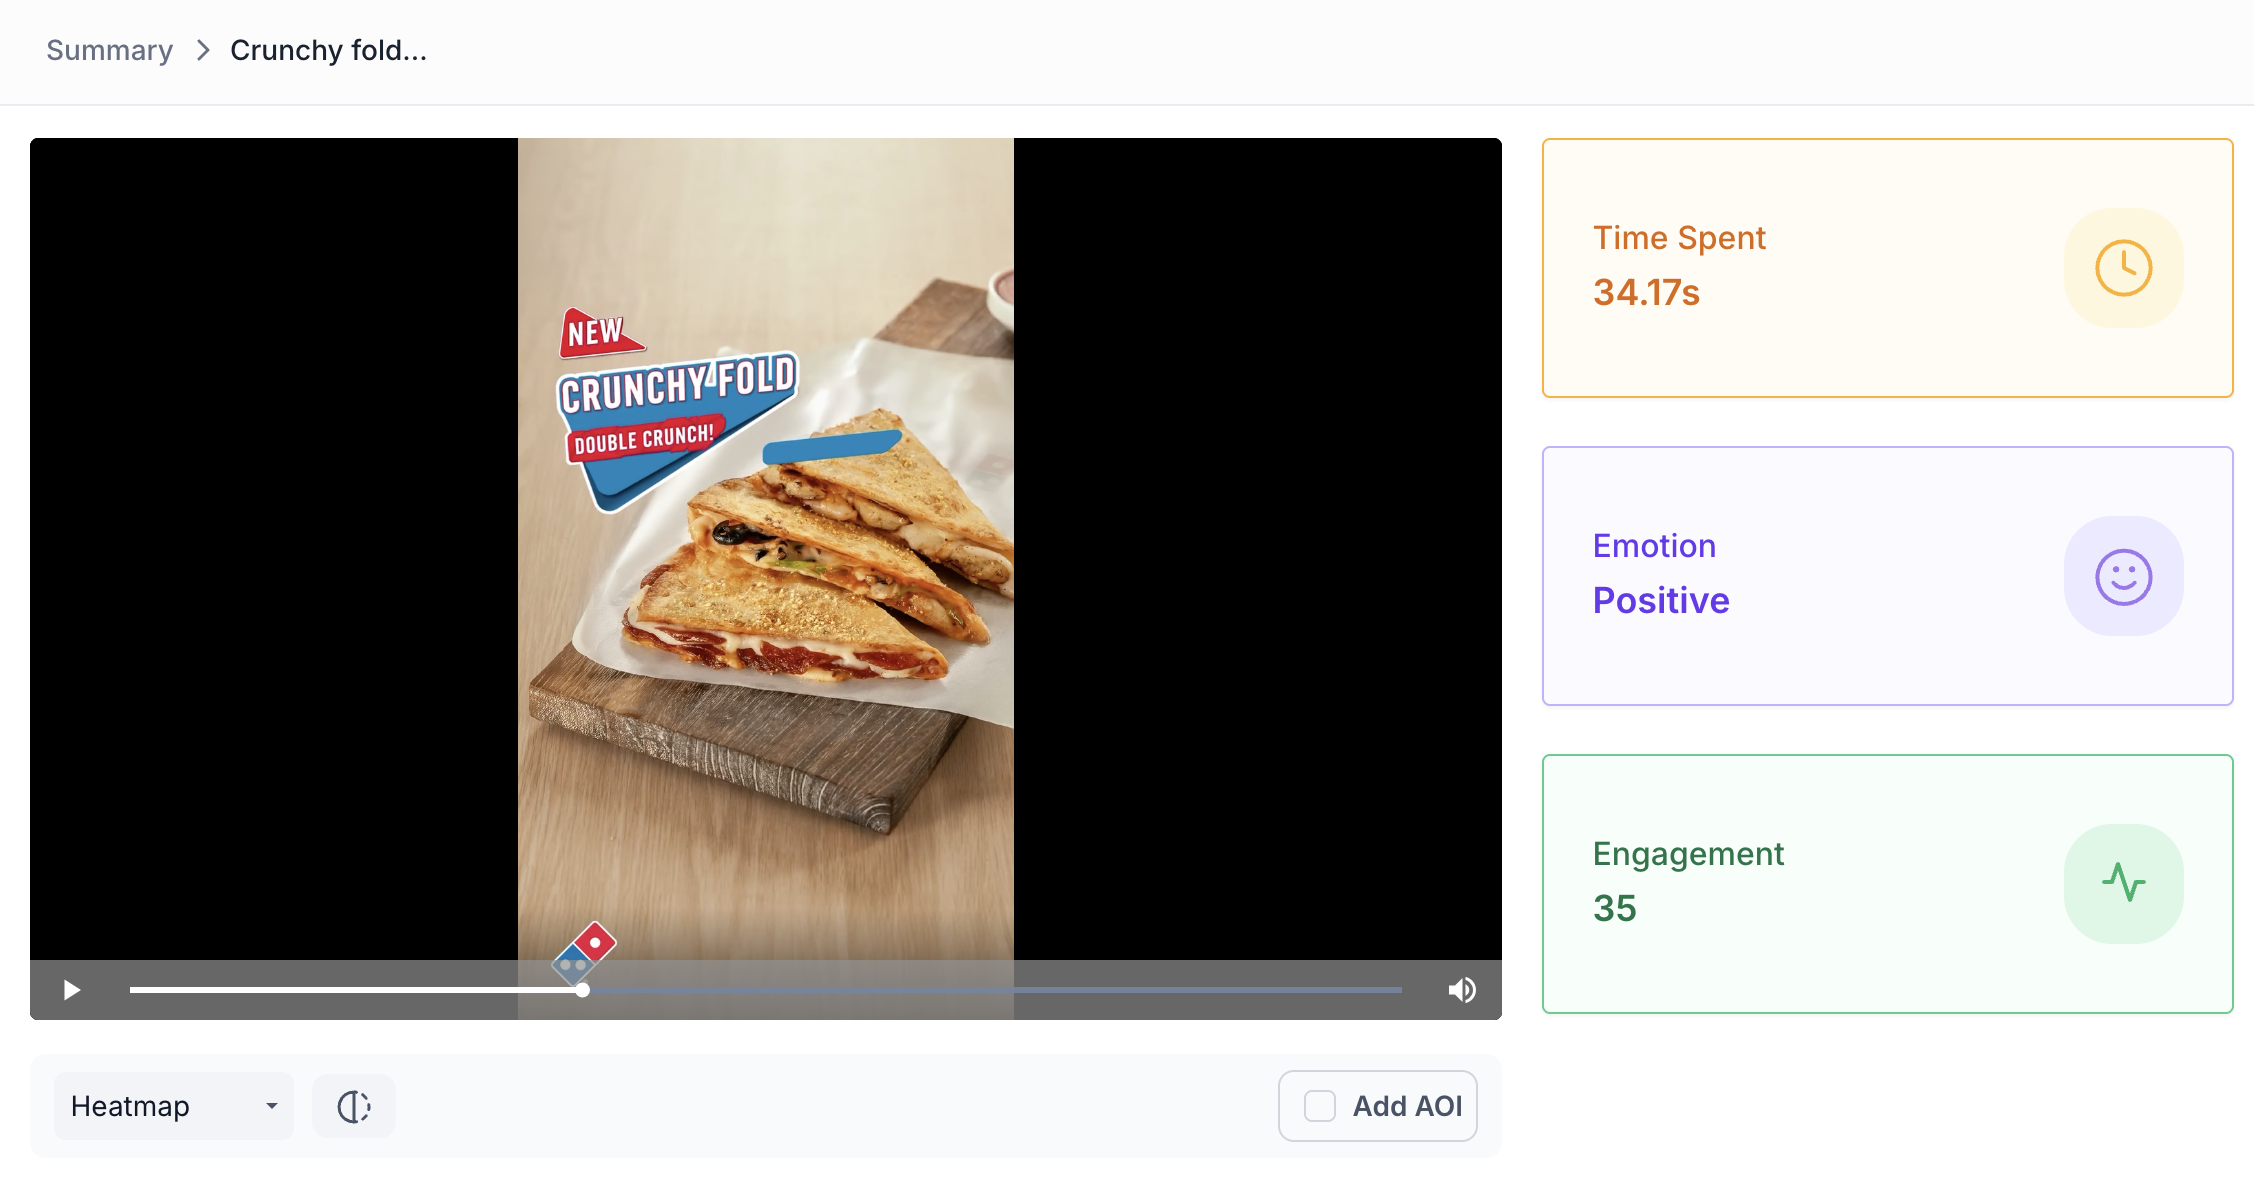
1. Summary Metrics
Three metric cards are displayed at the top right of the creative view.
- Time Spent: average time participants spent viewing this creative
- Emotion: overall emotional sentiment expressed by participants for this creative
- Engagement: average engagement score for this creative, measured on a scale of 0 to 100
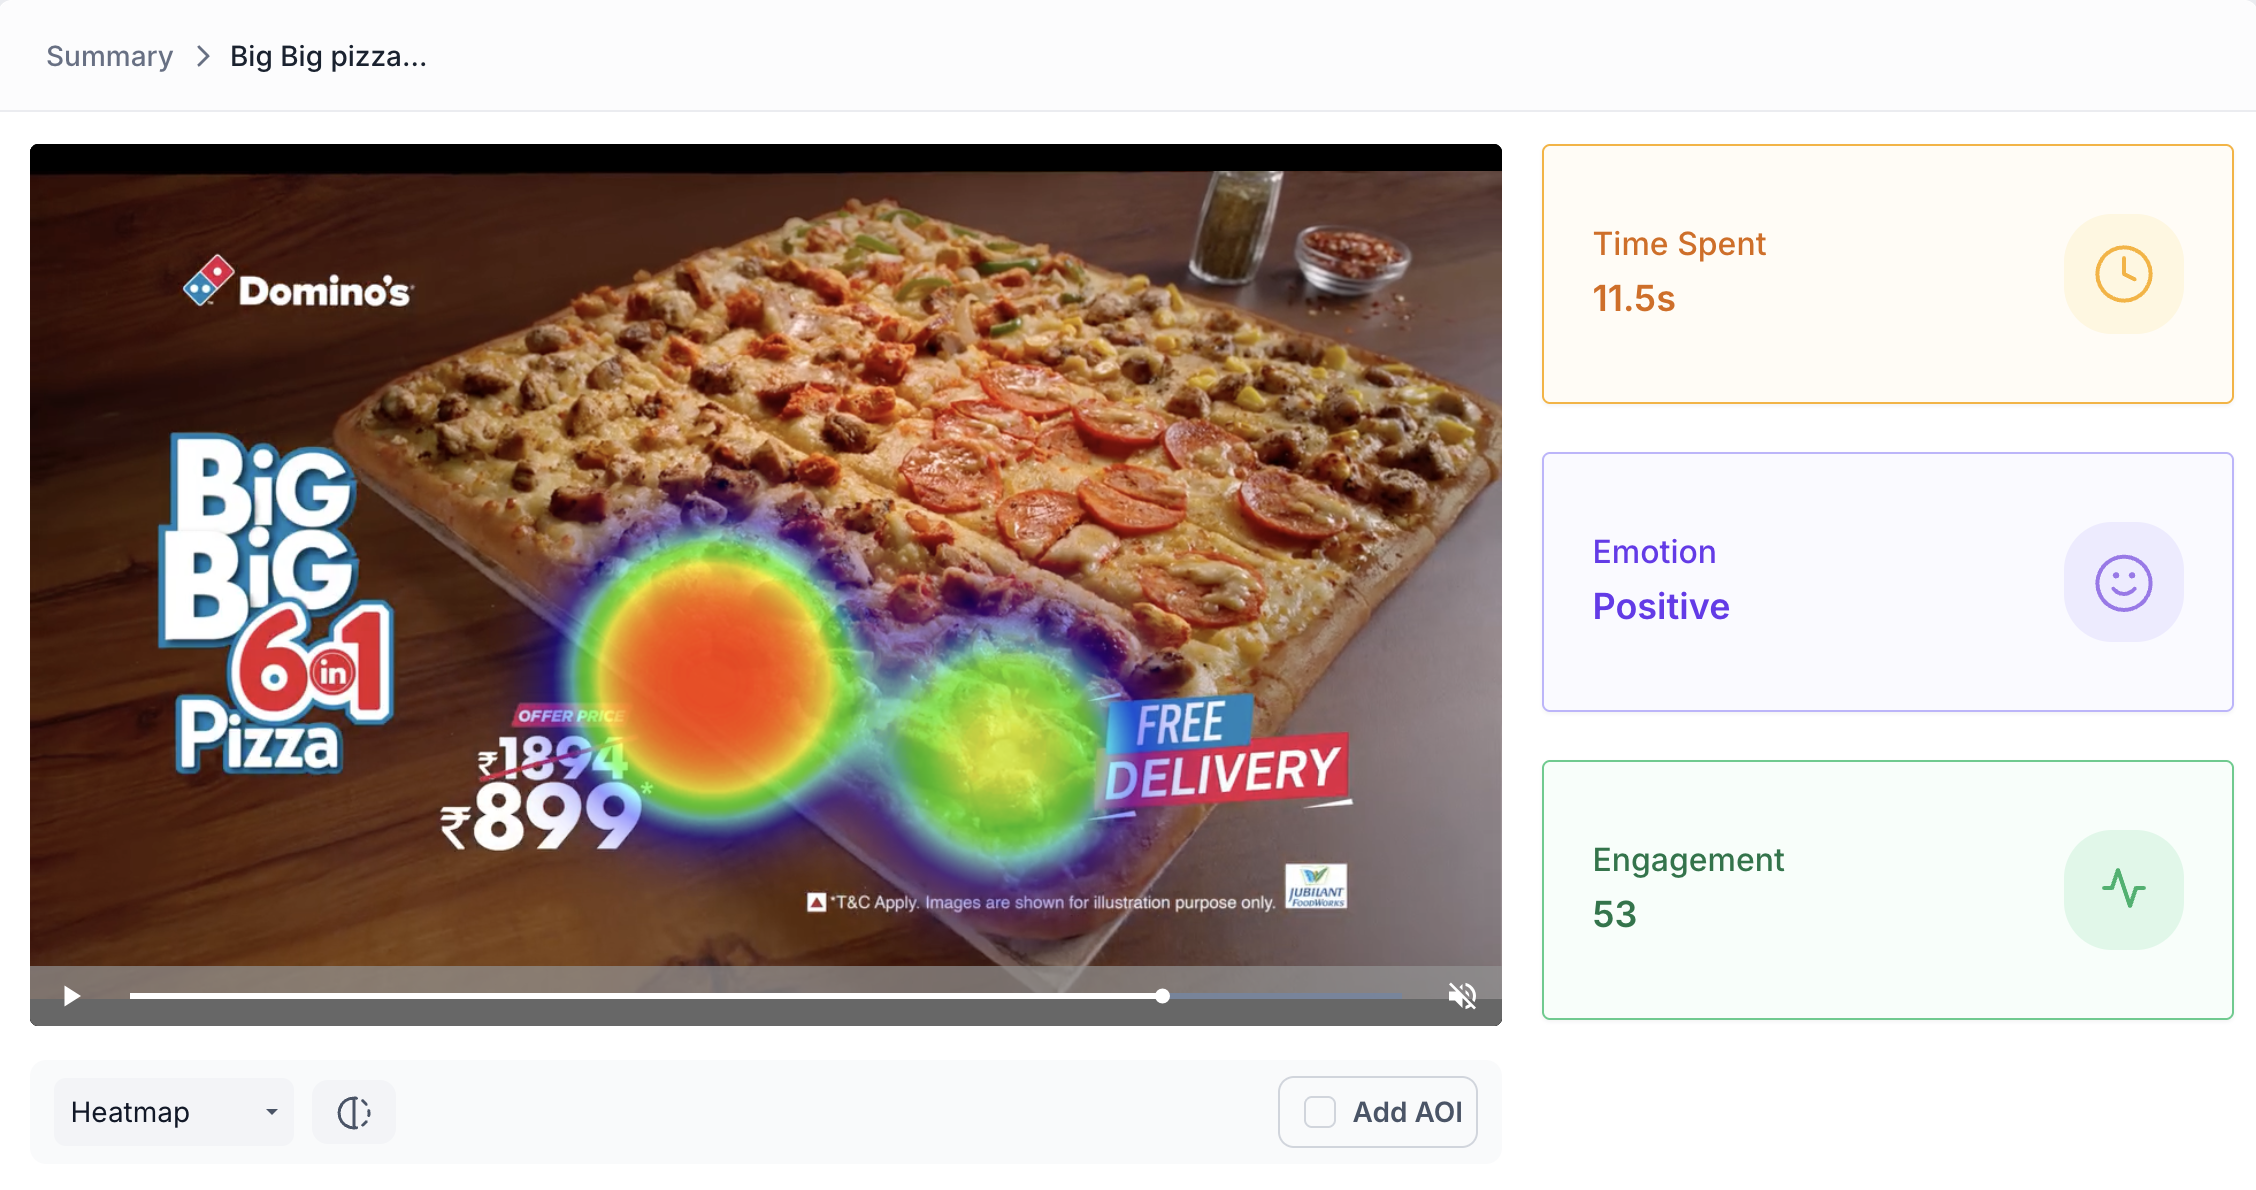
2. Heatmap and Transparency Map
The creative is displayed with a visual overlay showing where participants looked. Use the dropdown below the creative to switch between Heatmap and Transparency Map views.
Heatmap
Displays aggregated gaze intensity using a colour gradient from cool to warm. Warmer colours such as red and orange highlight areas that received the most visual attention. Cooler colours indicate areas that received less attention.
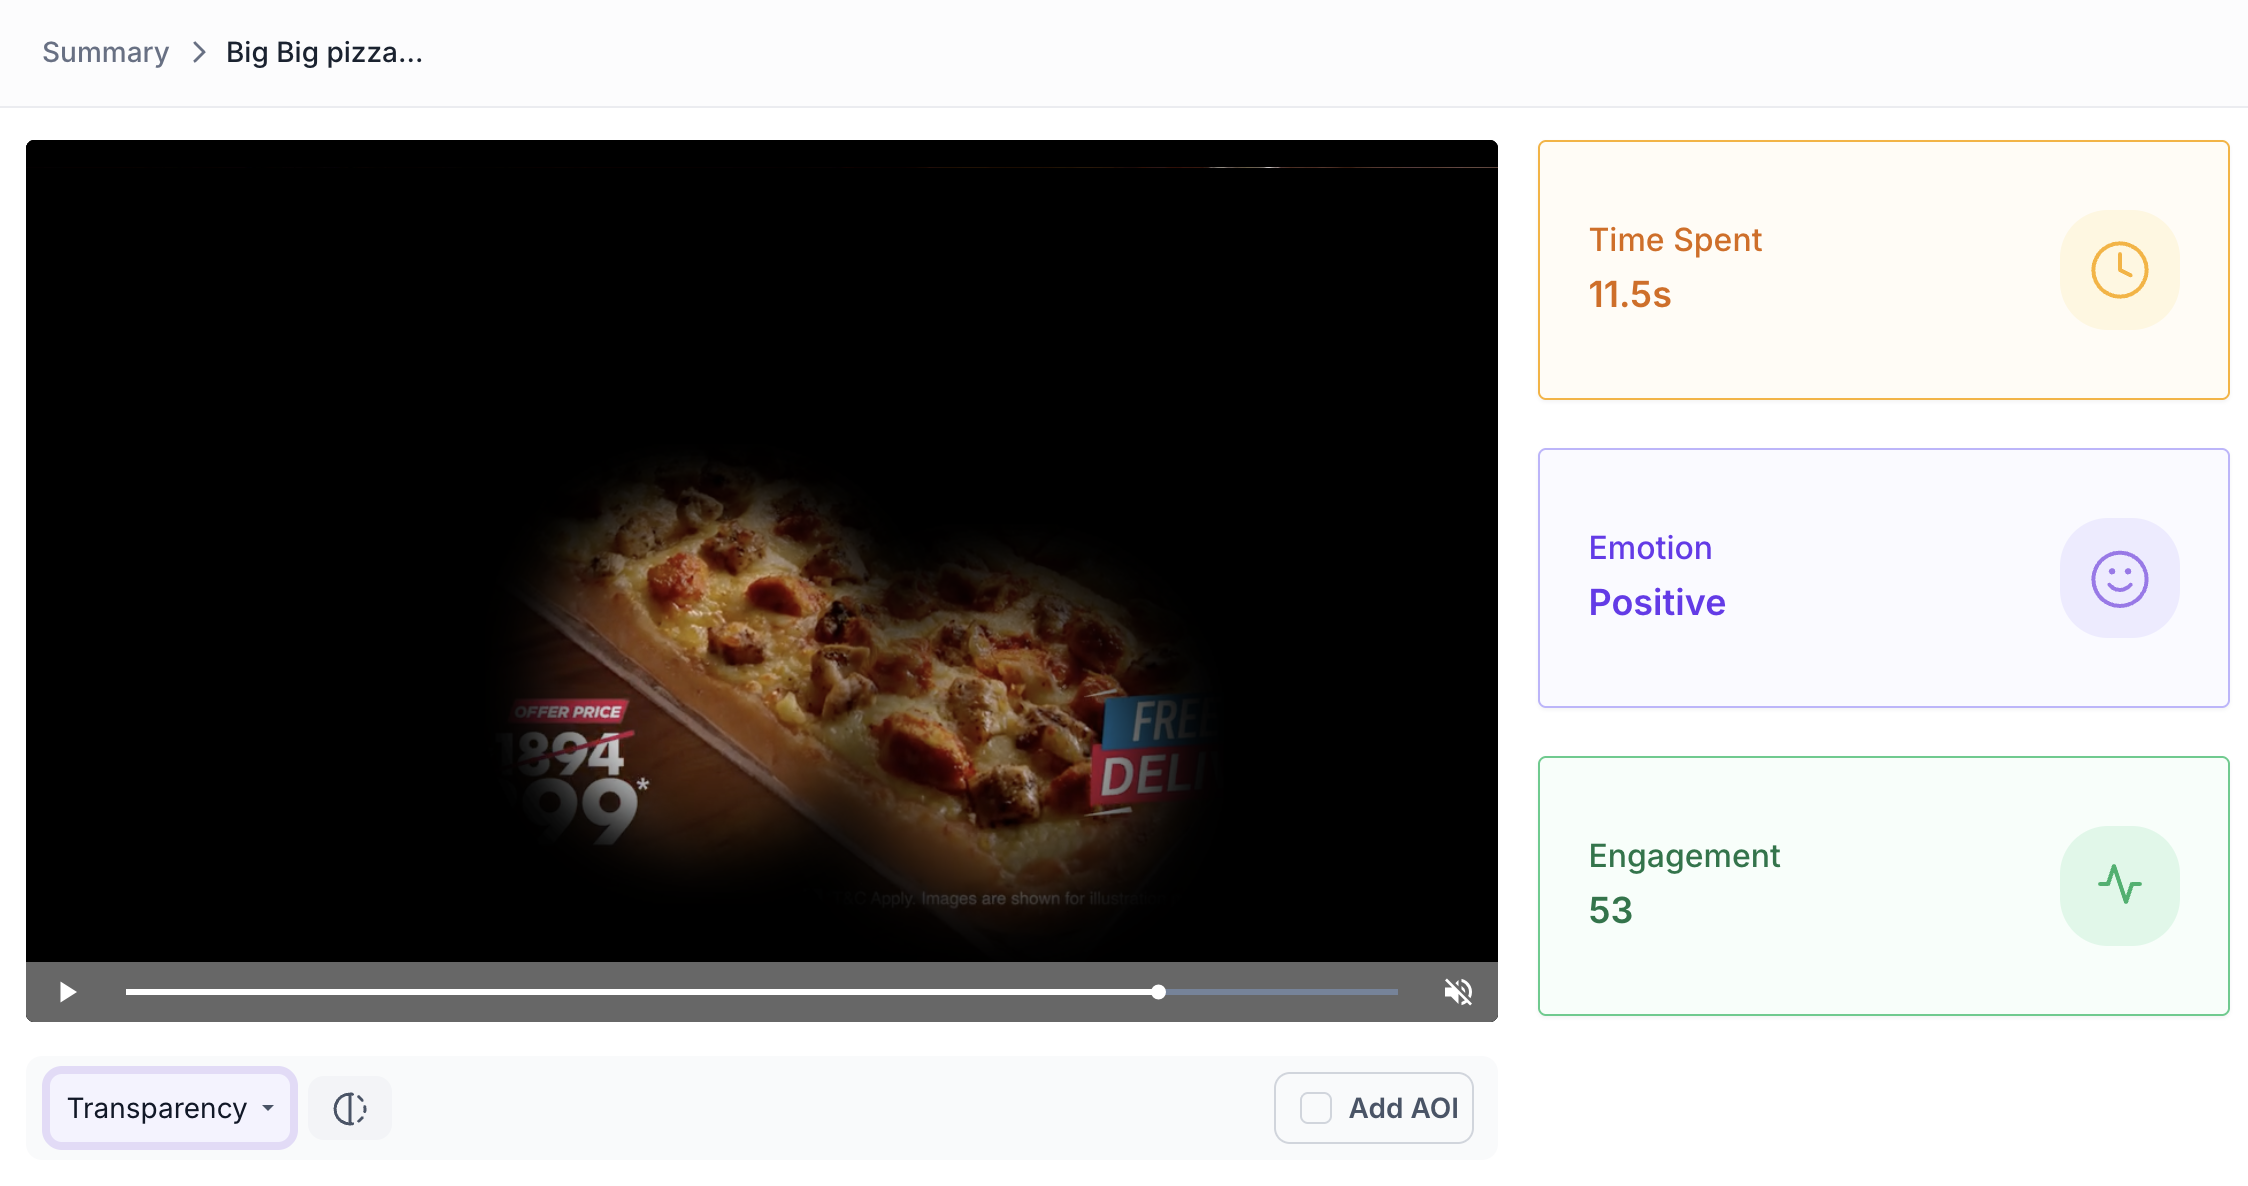
Transparency Map
Makes areas of the creative more transparent where participants looked most, providing a clear view of attention distribution without the colour overlay of the heatmap.
The heatmap display can be adjusted using three sliders:
- Radius: Controls the size of the gaze point area
- Shadow: Controls the depth of the colour intensity
- Blur: Controls how sharply the gaze points are defined
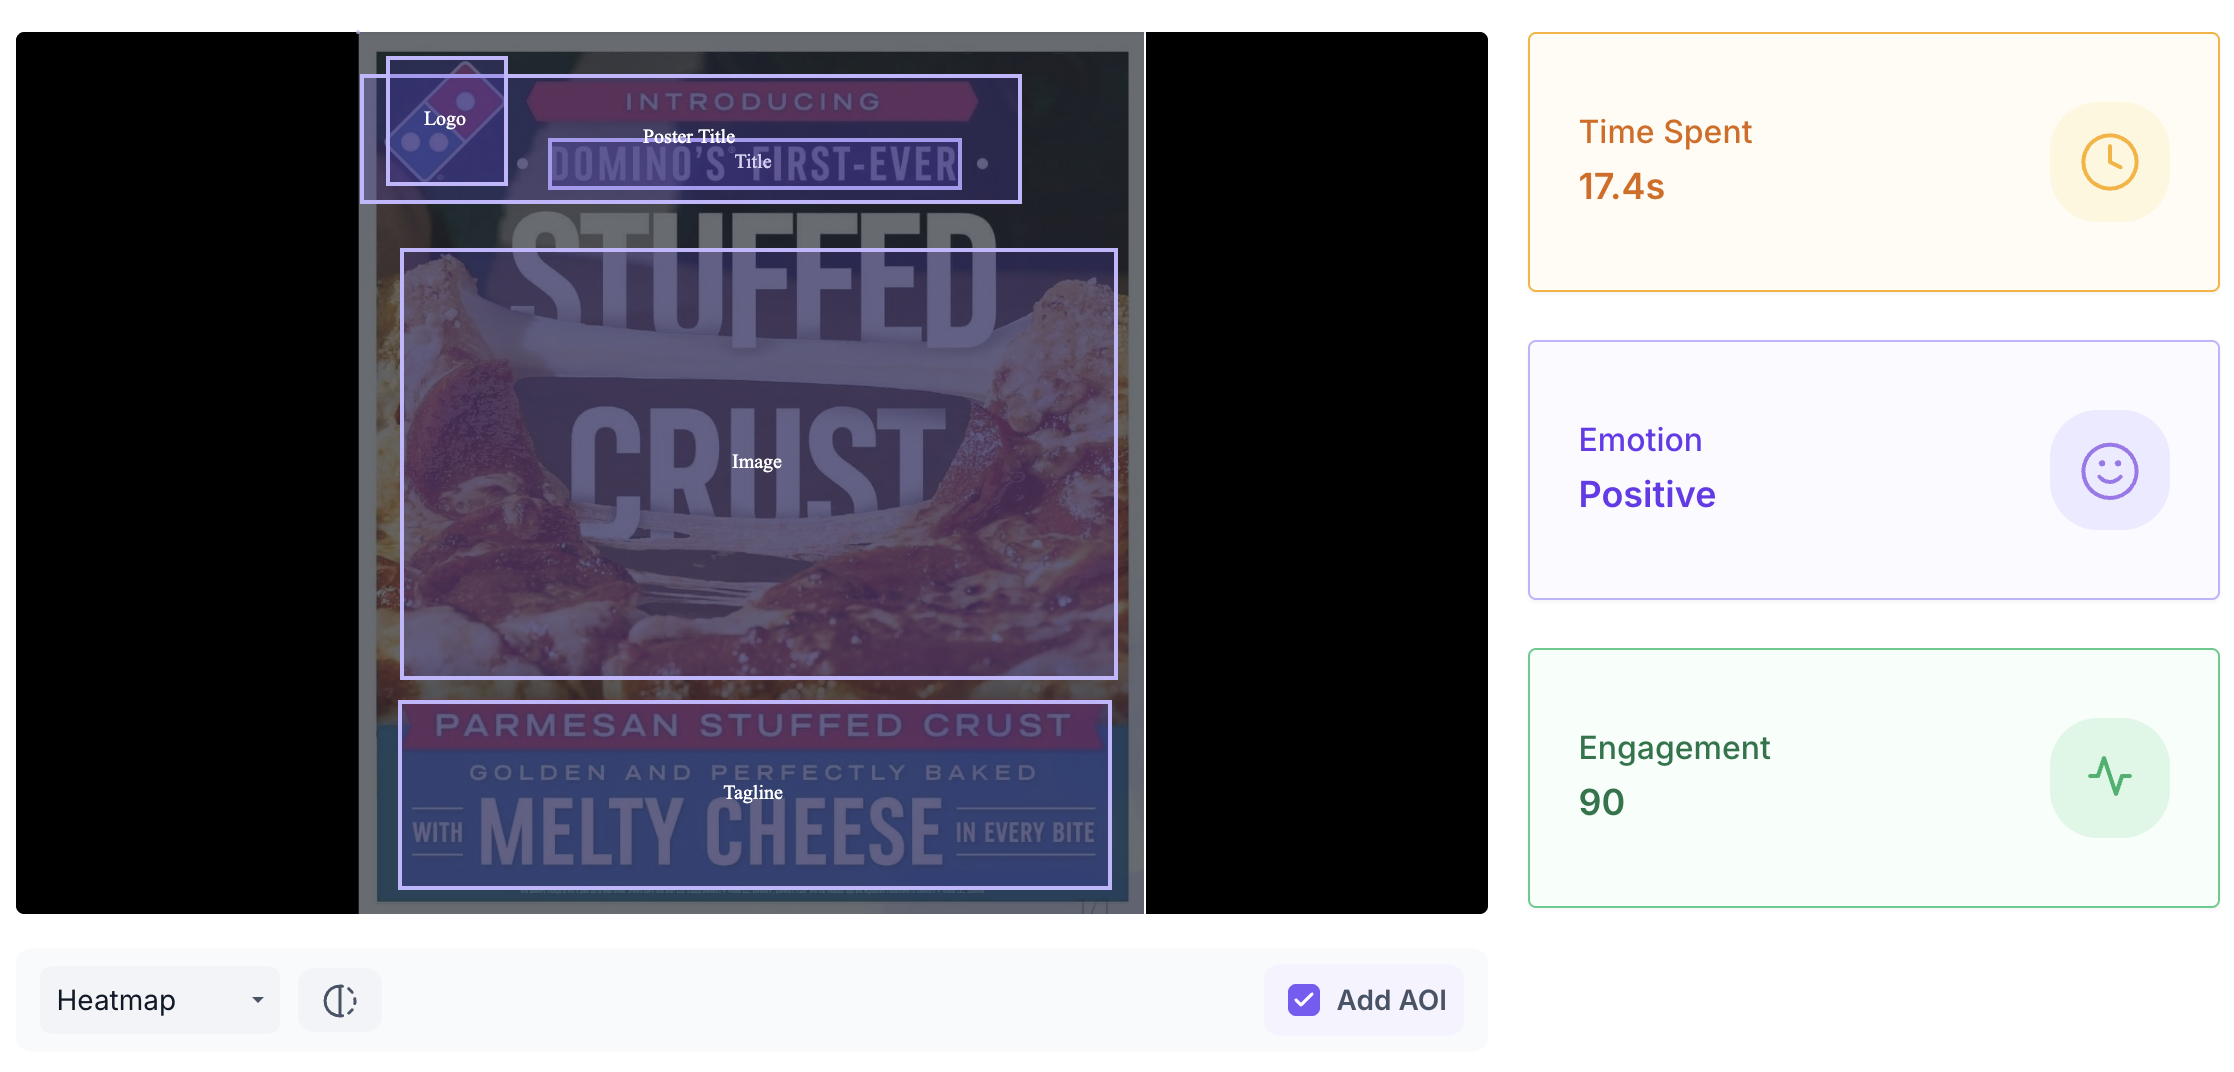
3. Areas of Interest
Areas of Interest allow you to track participant attention within a specific region of the creative, such as a brand logo, a call to action button or a product feature.
Creating an AOI
- Click Add AOI below the creative
- Draw a box over the area you want to track
- Give the AOI a name and set the time duration it should cover
- Click Save to finalise
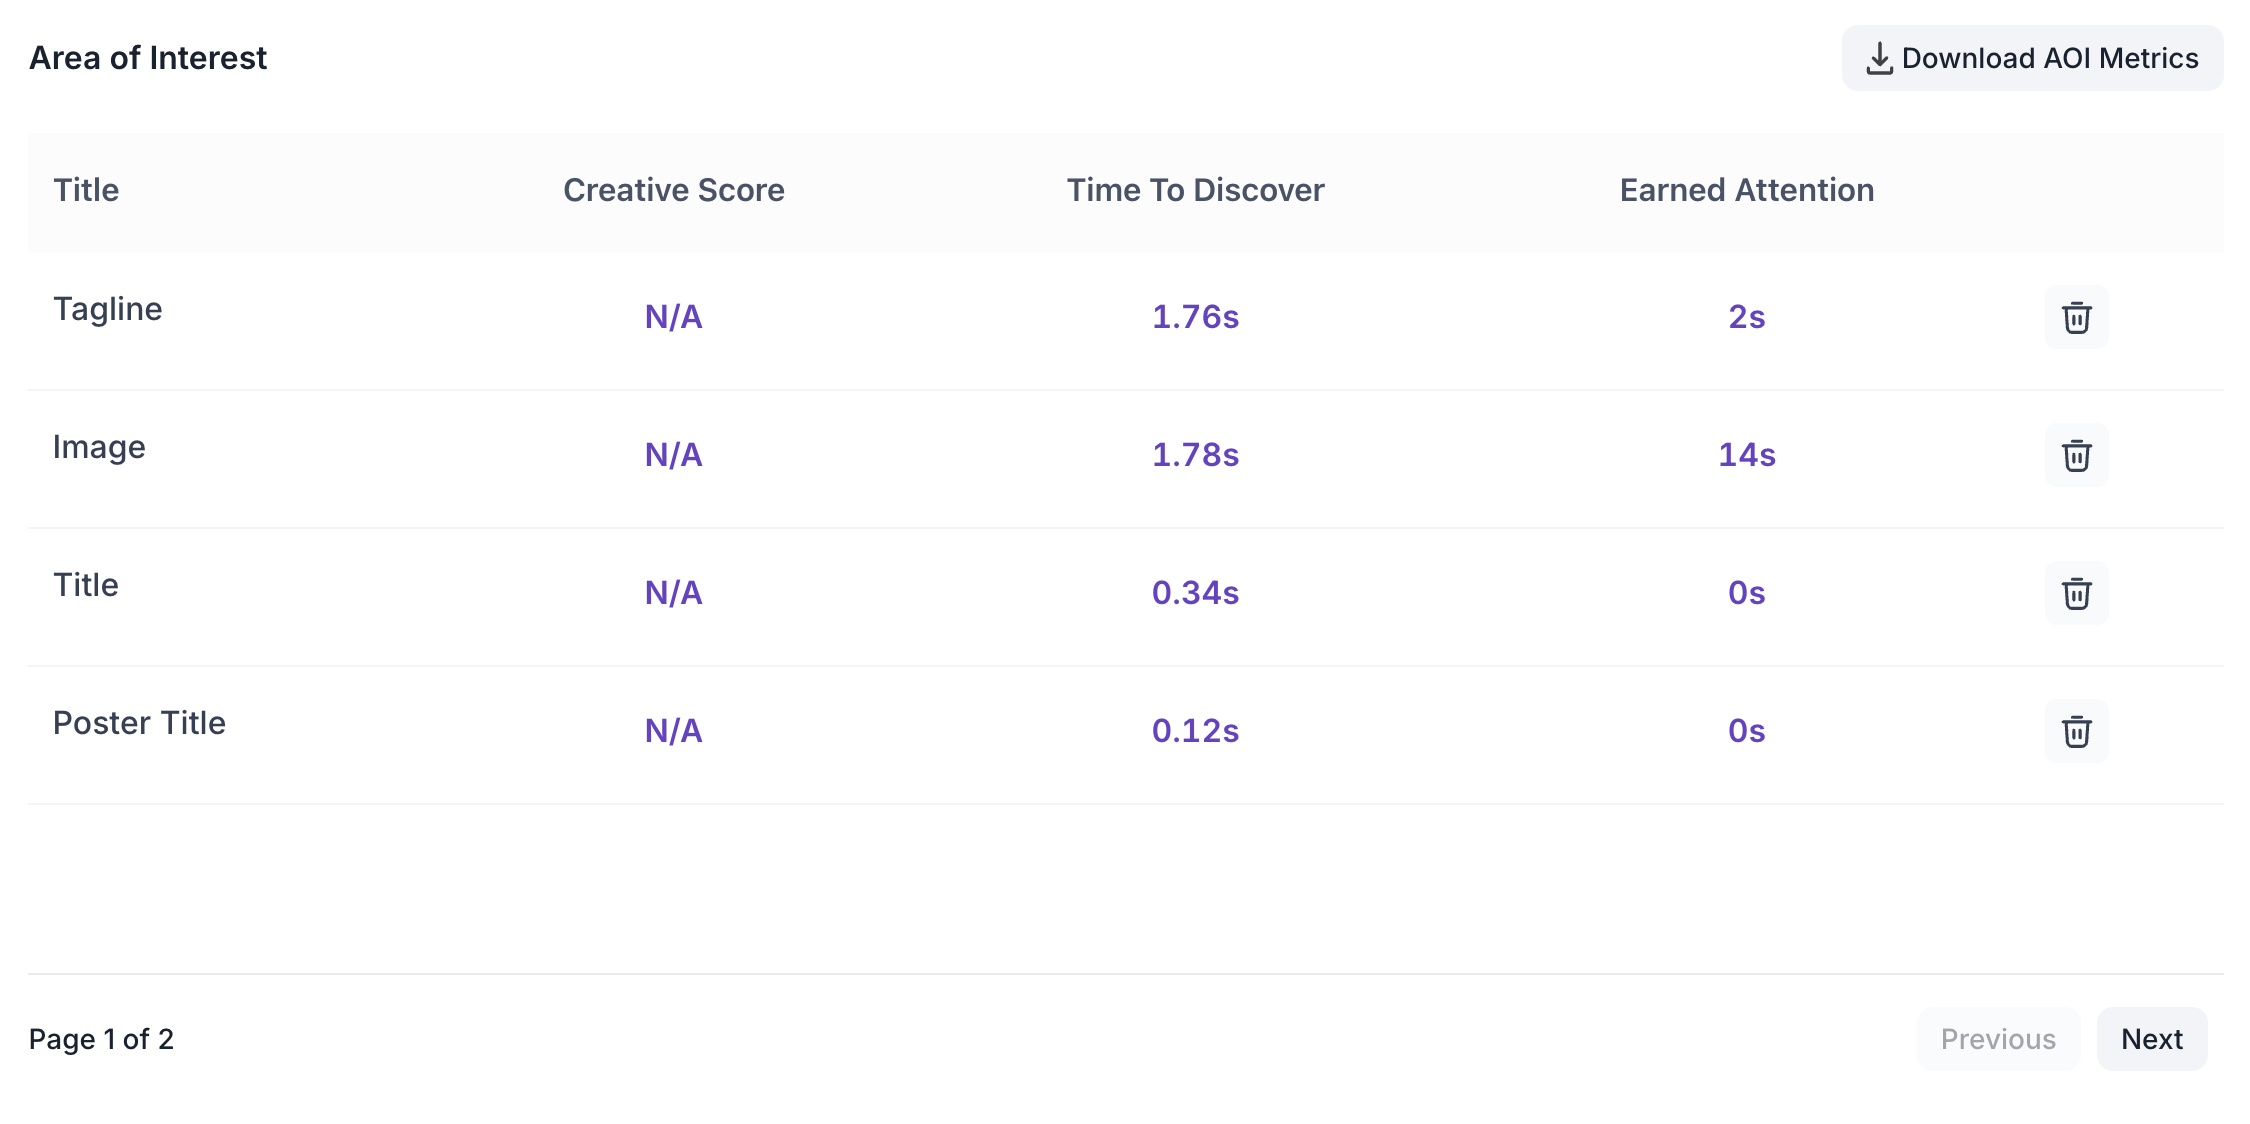
AOI Results
Once saved, each AOI appears in the Area of Interest table with the following metrics.
- Title: the name assigned to the AOI
- Creative Score: overall performance score for that area. Generated for video creatives only and will show N/A for images
- Time to Discover: average time taken by participants to first notice that area
- Earned Attention: total time that area held participant attention during the creative
AOI data can be downloaded as a CSV file using the Download AOI Metrics button at the top of the table.
4. Media Graph Metrics
Below the creative, two graphs are available. Use the dropdown at the top right to switch between them.
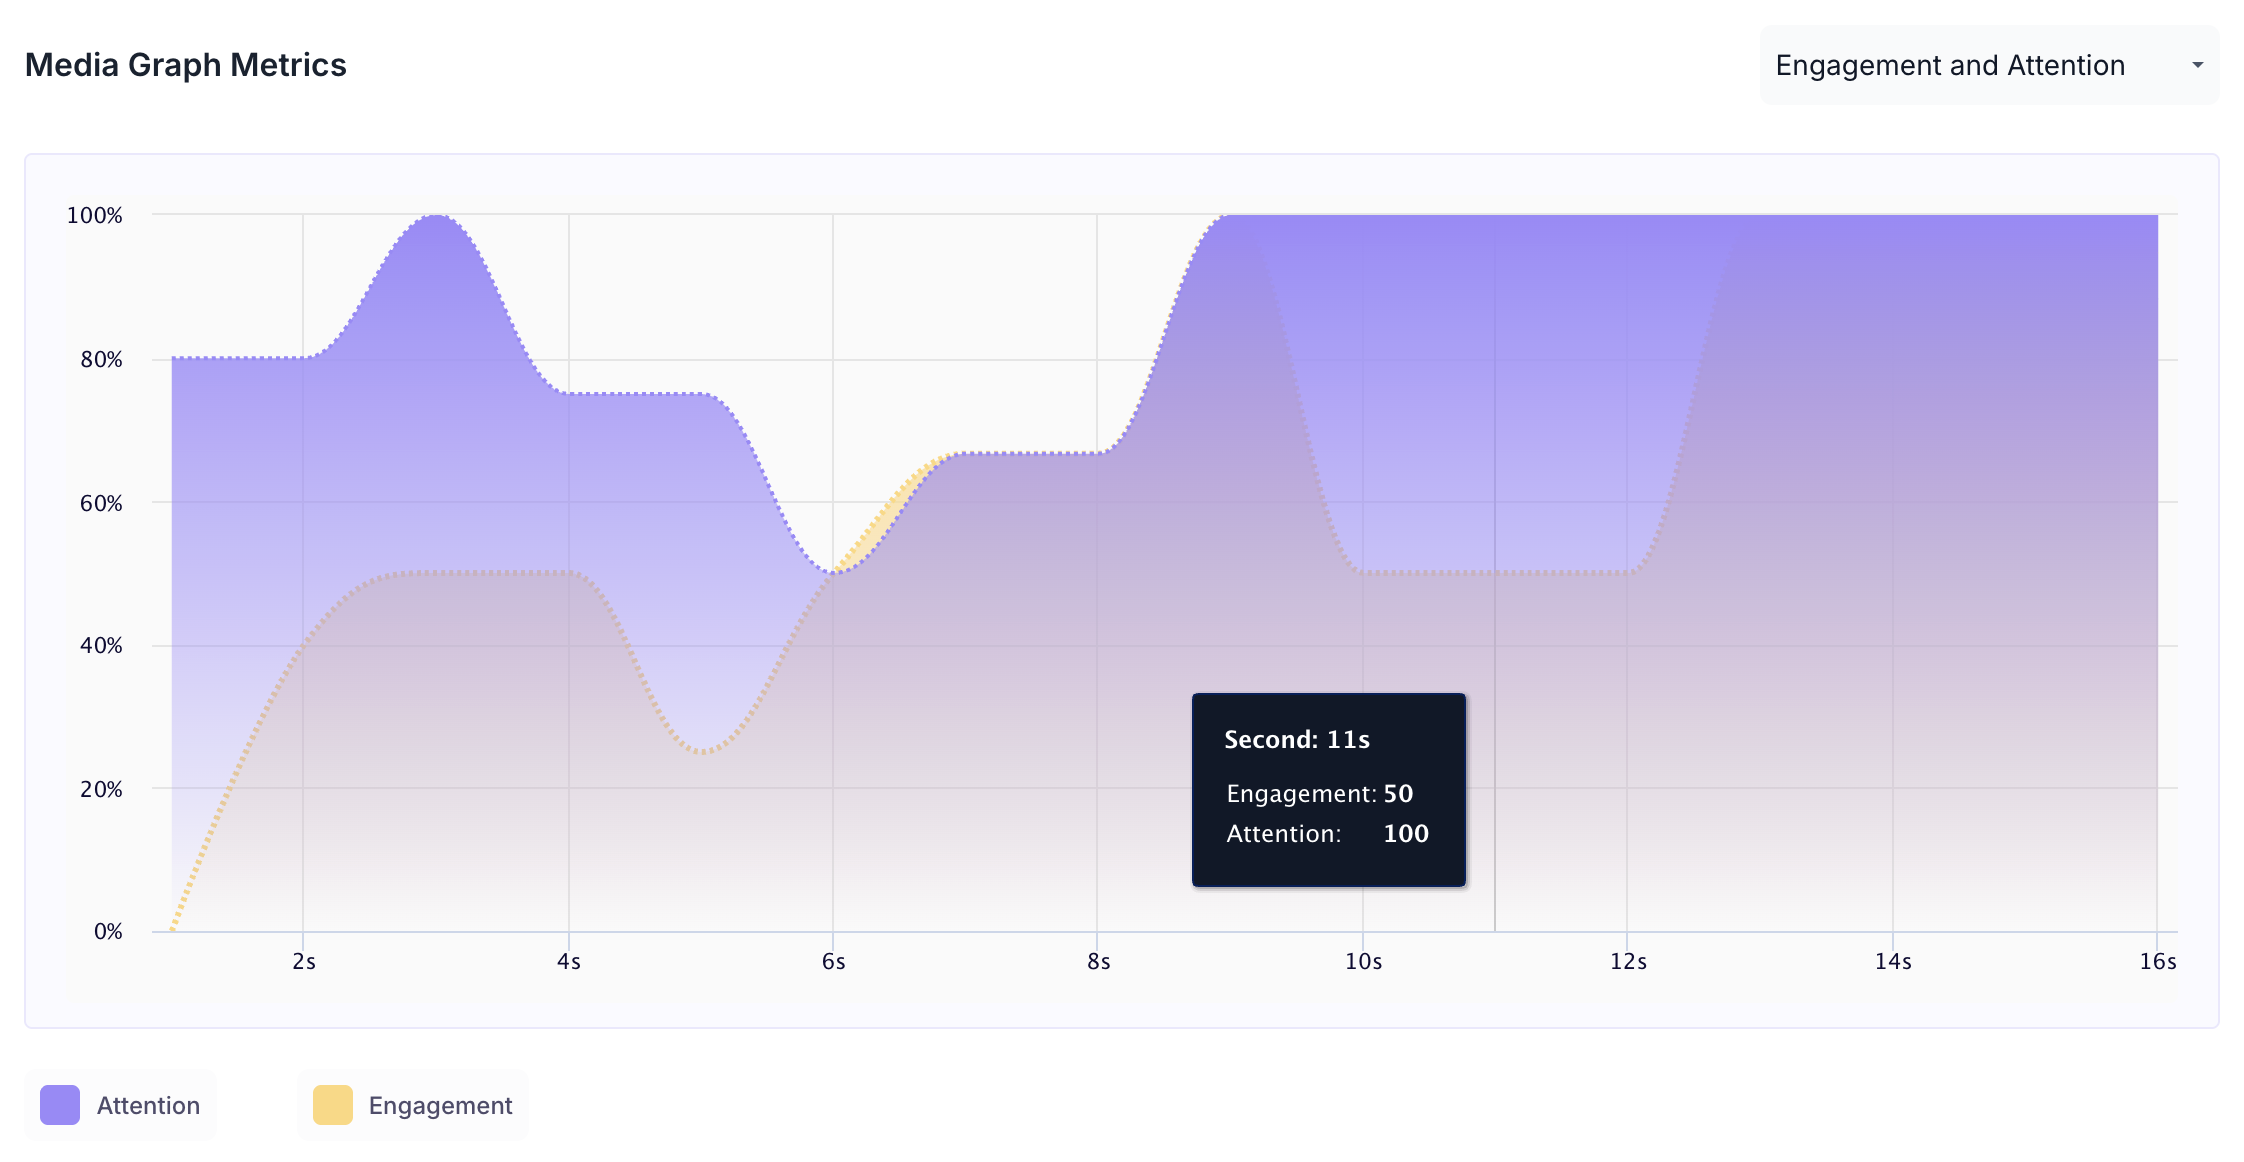
Engagement and Attention
Shows how attention and engagement levels changed across the full duration of the creative.
- Purple area: Attention Score
- Orange area: Engagement Score
- X axis: Time in seconds
- Y axis: Score from 0 to 100
Hover over any point on the graph to see the exact second and the corresponding engagement and attention scores at that moment.
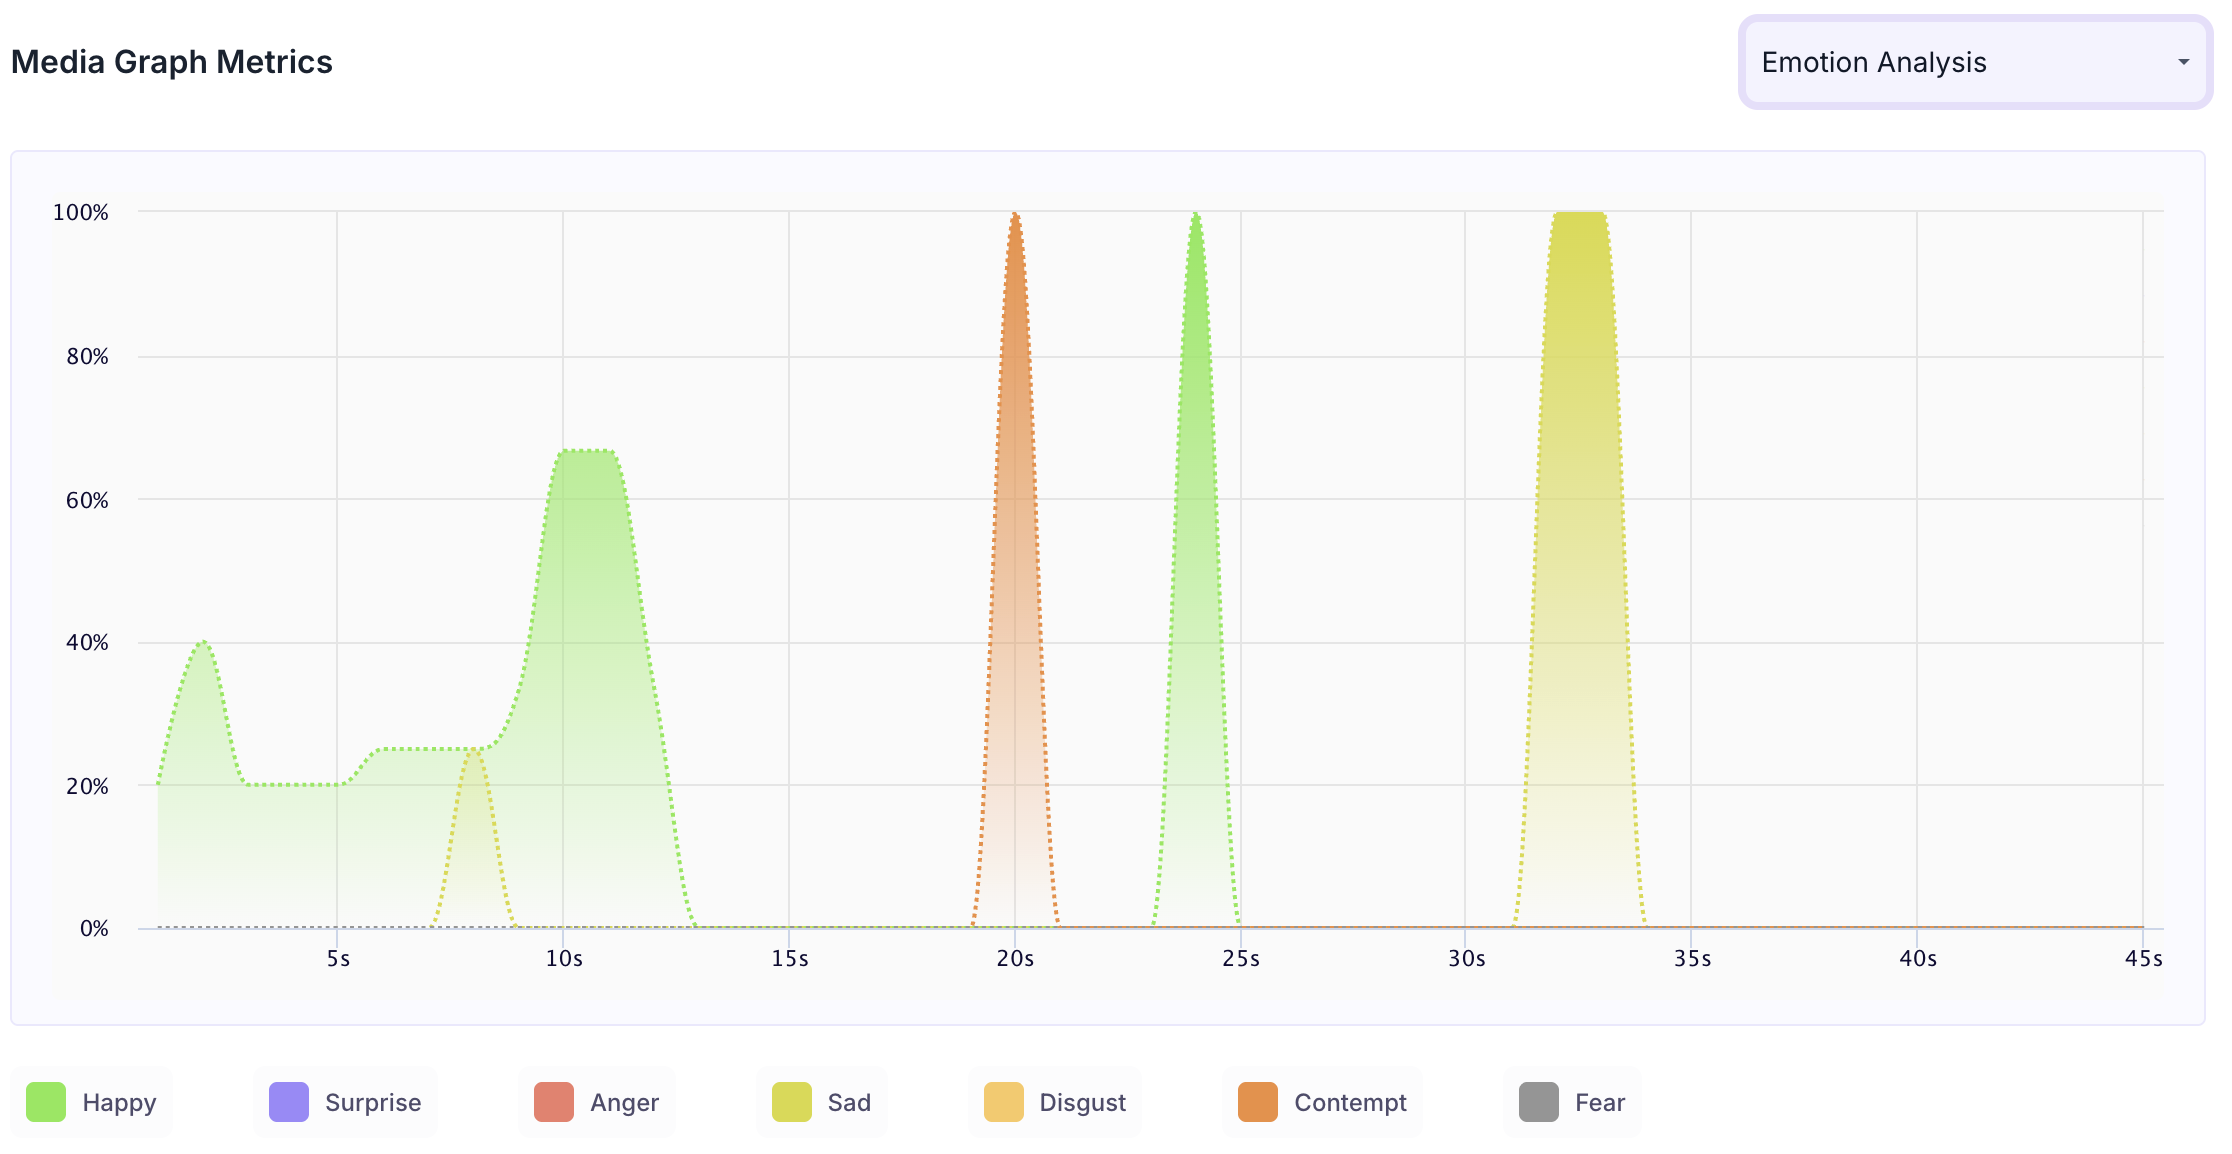
Emotion Analysis
Shows how emotional responses changed across the duration of the creative. Each emotion that was expressed is shown as a separate coloured line. A colour key at the bottom of the graph identifies which colour corresponds to which emotion. Hover over the graph to see the score for each emotion at a specific second.
The emotions tracked are Happy, Surprise, Anger, Sadness, Disgust, Contempt and Fear.