Media Blocks Insights
Overview
Once your study is live and responses are collected, you can view the results in the Results tab. Media Block results are available in two sections: the overall study summary and the media insights dashboard.
1. Overall Results
This section provides an overview of how your study performed across all blocks.
- Total Blocks – Number of question blocks included in the study.
- Total Responses – Count of completed responses across all blocks.
- Screened Out – Respondents who did not qualify based on screener logic.
- Dropped Off – Respondents who exited the study midway.
- Completion Rate – Percentage of respondents who completed the full study.
- Drop-Off Rate – Percentage of respondents who exited before completion.
2. Study-Level Download
You can download all collected response data for the entire study, covering every block and question, for offline or further analysis.
3. Filter Responses
Use the filter panel at the top of the results page to analyze specific respondent segments. You can filter based on:
Answers to previous questions
- Device type (e.g., mobile, desktop)
- Browser used (e.g., Chrome, Safari)
This allows you to uncover trends and insights within particular user groups.

Media Block Results
When your study includes media blocks, you will see detailed data and metrics about how respondents interacted with the media.
Response Summary
- Completed – Number of respondents who answered this block.
- Drop-off – Respondents who exited the study before reaching this block.
- Skipped – Respondents who viewed the block but did not respond.
Media Insights
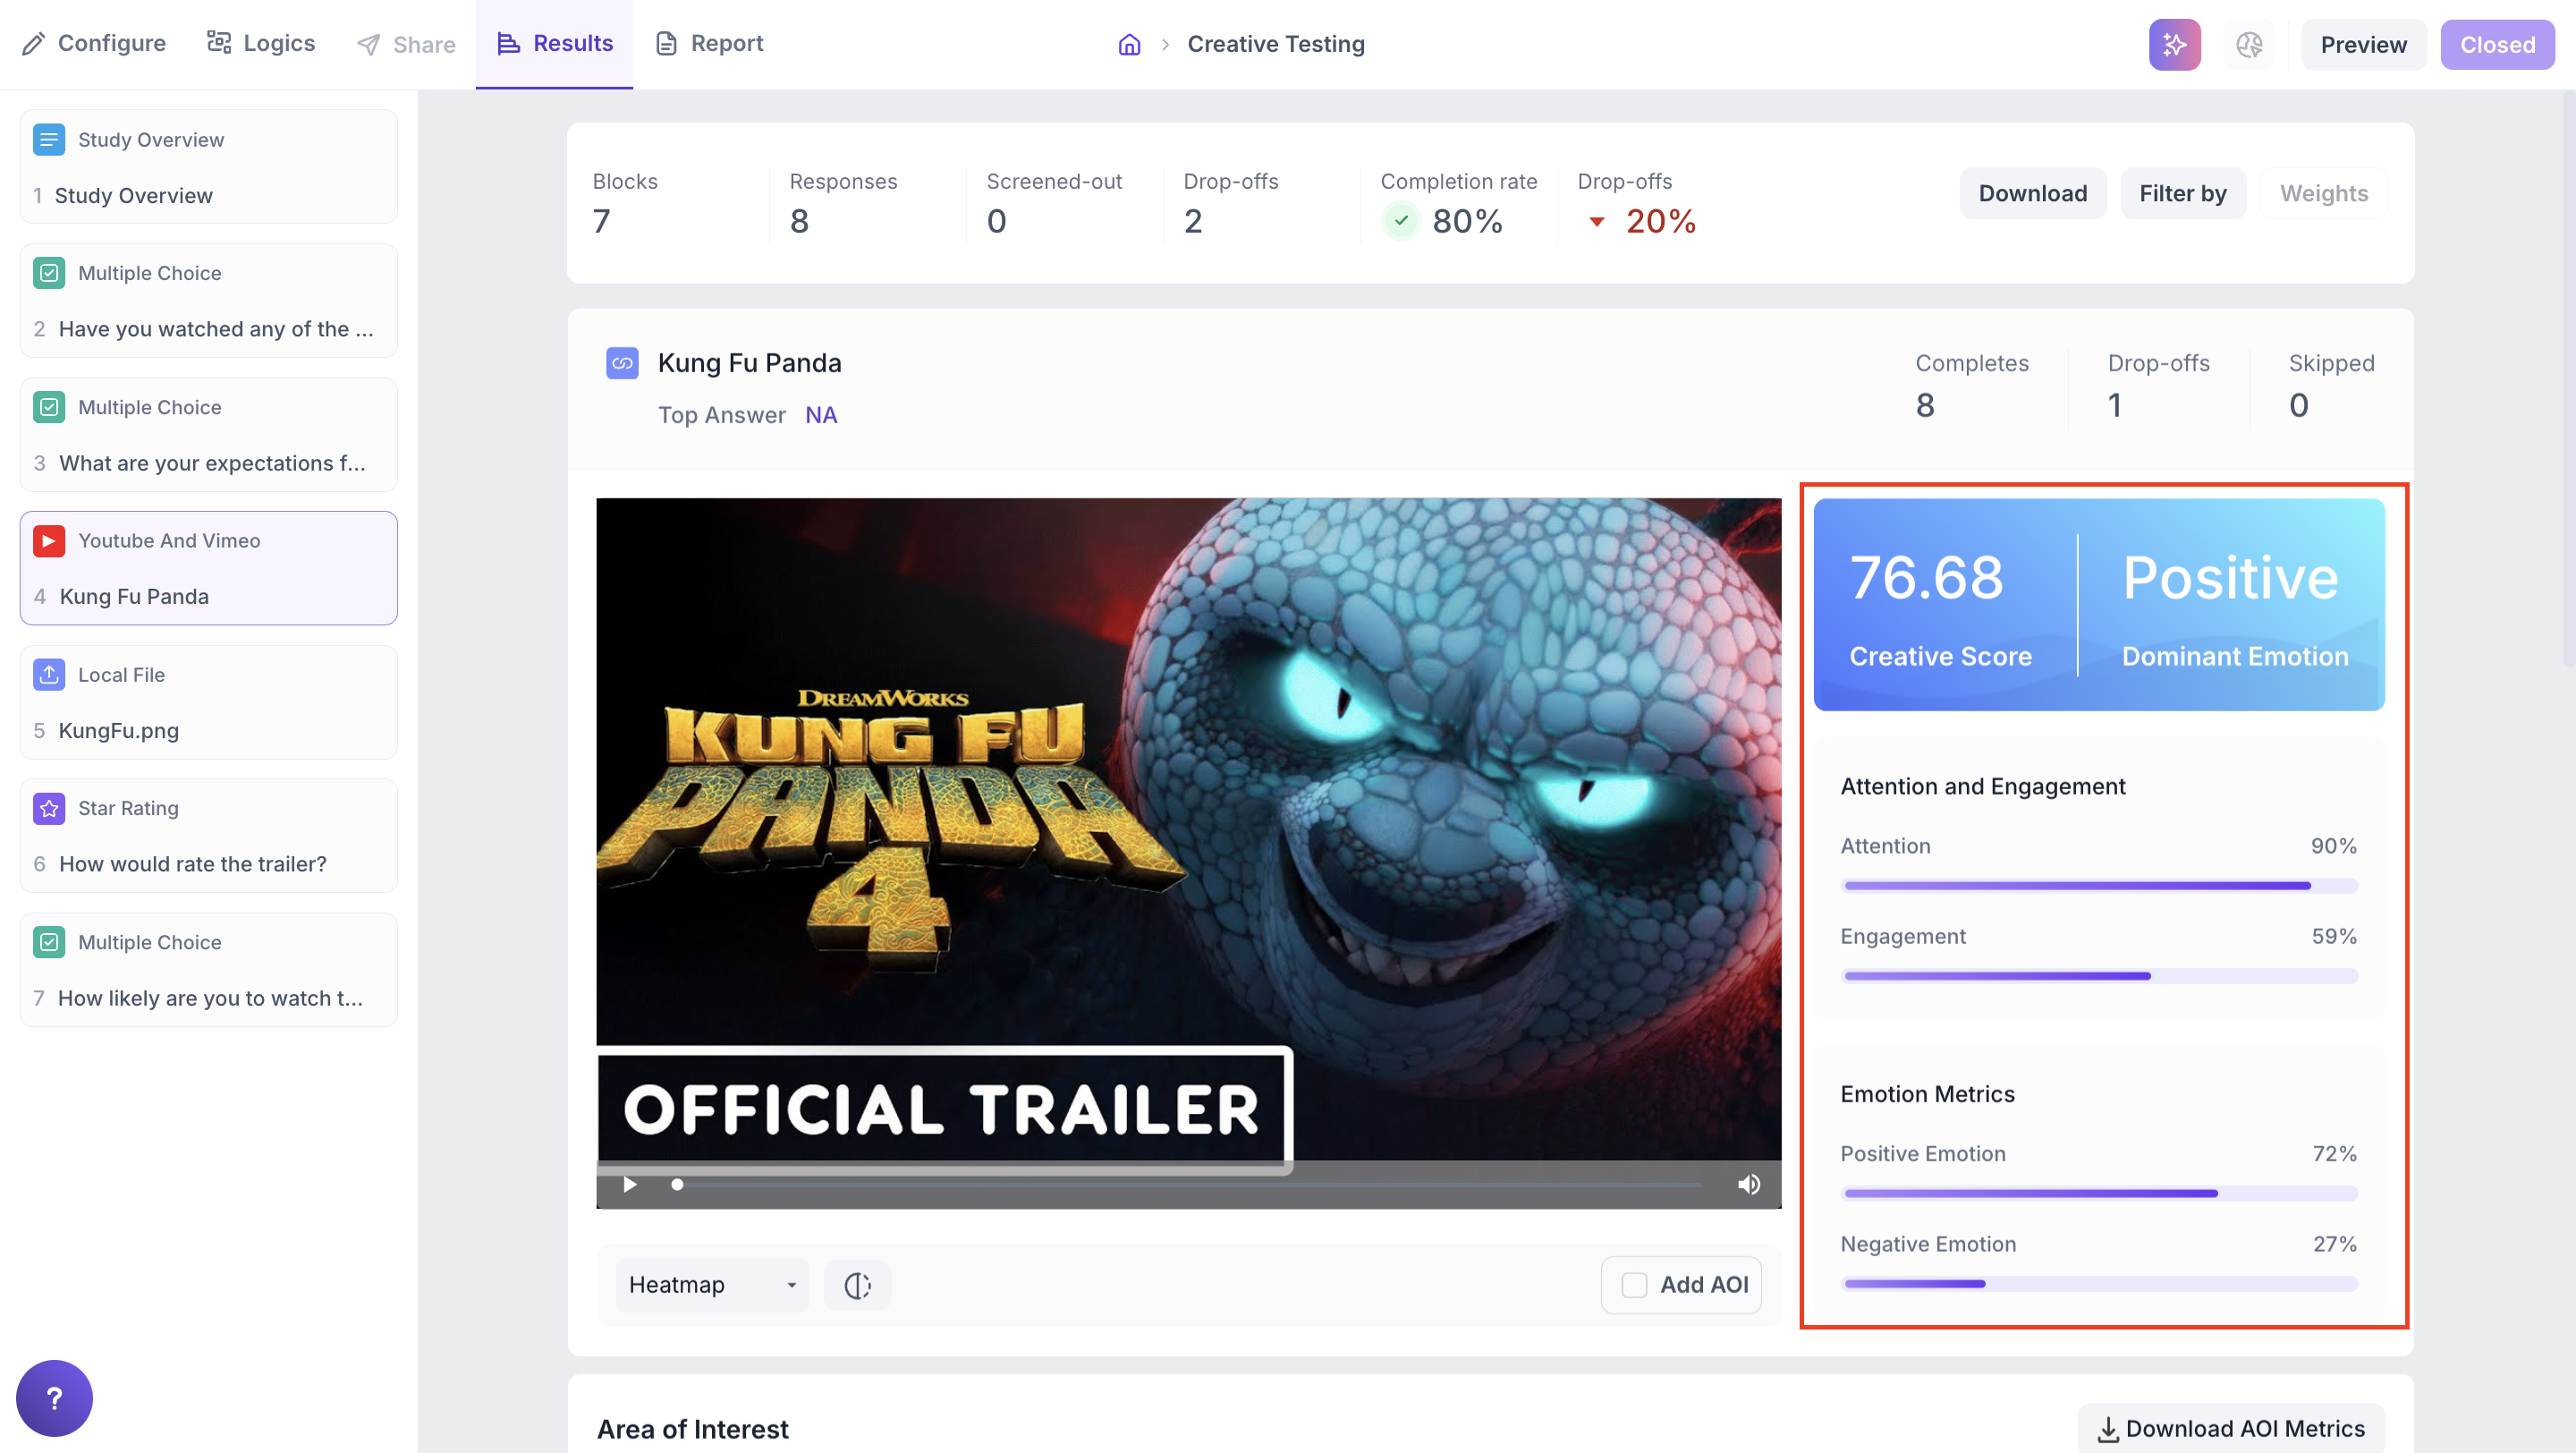
When Facial Coding or Eye Tracking is enabled for a media block, the Media Insights Dashboard is available in the Results tab. It shows metrics including Creative Score, Dominant Emotion, Attention and Engagement, Emotion Responses, Heatmap and Areas of Interest.
Dashboard Overview
Each uploaded media file includes a rich set of metrics:
- Creative Score
- Dominant Emotion
- Attention and Engagement
- Emotion Metrics
These insights help you assess how your media performs both individually and in comparison with similar content.
1. Creative Score - Media Performance Benchmark
Each media file is evaluated against category specific benchmark scores. The Creative Score shows how the media performed relative to other content in the same category such as TV ads, product demos or UI walkthroughs.
2. Dominant Emotion
The dominant emotion reflects the emotion most frequently expressed by respondents positive or negative while interacting with the media content.
3. Attention and Engagement
Attention
Calculated using eye gaze and head pose, this metric indicates whether participants were looking at the screen during playback.
Engagement
Measures the emotional intensity triggered by the media each second, based on facial expressions. High engagement indicates strong emotional response to the content.
4. Emotion Responses
This section captures whether participants had an overall positive or negative emotional experience during media playback.
- Positive Emotions = Happiness + Surprise
- Negative Emotions = Anger + Disgust + Contempt
Fear and Sadness are excluded from negative scores as they require contextual interpretation.
The emotion score is an average of user emotions across the duration of the media.
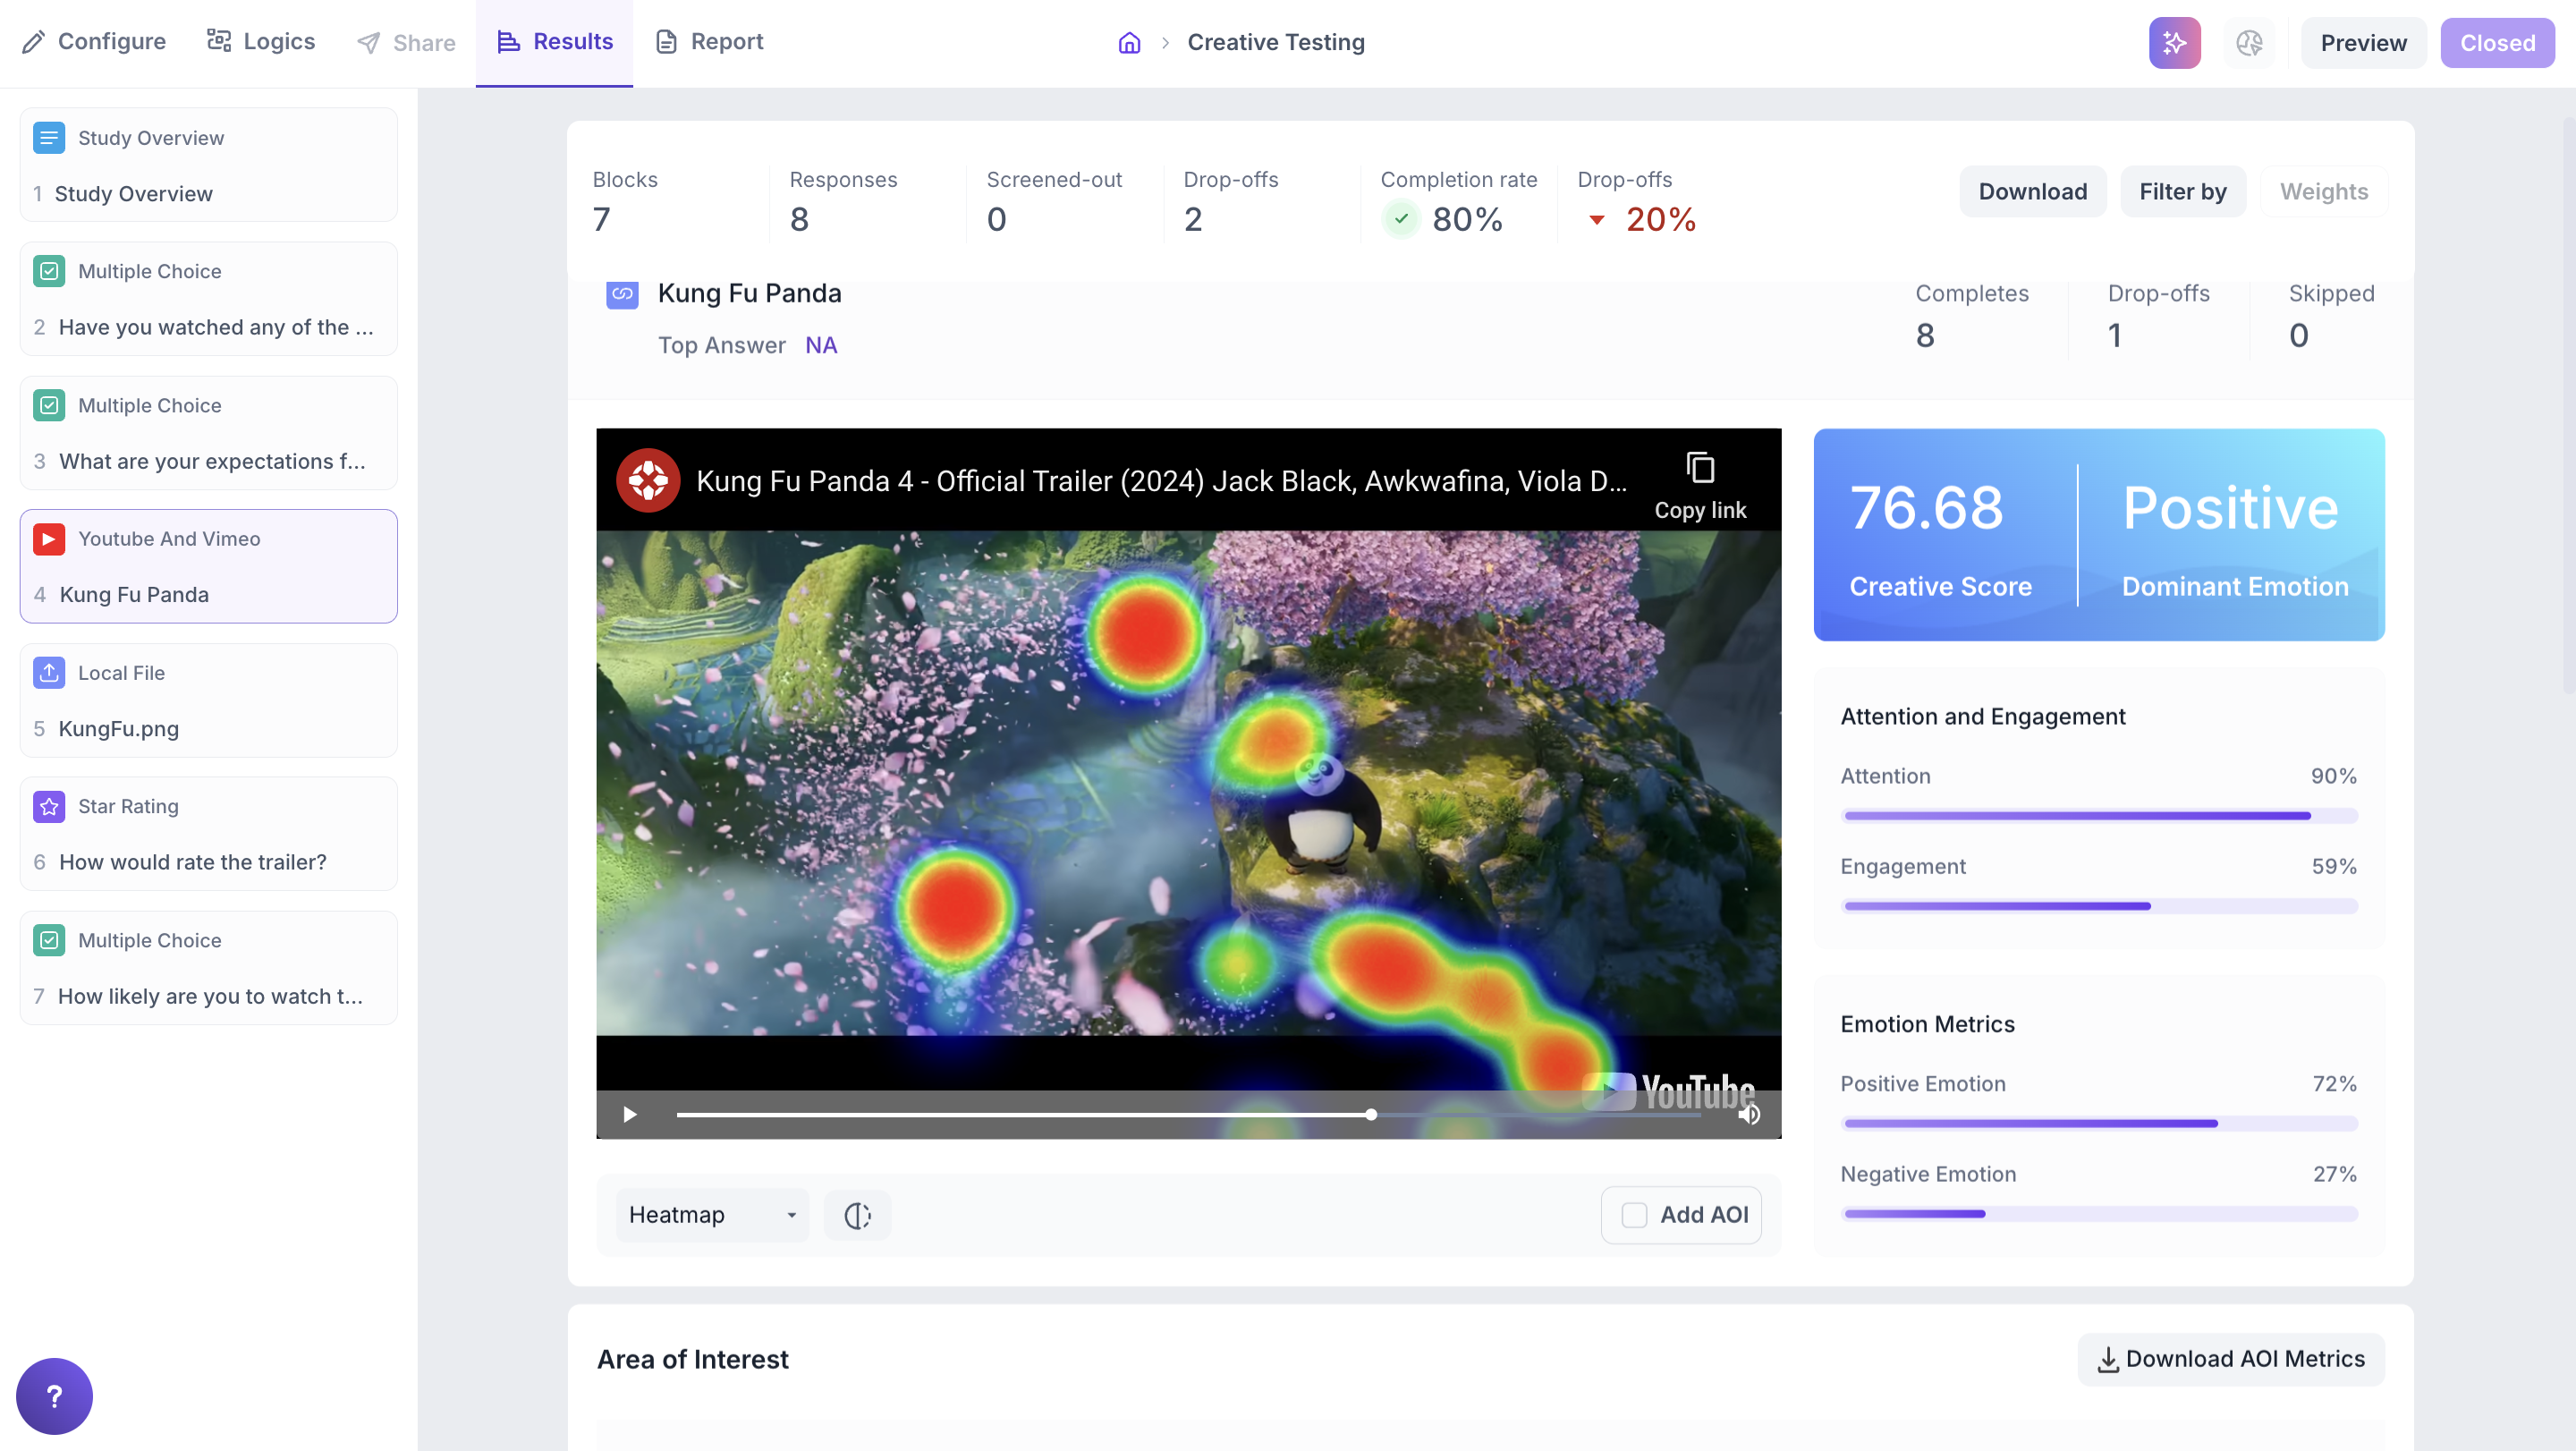
5. Heatmap and Transparency Map
Heatmap
Displays aggregated gaze intensity using a colour gradient from cool to warm. Warmer colours highlight the areas of the screen that received the most visual attention.
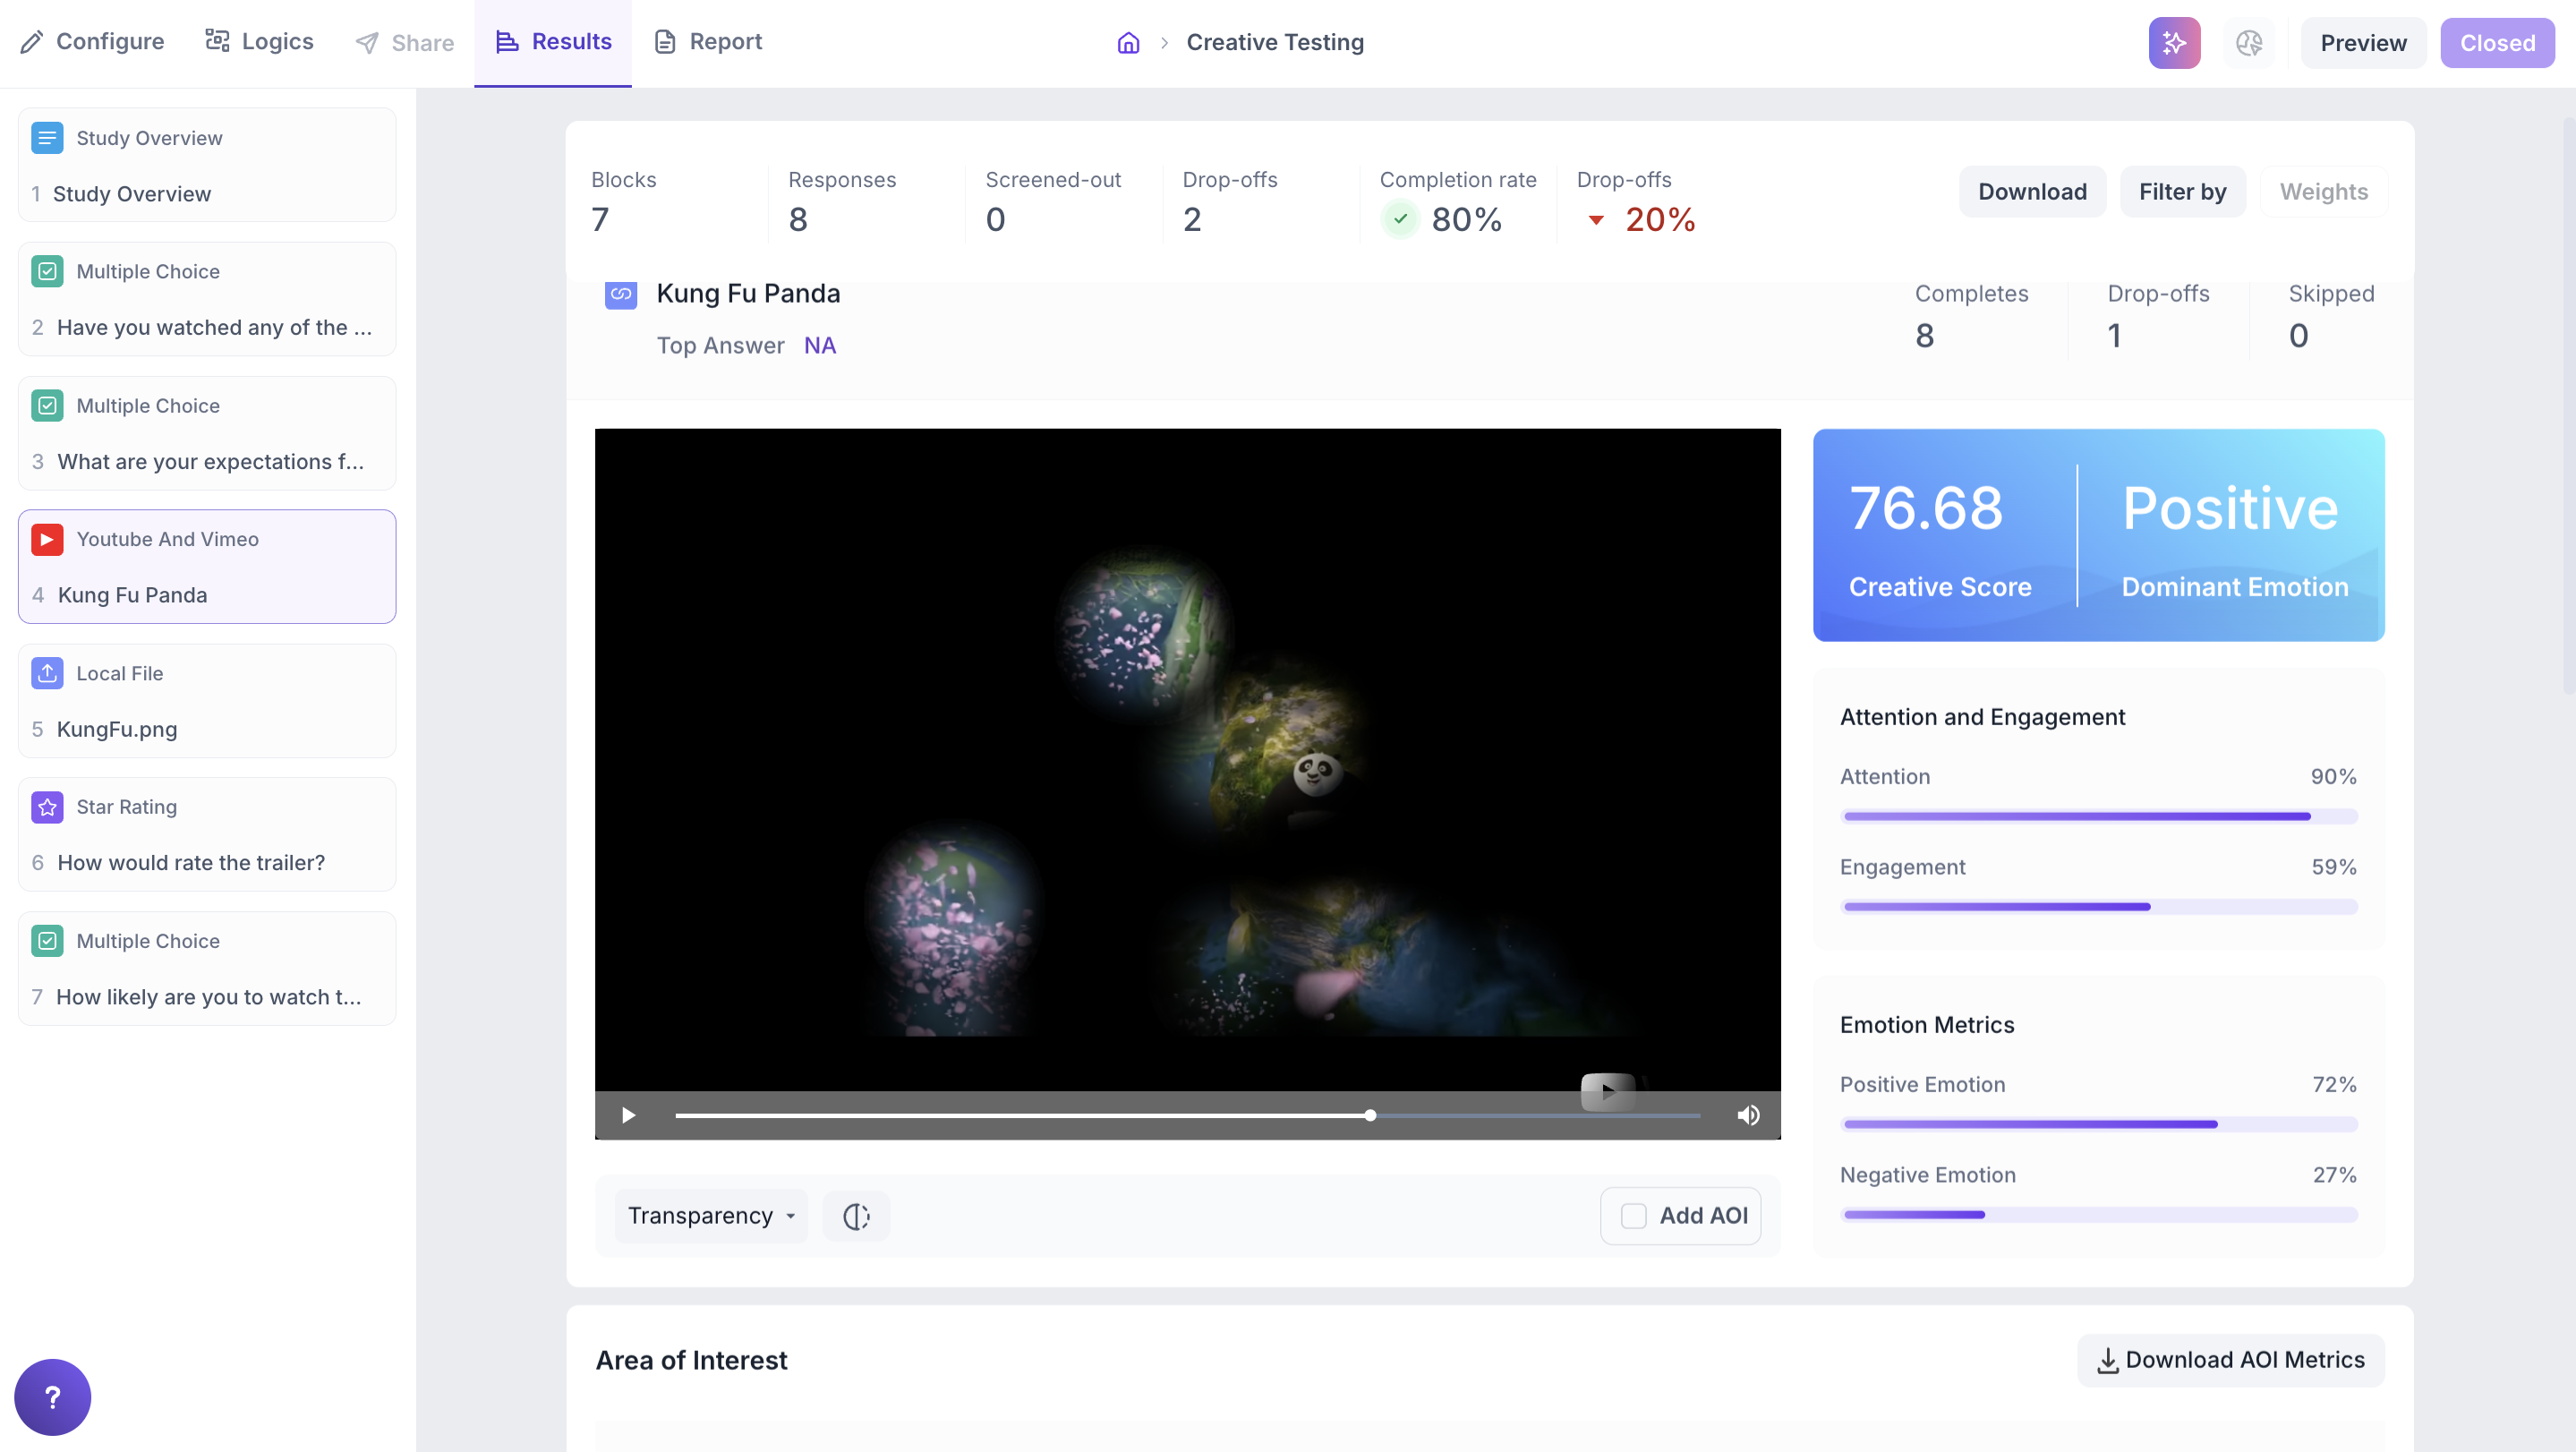
Transparency Map
Uses gaze points to make areas of the media more transparent where participants looked most often. This provides a clear view of visual attention without the colour overlay of a heatmap.
Areas of Interest (AOIs)
AOIs allow you to track participant interaction with specific elements of your media such as a brand logo, a call to action or a product feature.
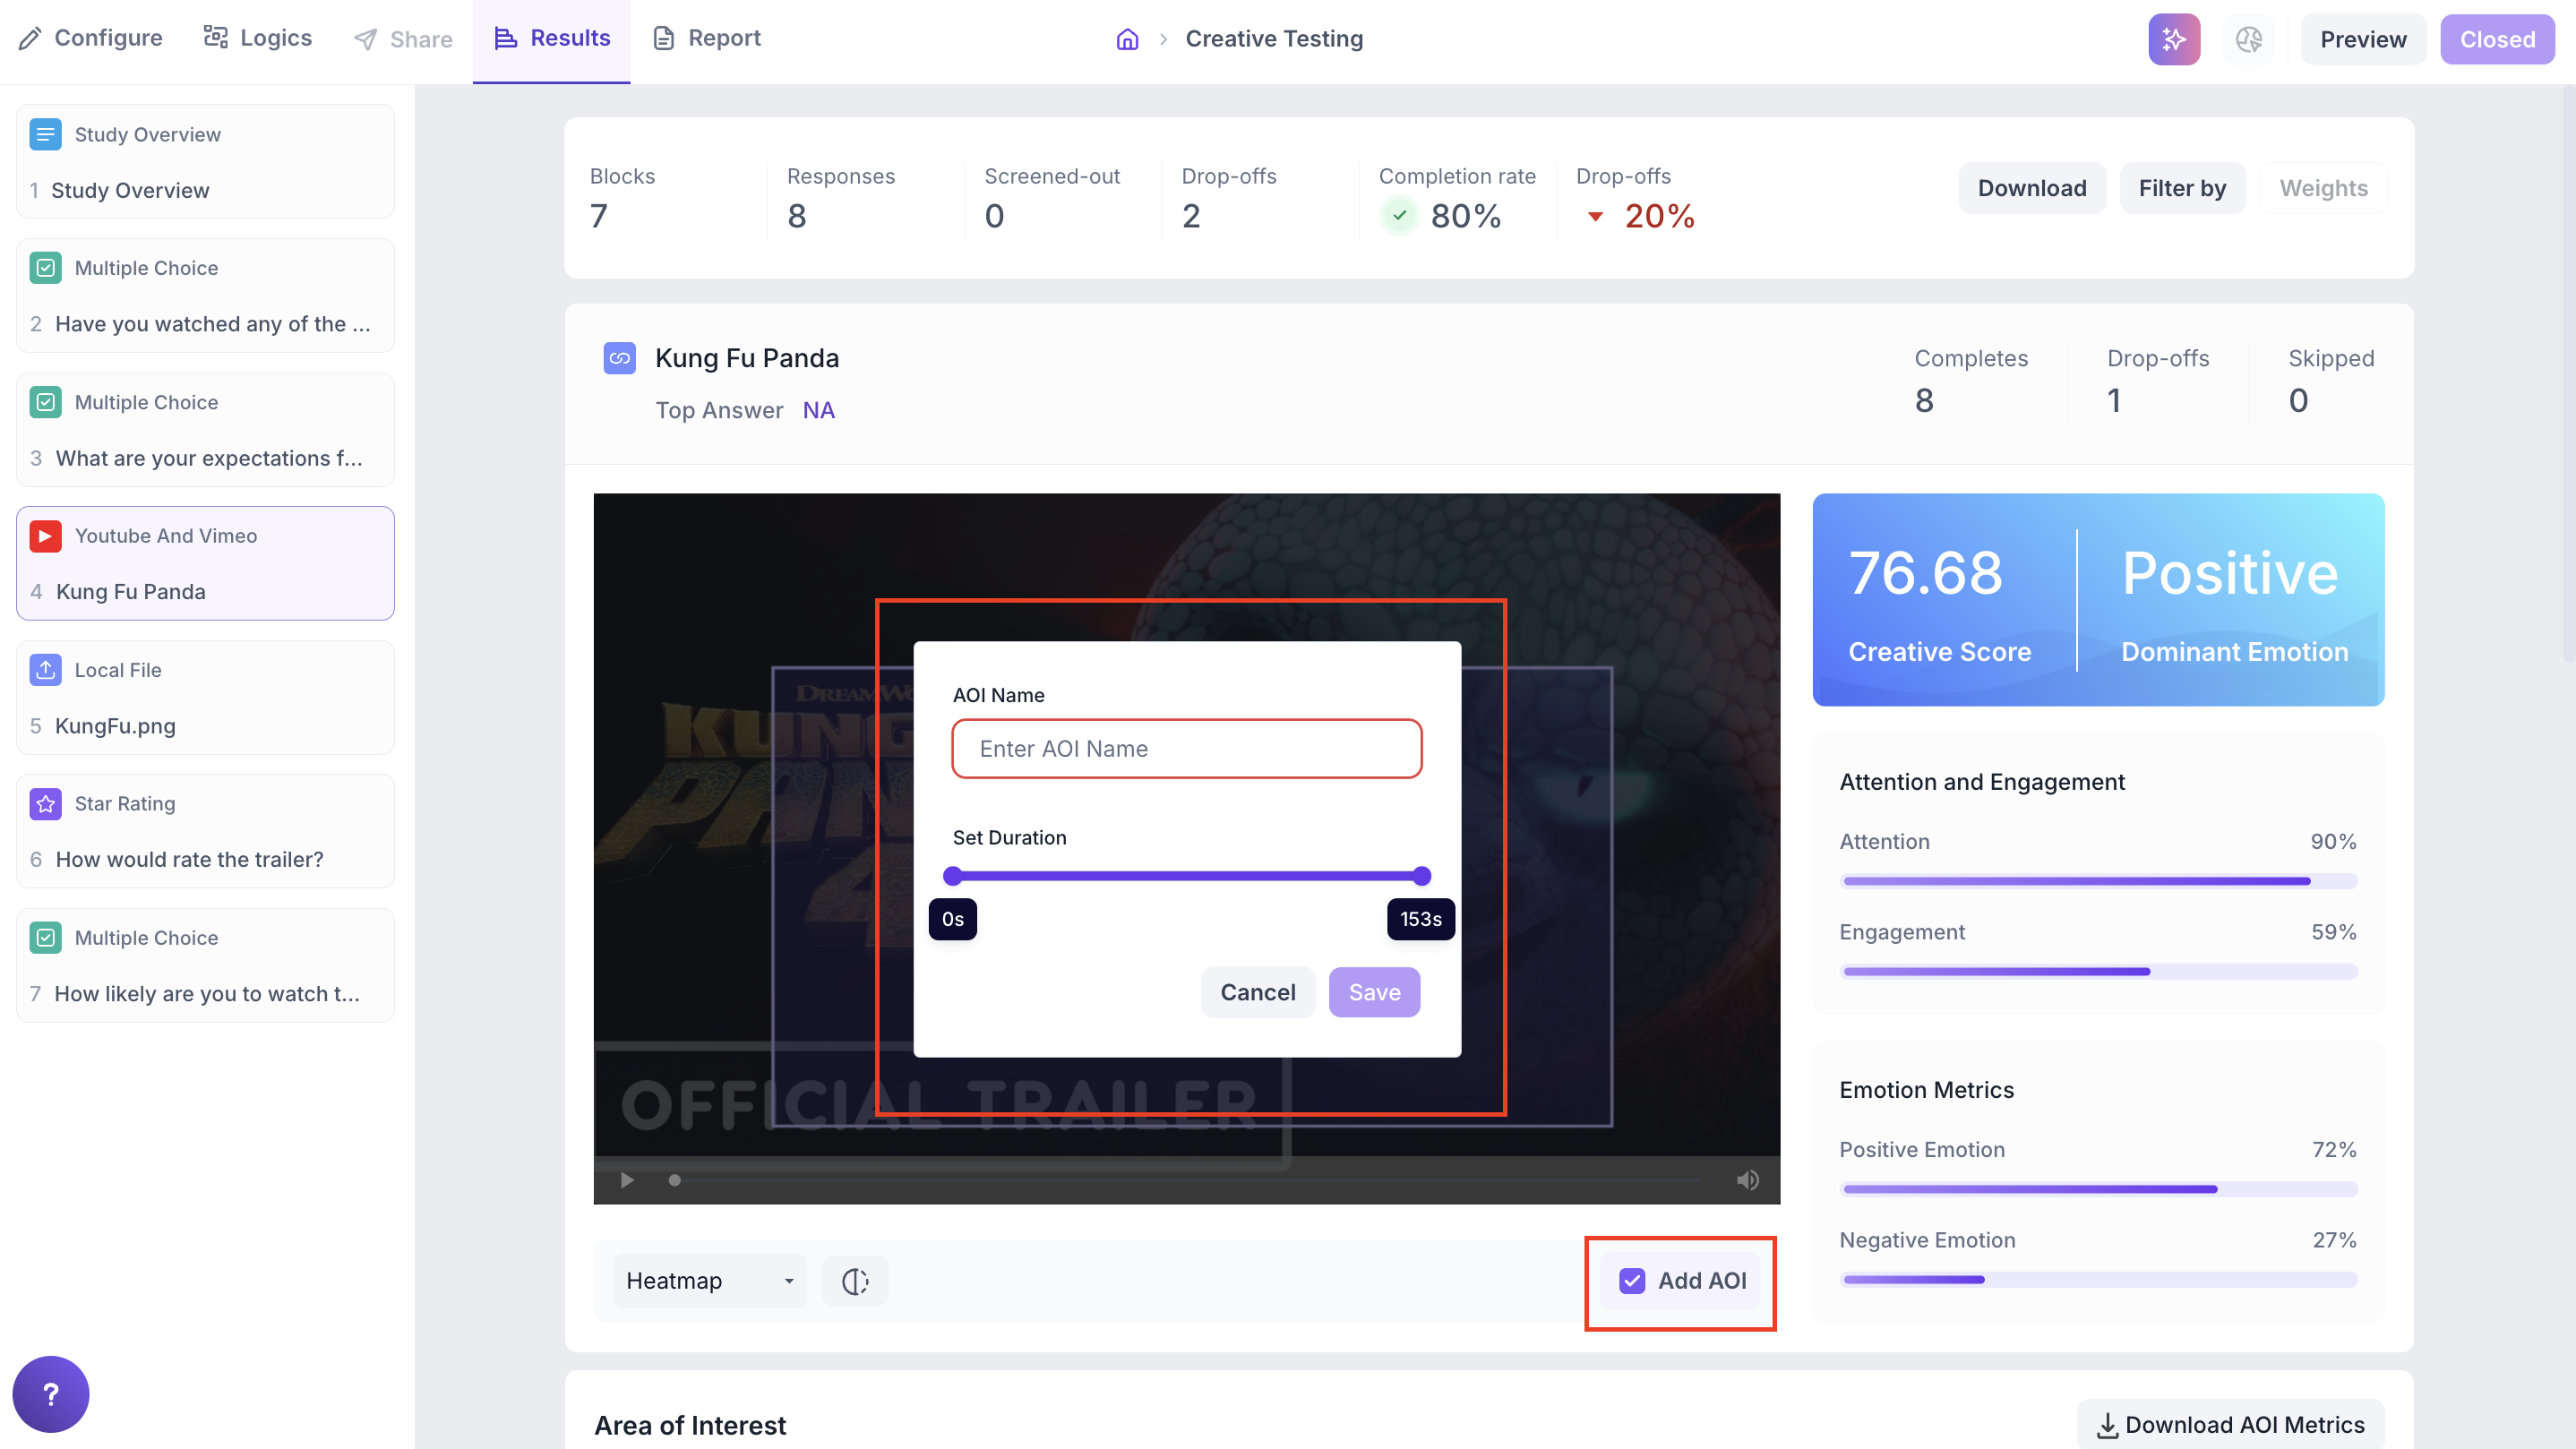
1. Create an AOI:
- Click the Add AOI button located below the media.
- Draw a custom box over the desired section of the image or video.
- Provide a name for the AOI and set the time duration it should cover.
- Click Save to finalize the Area of Interest.
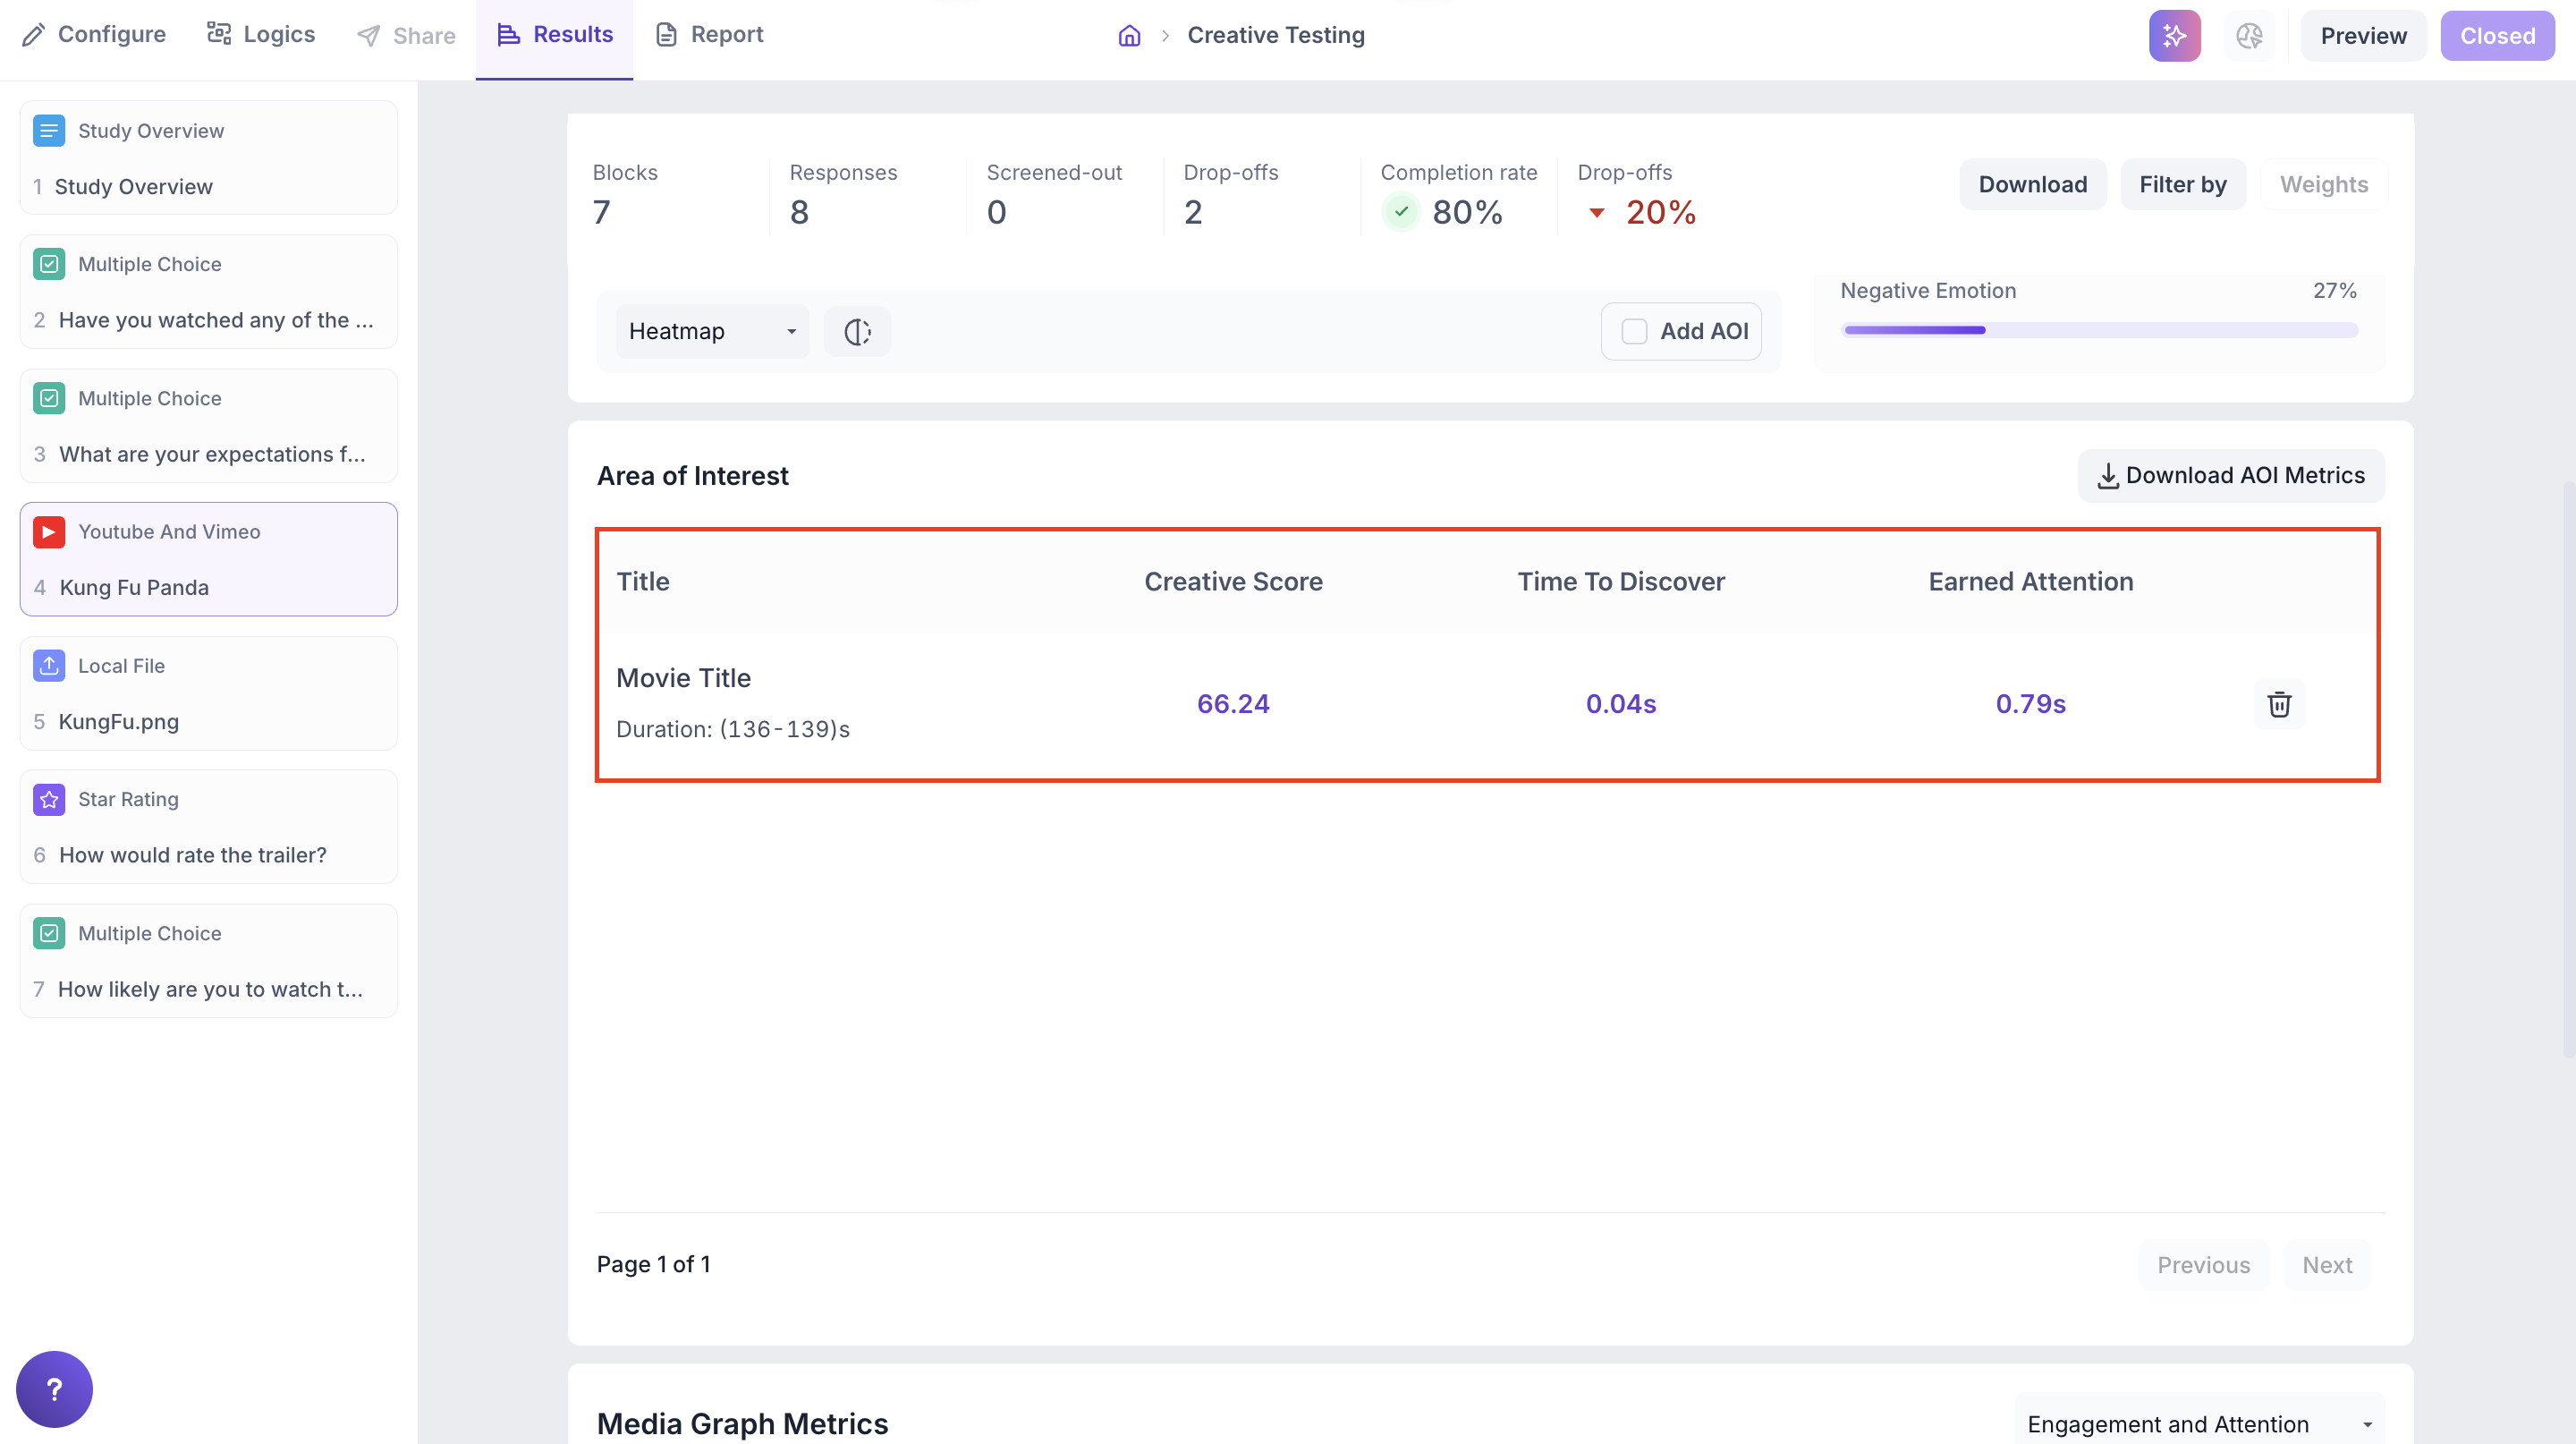
2. Results for AOI
Once saved, the AOI will appear in the Area of Interest section below the media. For each AOI, the following details will be displayed:
- AOI Name & Duration – The name you assigned and the time range selected.
- Creative Score – Overall performance score based on participant engagement within that area
- Time to Discover – Average time taken by respondents to notice the area.
- Earned Attention – Indicates how much attention this selected area received during the chosen time.
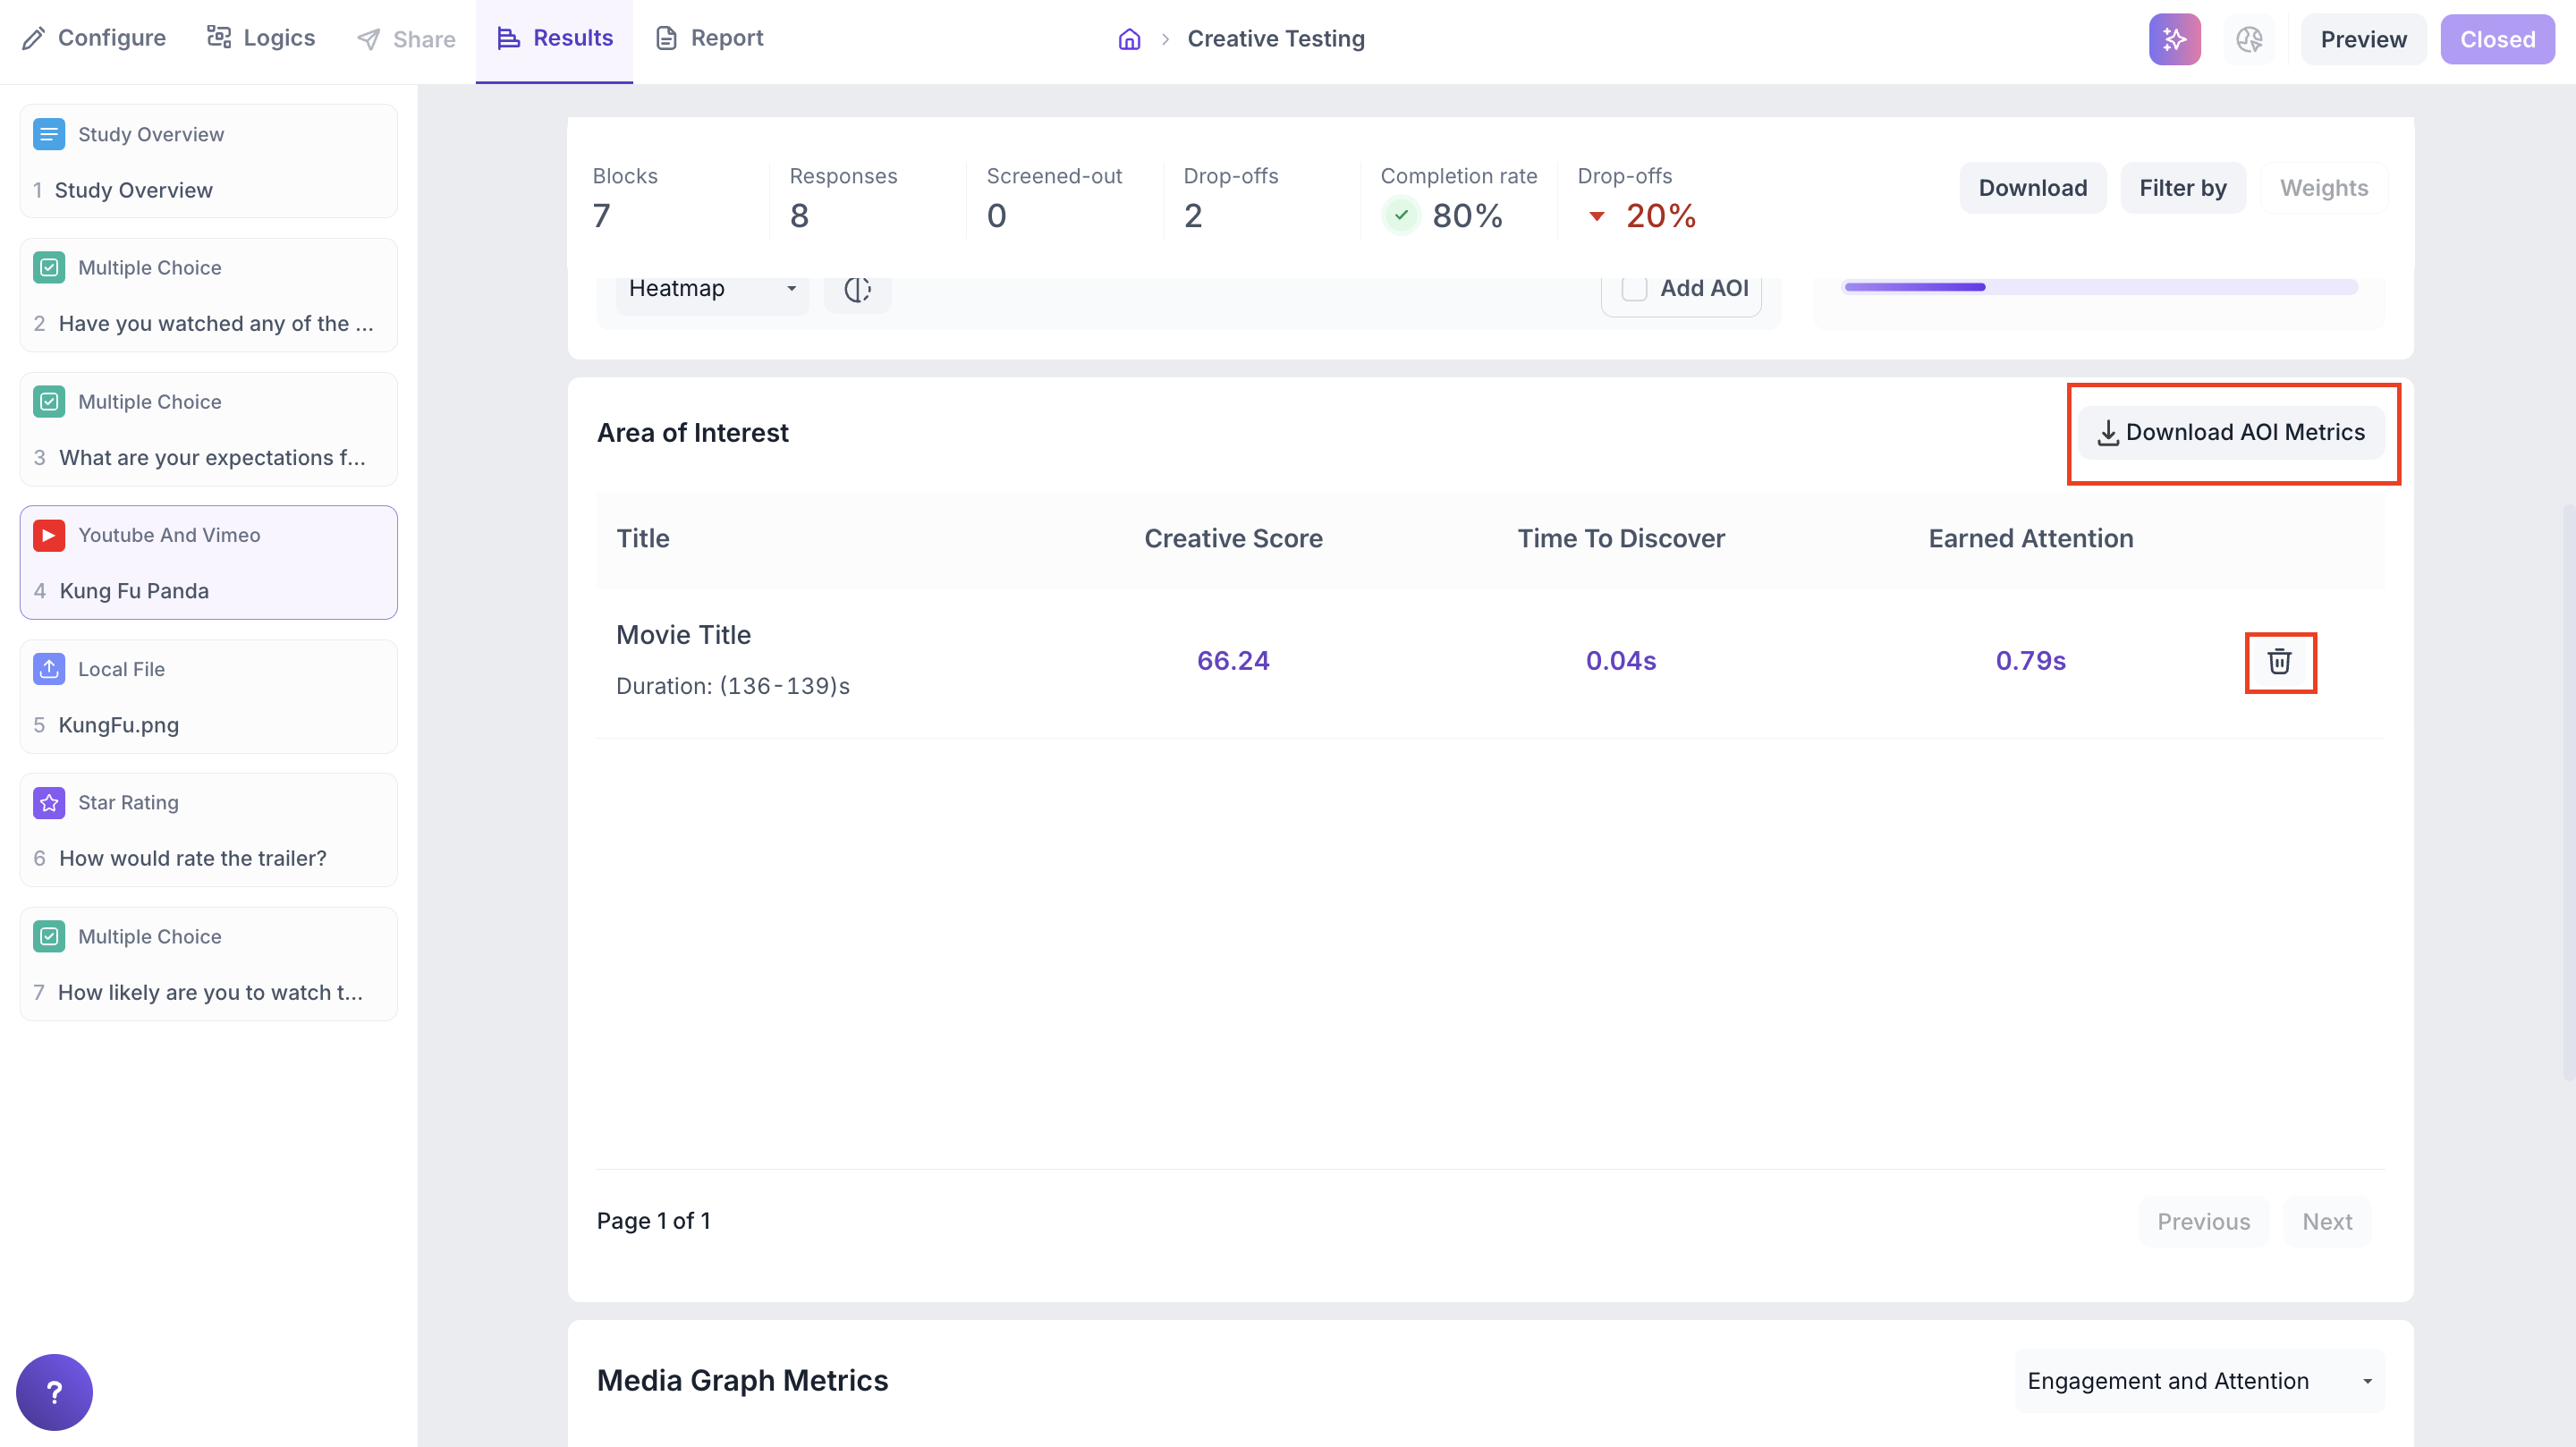
3. Other Actions
You can also manage AOIs with the following actions:
- Delete an AOI directly from the list if no longer needed.
- Download AOI data as a CSV file for further analysis.
Use AOIs to analyze:
- Brand/logo visibility
- CTA effectiveness
- Product or UI feature engagement
Media Graph Metrics
This section shows second by second performance of the media through two interactive visualisations: the Engagement and Attention Graph and the Emotion Timeline.
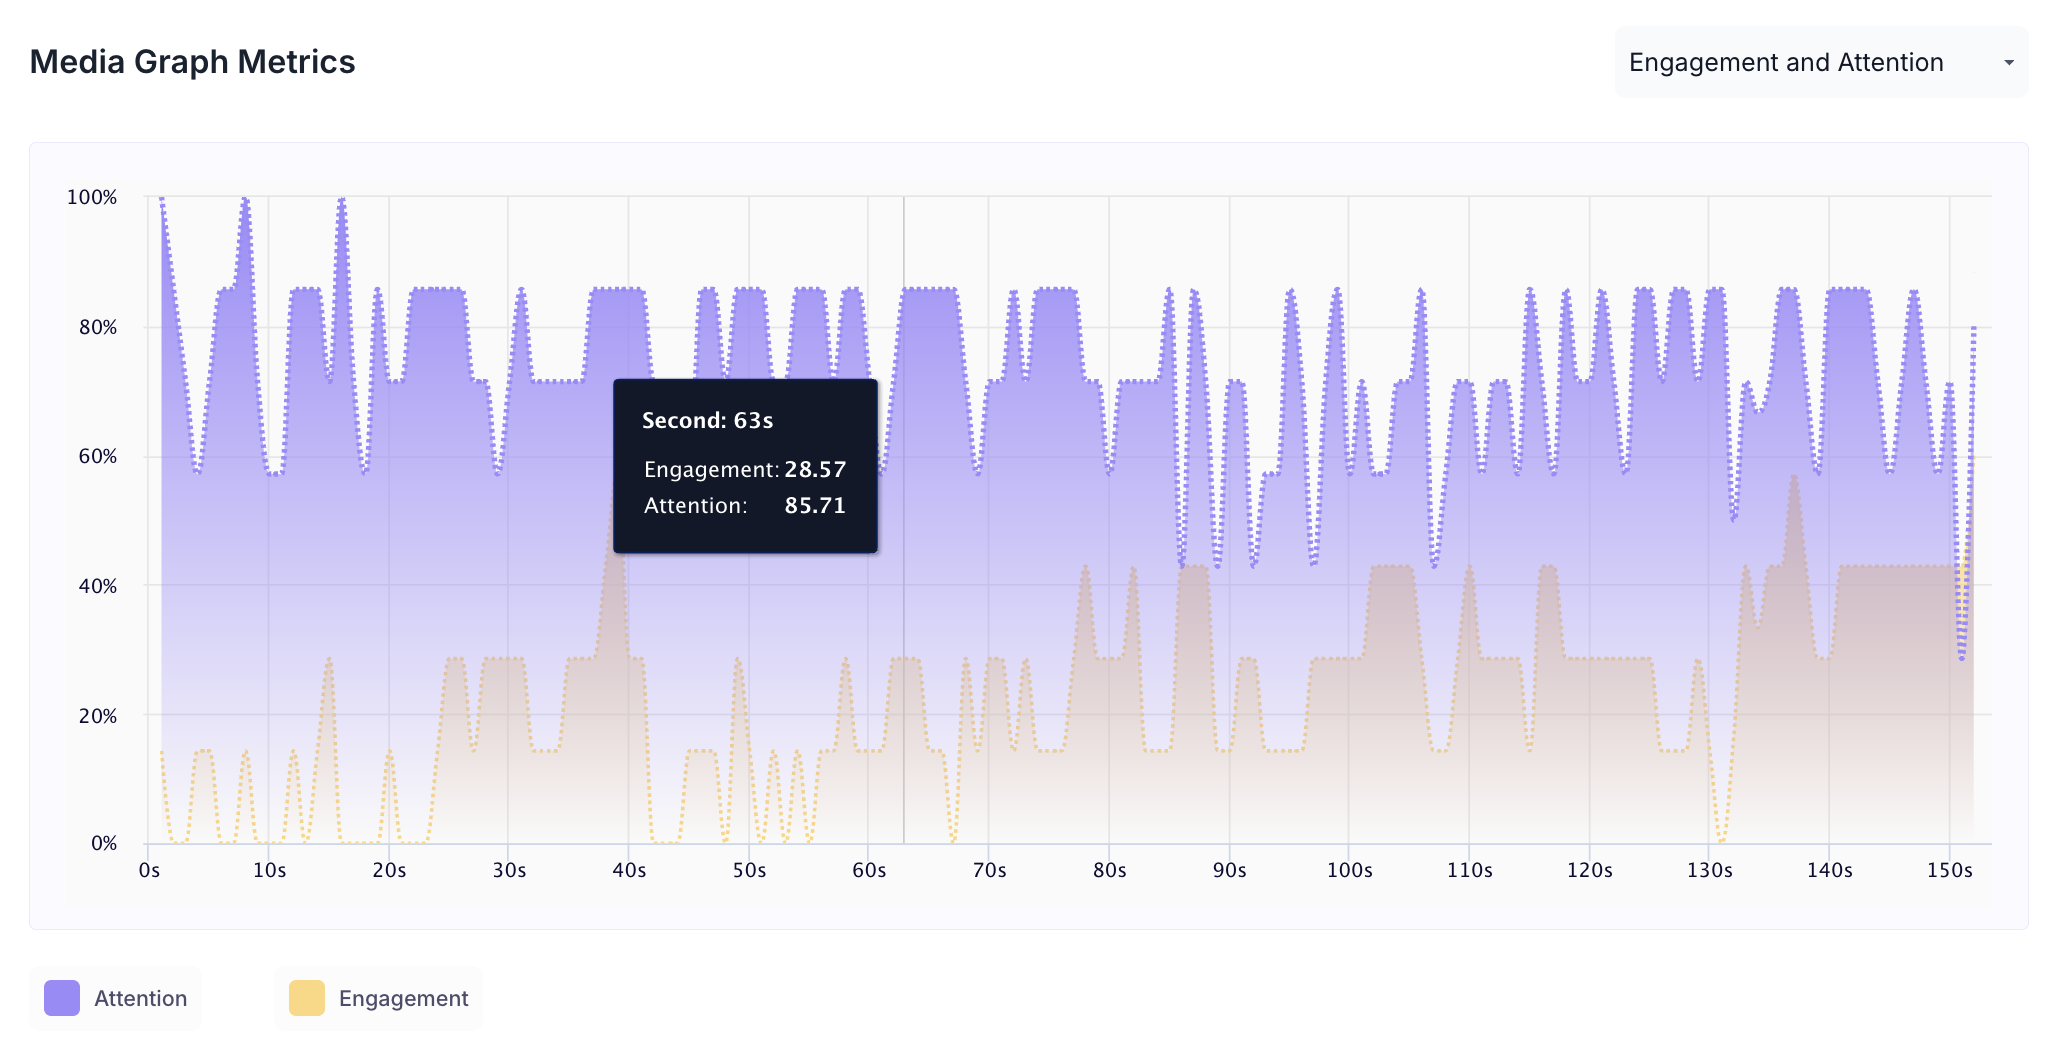
1. Engagement and Attention Graph
This graph shows attention and engagement scores across the media.
- Purple Line = Attention Score
- Orange Line = Engagement Score
- X-axis = Time (seconds)
- Y-axis = Score (0–100)
Hover over the graph to see exact values for each second of the creative. Use this to identify moments where attention dropped or engagement increased.
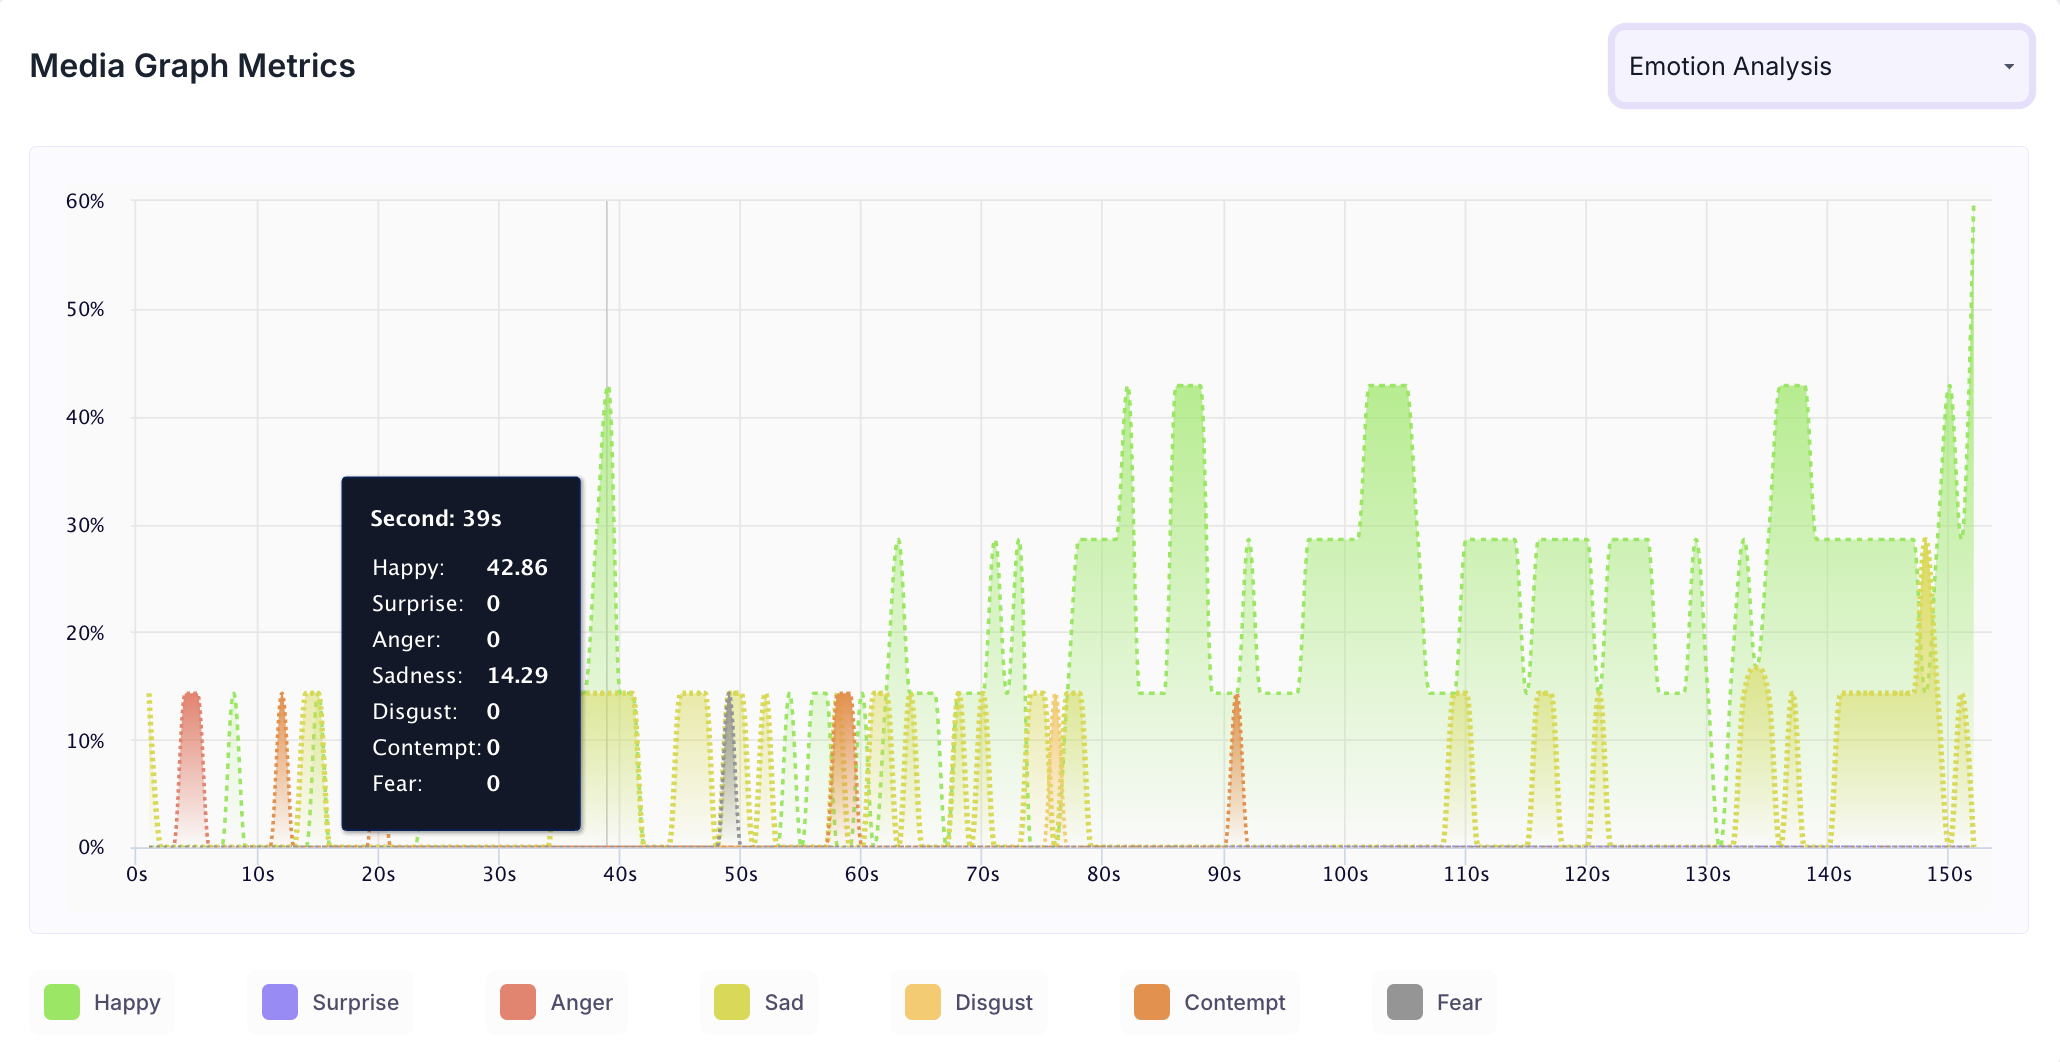
3. Emotion Timeline
This graph shows real time emotional responses across the media. Each line colour corresponds to a different emotion. A colour key is displayed alongside the graph.
- Use the timeline to identify when emotions peaked or shifted
- Useful for analysing narrative flow, ad impact or moments of user frustration