5 Second Test in Decode
Overview
The 5 Second Test block in Decode lets you test how well a design communicates its key message at a glance. Upload an image of the design, configure the duration and tracking technologies, and add follow up questions to capture what participants noticed, recalled and felt.
How to Set Up a 5 Second Test
Step 1: Add the Block
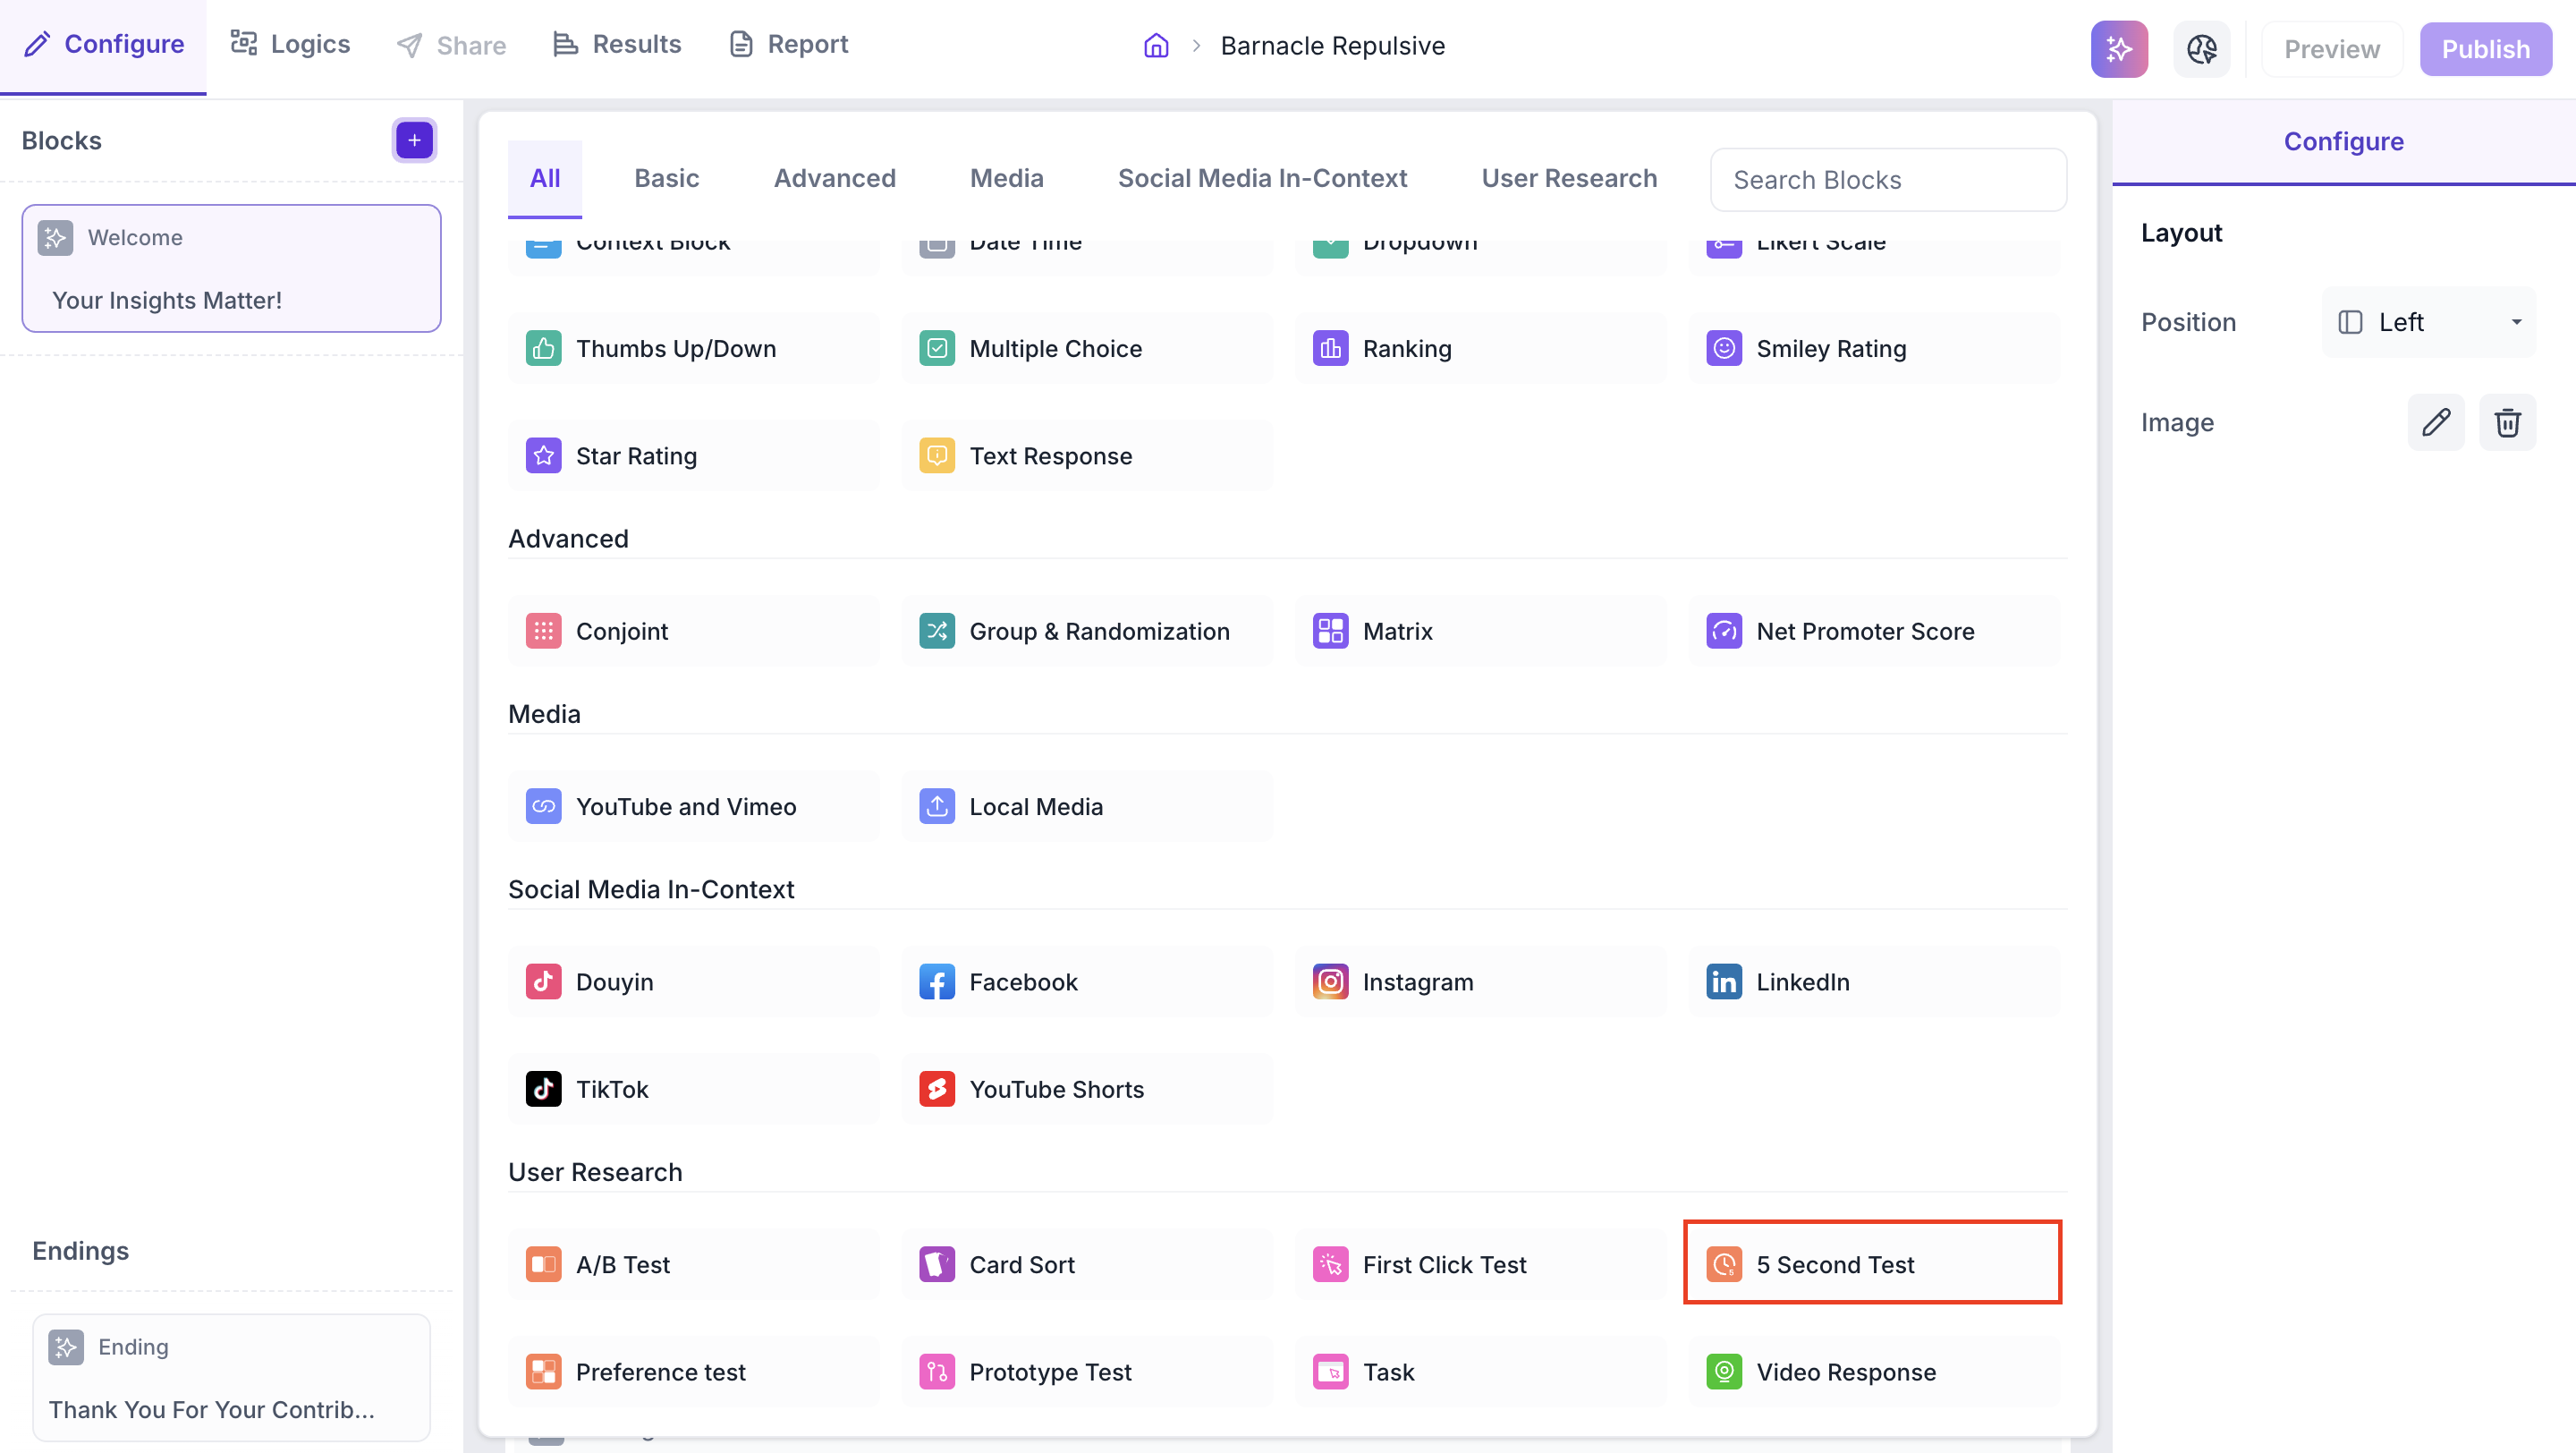
Click the + icon in the left panel to open the block selection panel. Under the User Research section, select Five Second Test.
Step 2: Upload Your Image
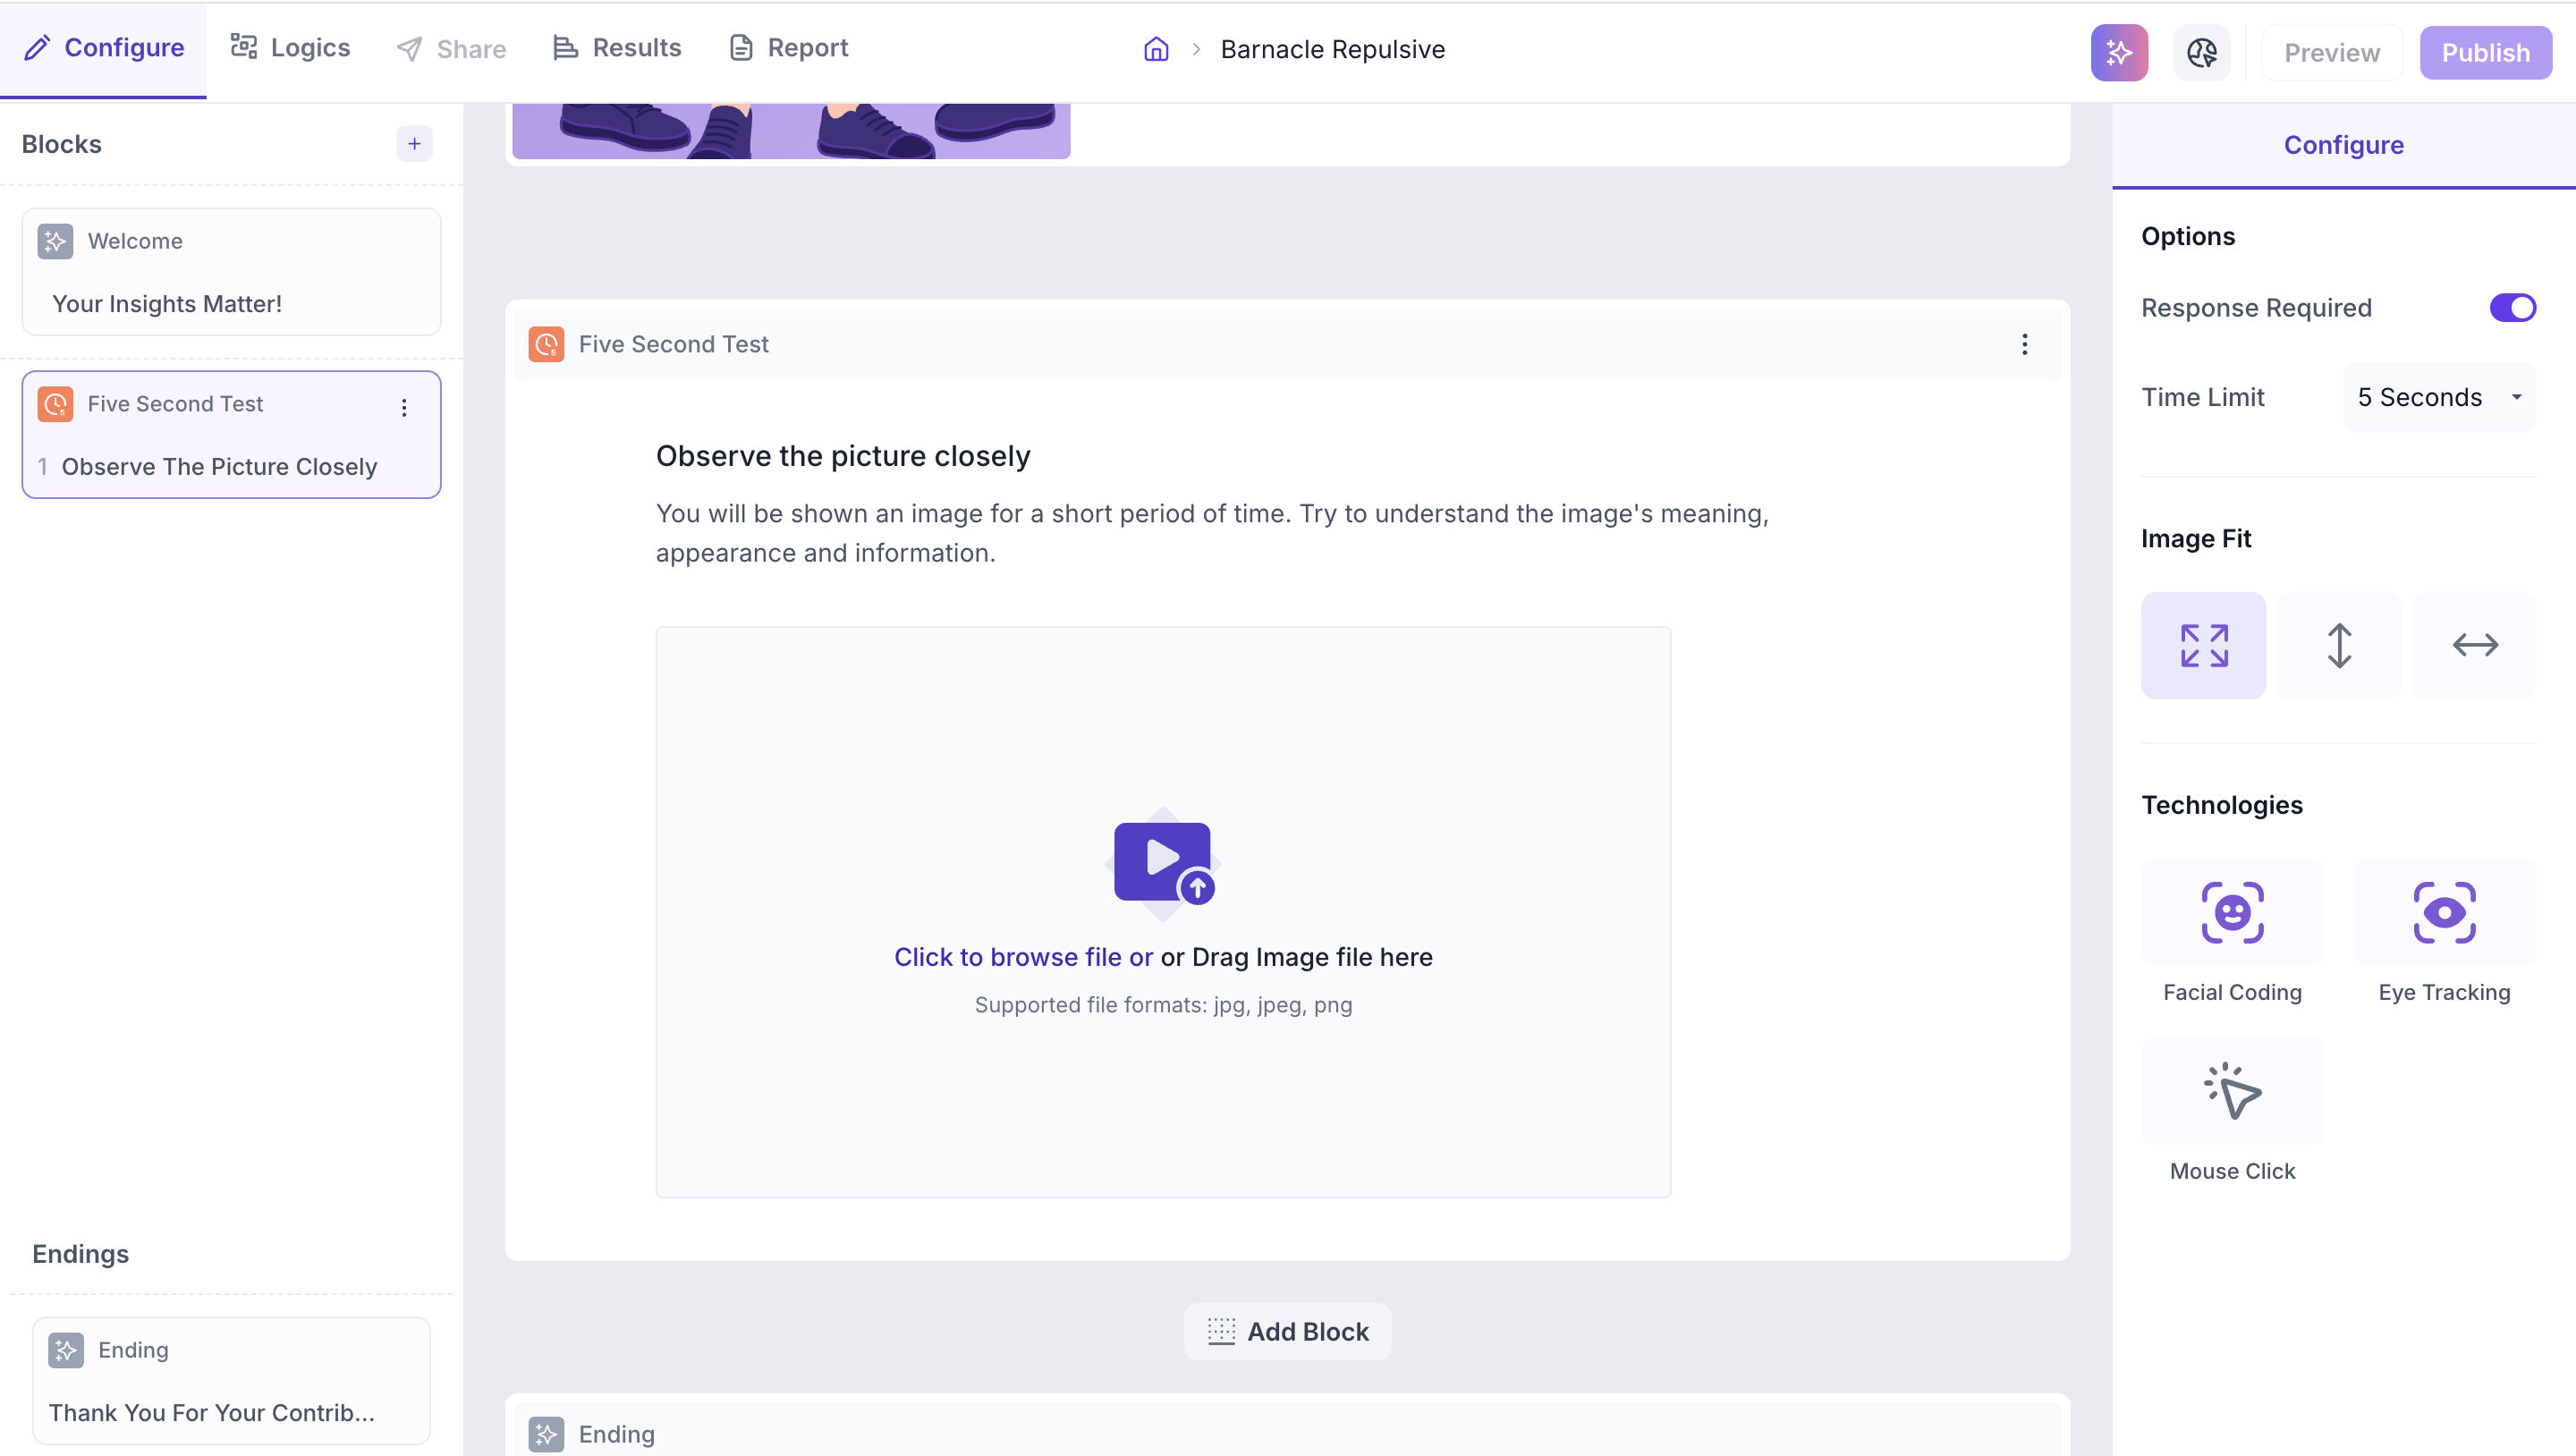
Click the upload area or drag and drop your image file into the block. This should be a screenshot or image of the design you want to test.
File upload limits
Supported formats: JPG, JPEG, PNG.
Step 3: Configure Properties
Use the Configure panel to set the following properties.
Options
- Response Required: Enabled by default. Participants must complete the test before proceeding to the next block
- Time Limit: Set how long the image is shown to participants. The default is 5 seconds and can be increased up to 20 seconds
Image Fit
Select how the image is displayed to participants.
- Fit to Screen: The image is scaled to fit within the screen boundaries. Participants can view the entire image without scrolling
- Fit to Height: The image height is adjusted to fit the screen. If the image width exceeds the screen width, participants can scroll horizontally
- Fit to Width: The image is scaled to cover the full screen width. If the image height exceeds the screen, participants can scroll vertically
Technologies
Select the tracking technologies to enable for this block.
- Facial Coding: Tracks facial expressions to identify emotional responses such as happiness, surprise and anger while participants view the image. Requires the participant's camera to be enabled
- Eye Tracking: Monitors eye movement and gaze to understand which areas of the image received the most visual attention during the timed viewing period
- Mouse Click: Records where participants click on the image during the viewing period
RESULTS
Once the study is live and responses are collected, you can view the results in the Results tab.
Block Level Summary
The following metrics are displayed for the 5 Second Test block.
- Completes: Number of participants who completed this block
- Drop offs: Participants who exited the study before reaching this block
- Skipped: Participants who viewed the block but did not respond
Visual Results
The image is displayed with a visual overlay. Use the view selector to switch between four views.
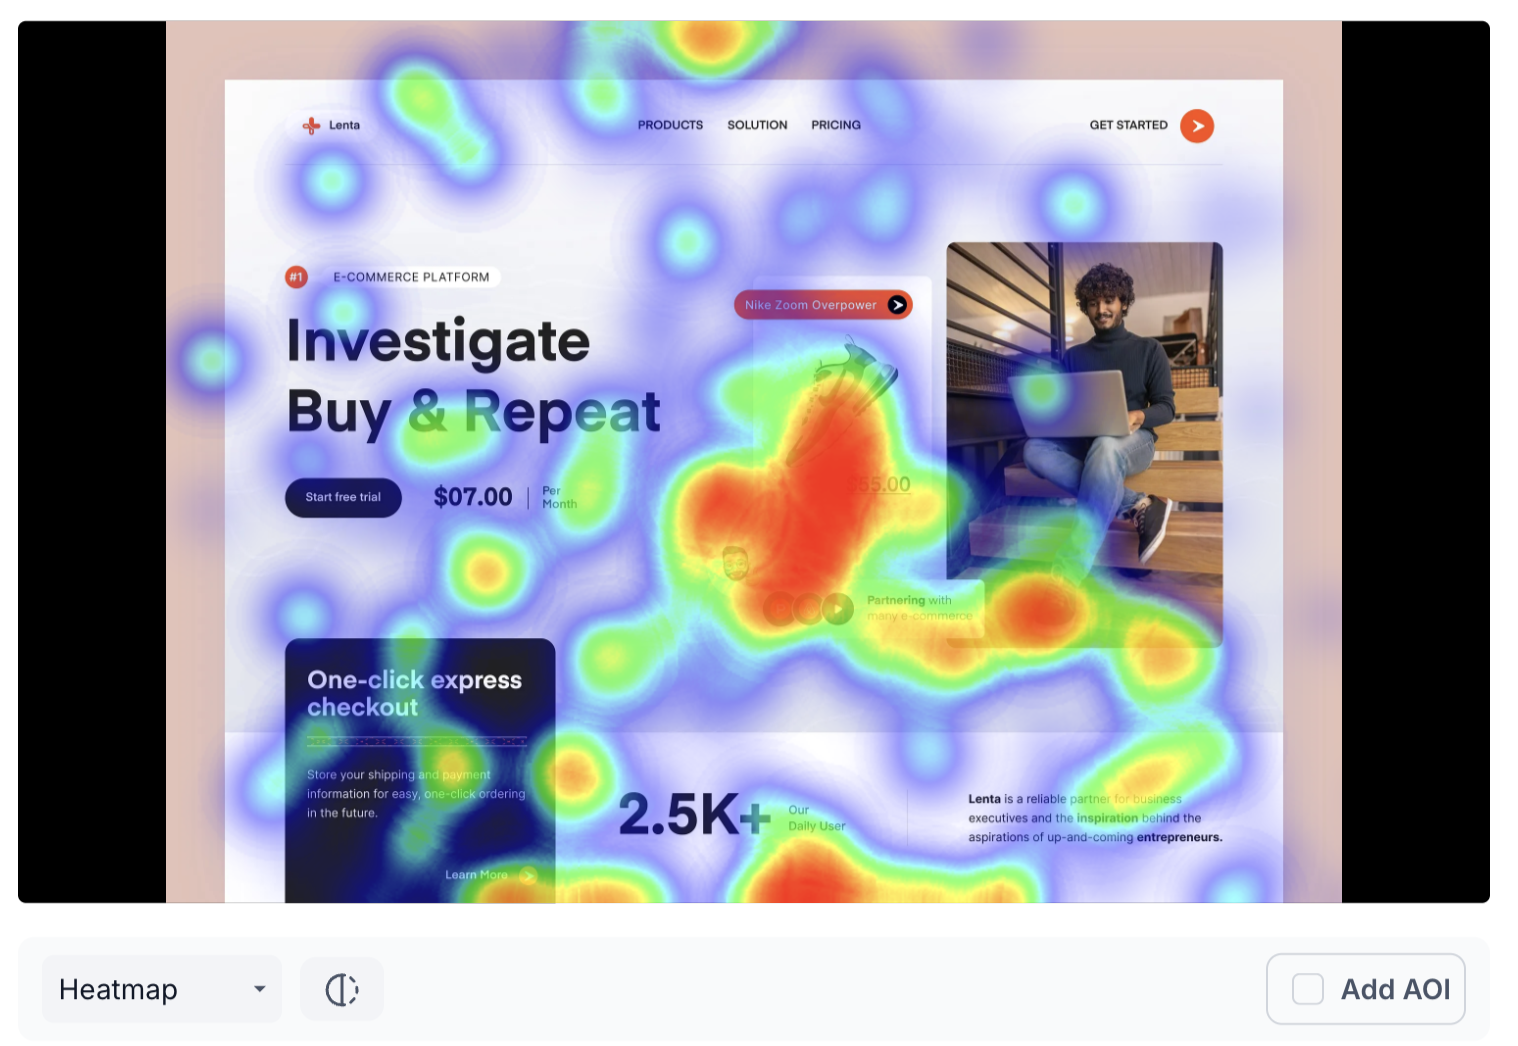
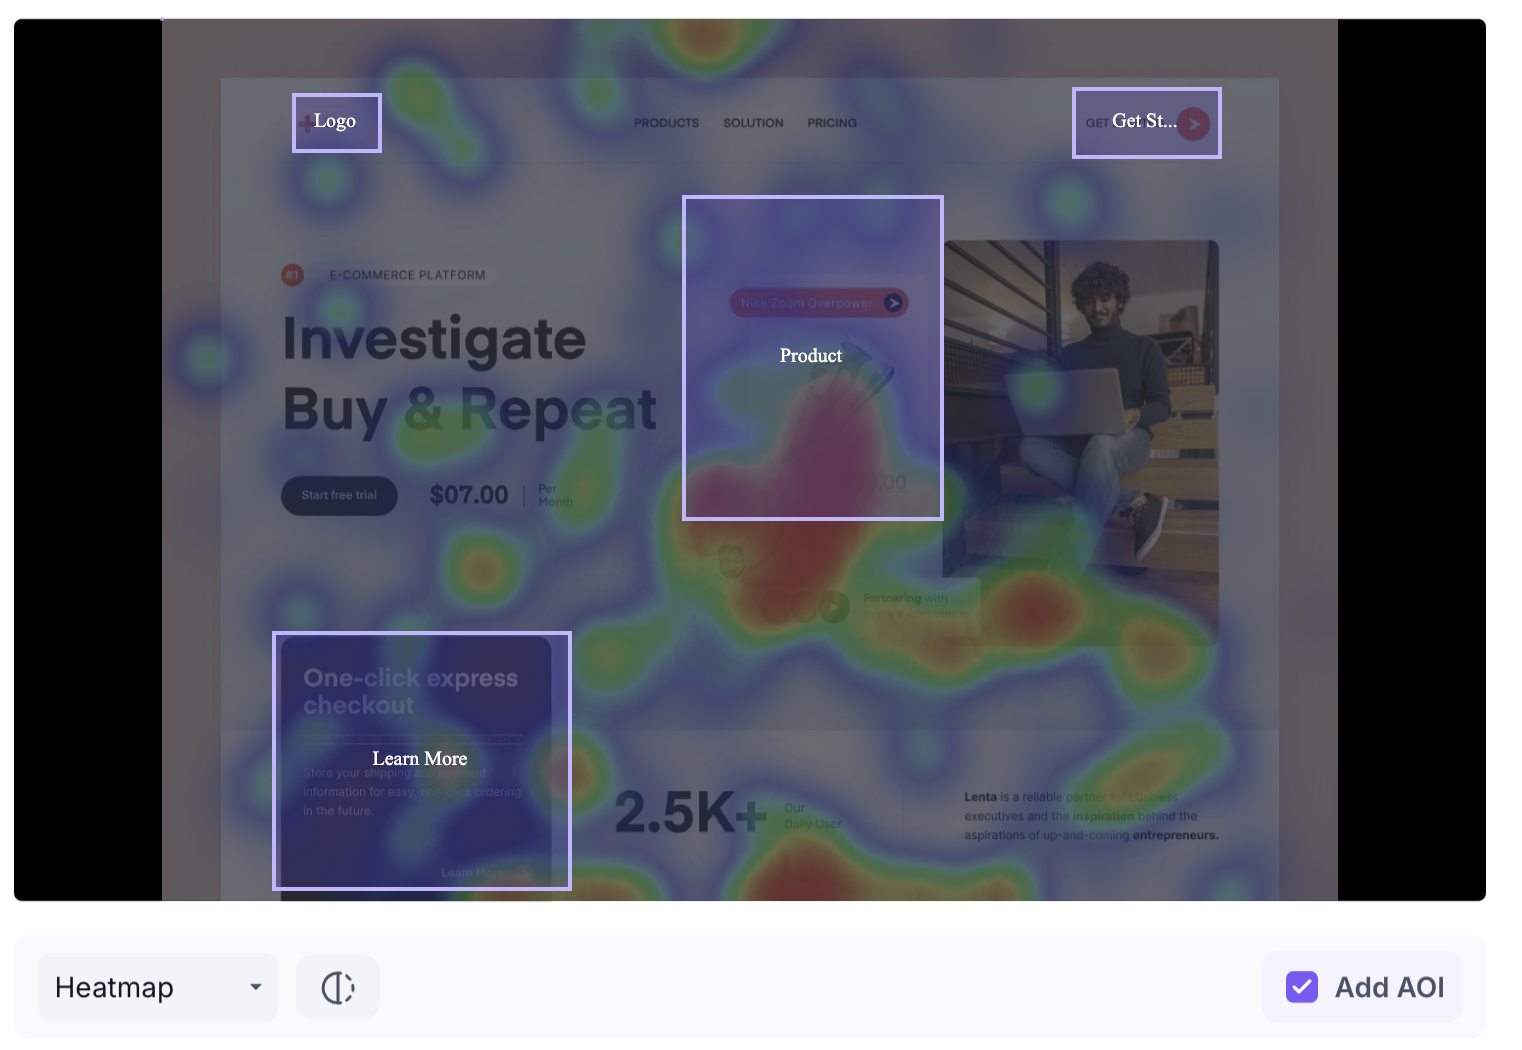
Heatmap: displays aggregated gaze intensity using a colour gradient from cool to warm. Warmer colours such as red and orange highlight areas that received the most visual attention. Cooler colours indicate areas that received less attention
The heatmap display can be adjusted using three sliders: Radius, Shadow and Blur.
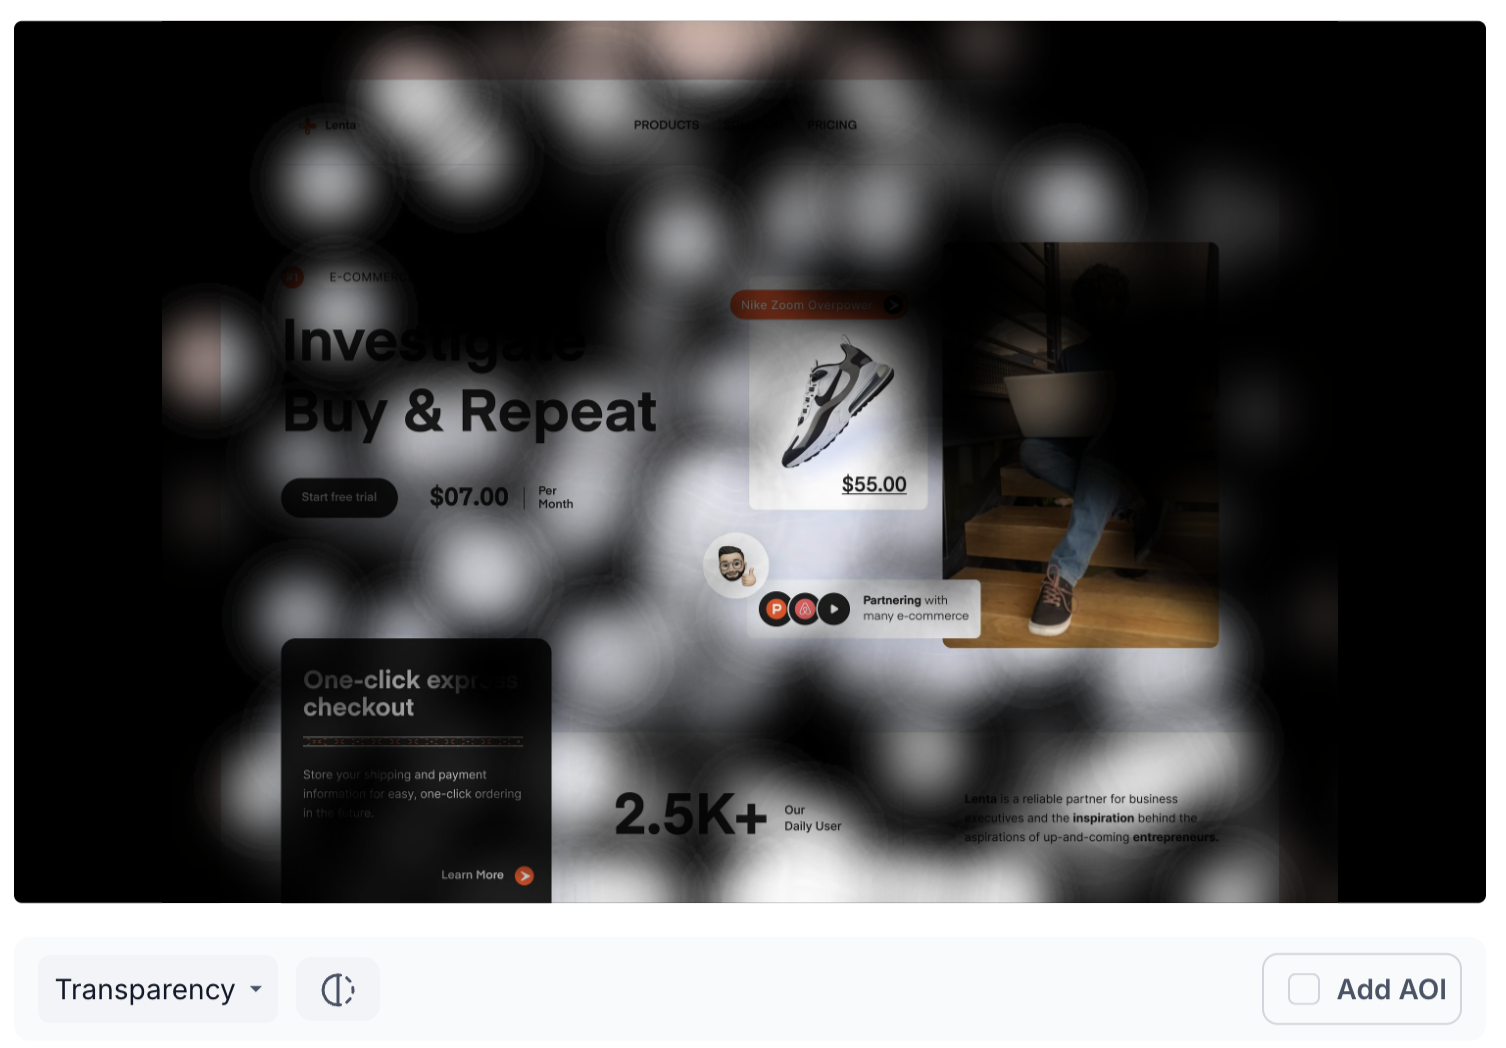
Transparency: makes areas of the image more transparent where participants looked most, providing a clear view of attention distribution without the colour overlay of the heatmap
All Clicks: shows where participants clicked on the image during the viewing period, revealing which elements drew the most interaction
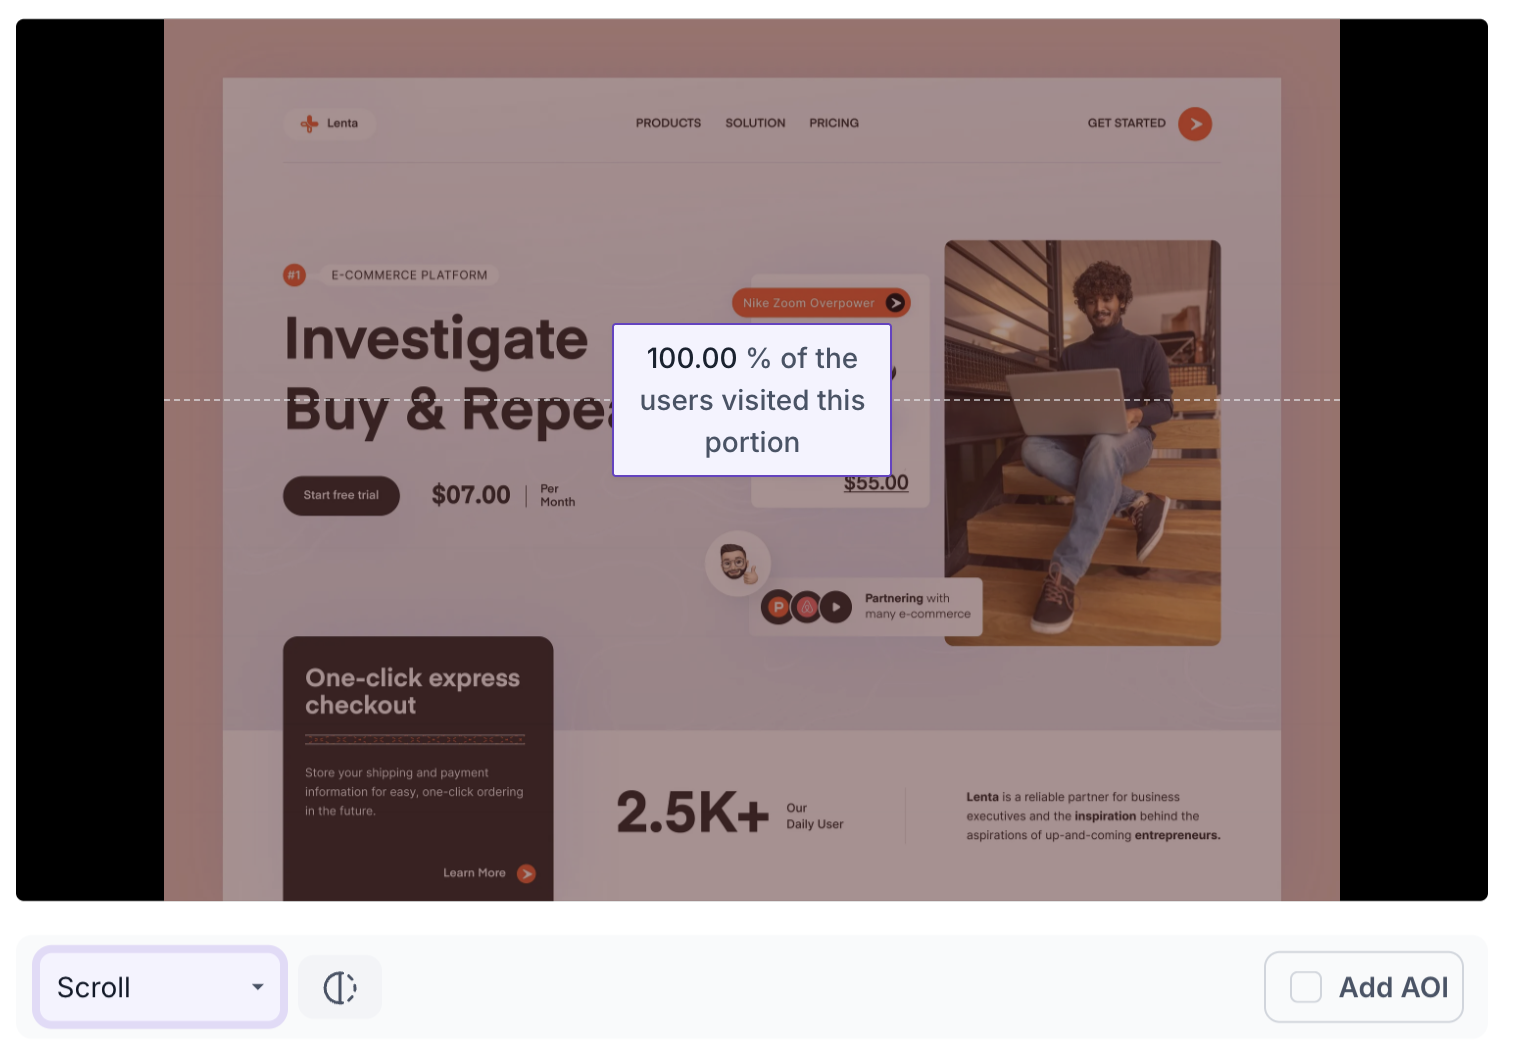
Scroll: shows how far participants scrolled through the image if the content extended beyond the screen
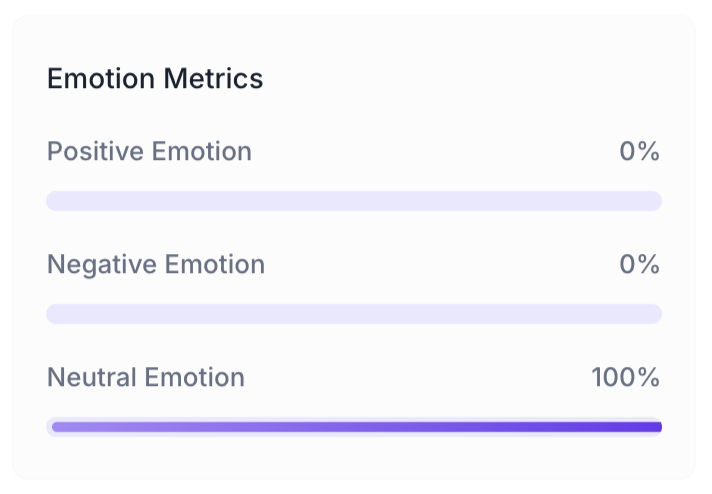
Emotion Metrics
The emotional response of participants while viewing the image is shown as a percentage breakdown.
- Positive Emotion: Percentage of participants who expressed a positive emotional response such as happiness or surprise
Negative Emotion: Percentage of participants who expressed a negative emotional response such as anger or disgust
Neutral Emotion: Percentage of participants who expressed no strong emotional response
Areas of Interest
Areas of Interest allow you to track participant attention within a specific region of the image, such as a logo, a headline or a call to action. Click Add AOI to draw a box over the area you want to track. Enter a name for the AOI and set the duration using the slider to define the time window you want to analyse. Click Save to finalise.
Once saved, each AOI displays the following metrics.
- Time Spent: Total time participants spent looking at this area
- Avg Time to First Fixation: Average time taken for participants to first notice this area
- Avg Fixation Duration: Average length of time participants held their gaze on this area
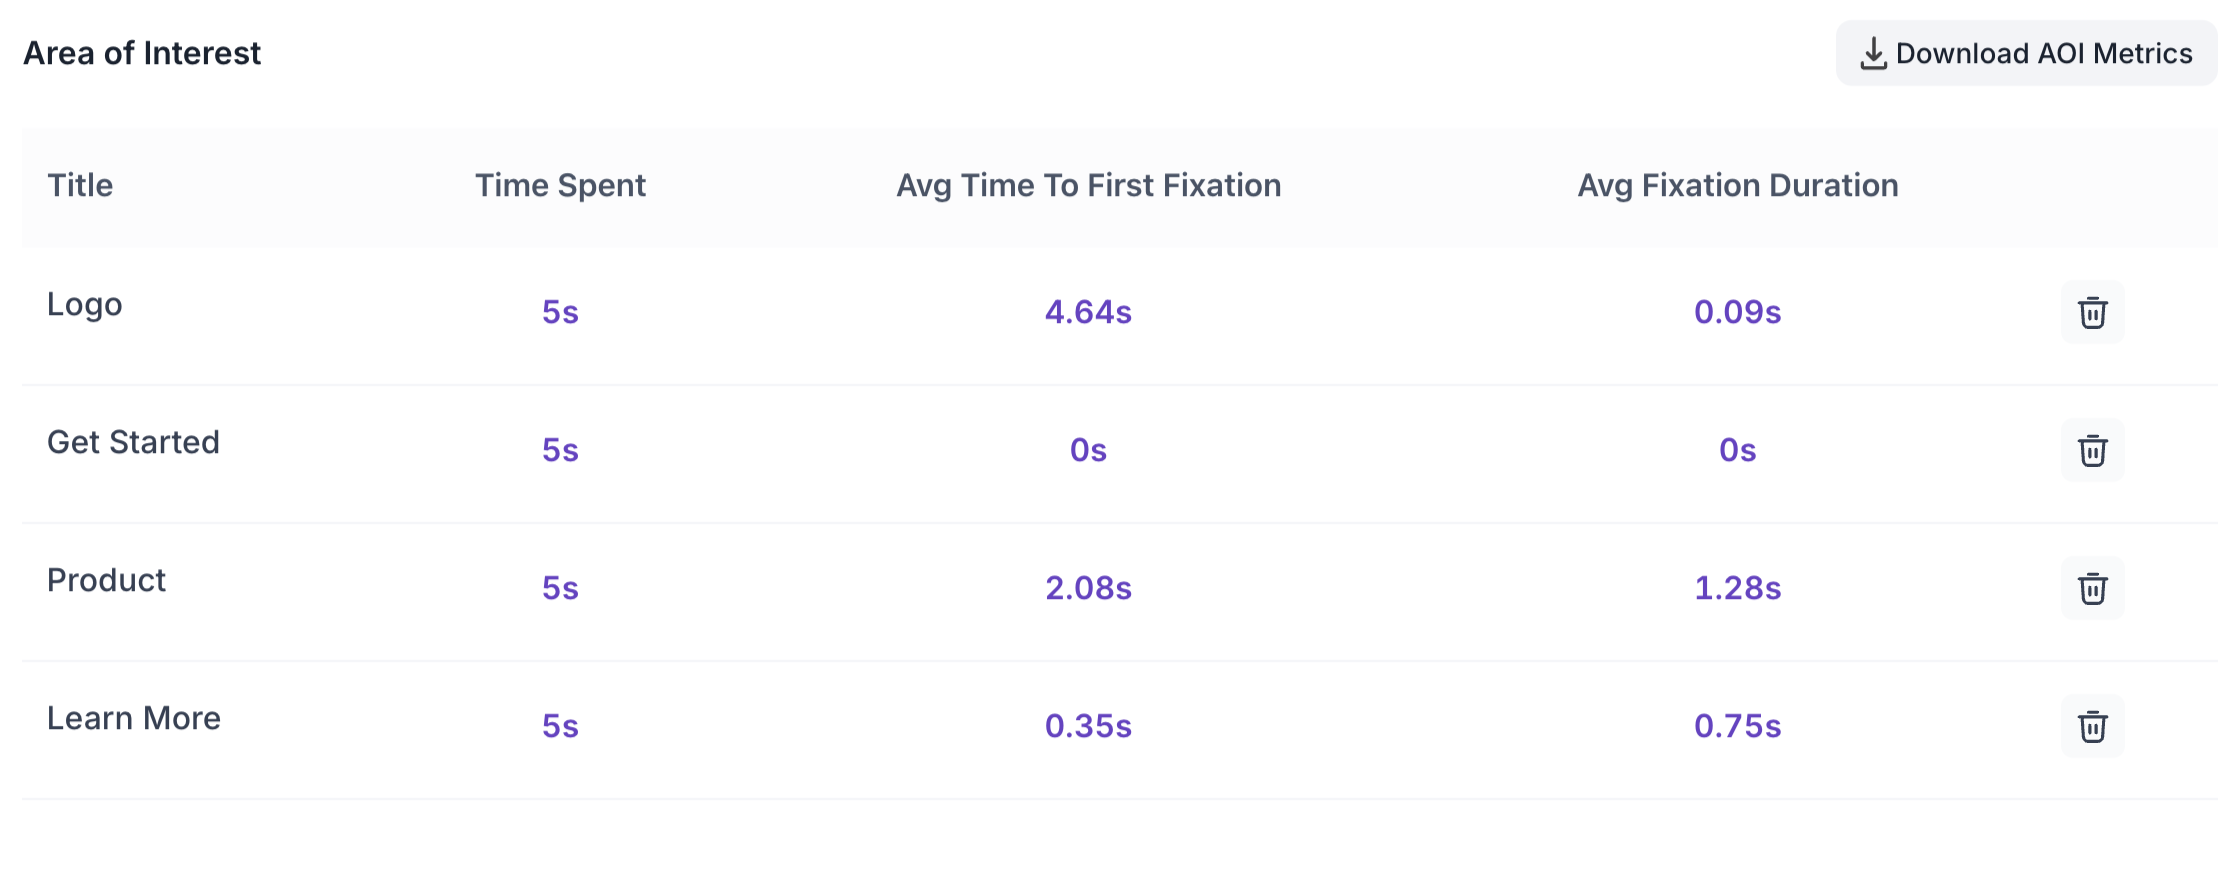
AOI data can be downloaded as a CSV file using the Download AOI Metrics button.
Media Graph Metrics
Below the image, two graphs are available. Use the dropdown to switch between them.
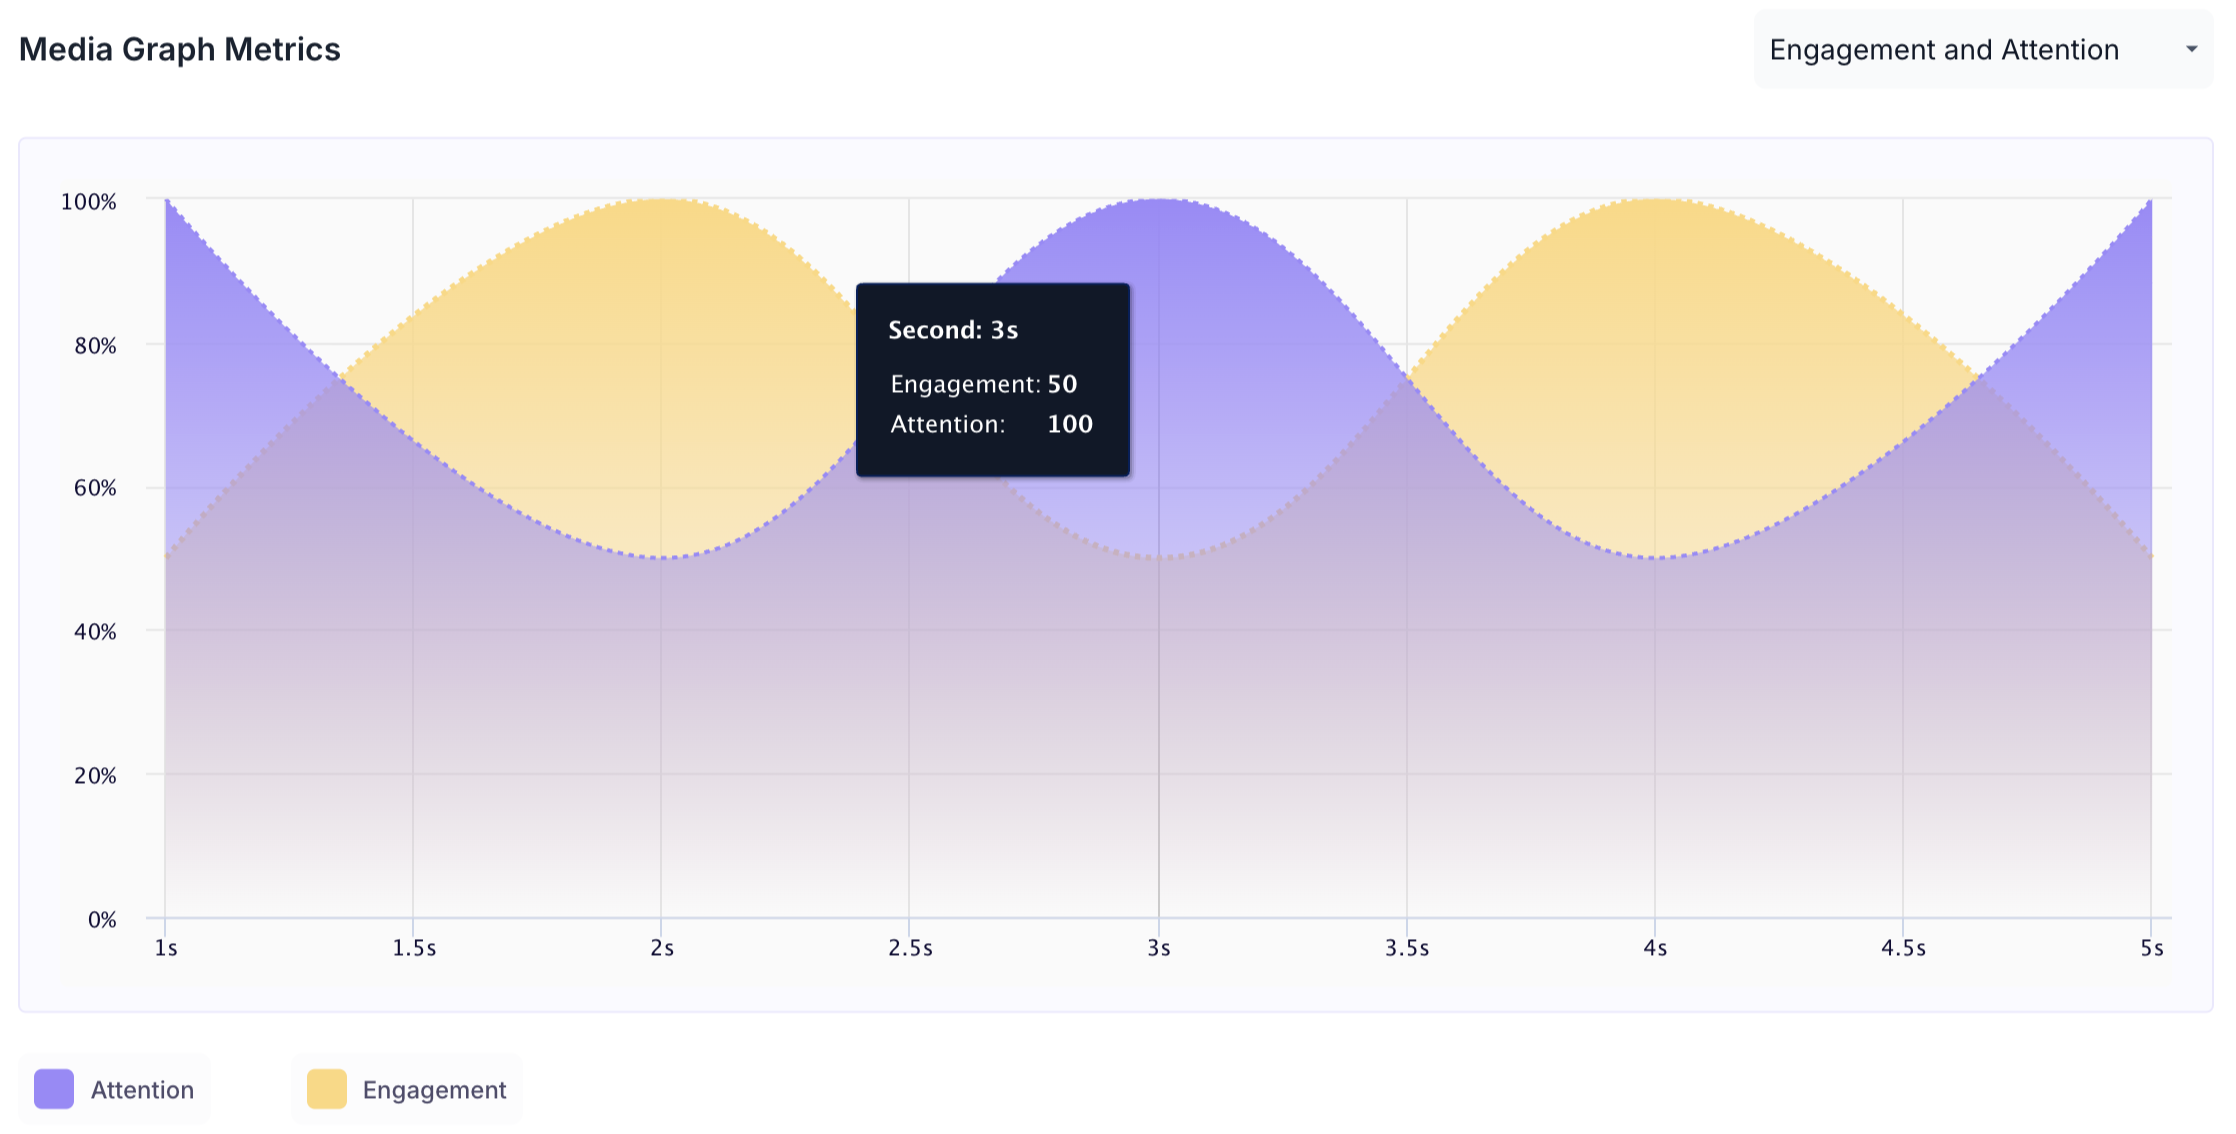
Engagement and Attention
Shows how attention and engagement levels changed across the duration of the viewing period.
- Purple area: Attention Score
- Orange area: Engagement Score
- X axis: Time in seconds
- Y axis: Score from 0 to 100
Hover over any point on the graph to see the exact second and the corresponding engagement and attention scores at that moment.
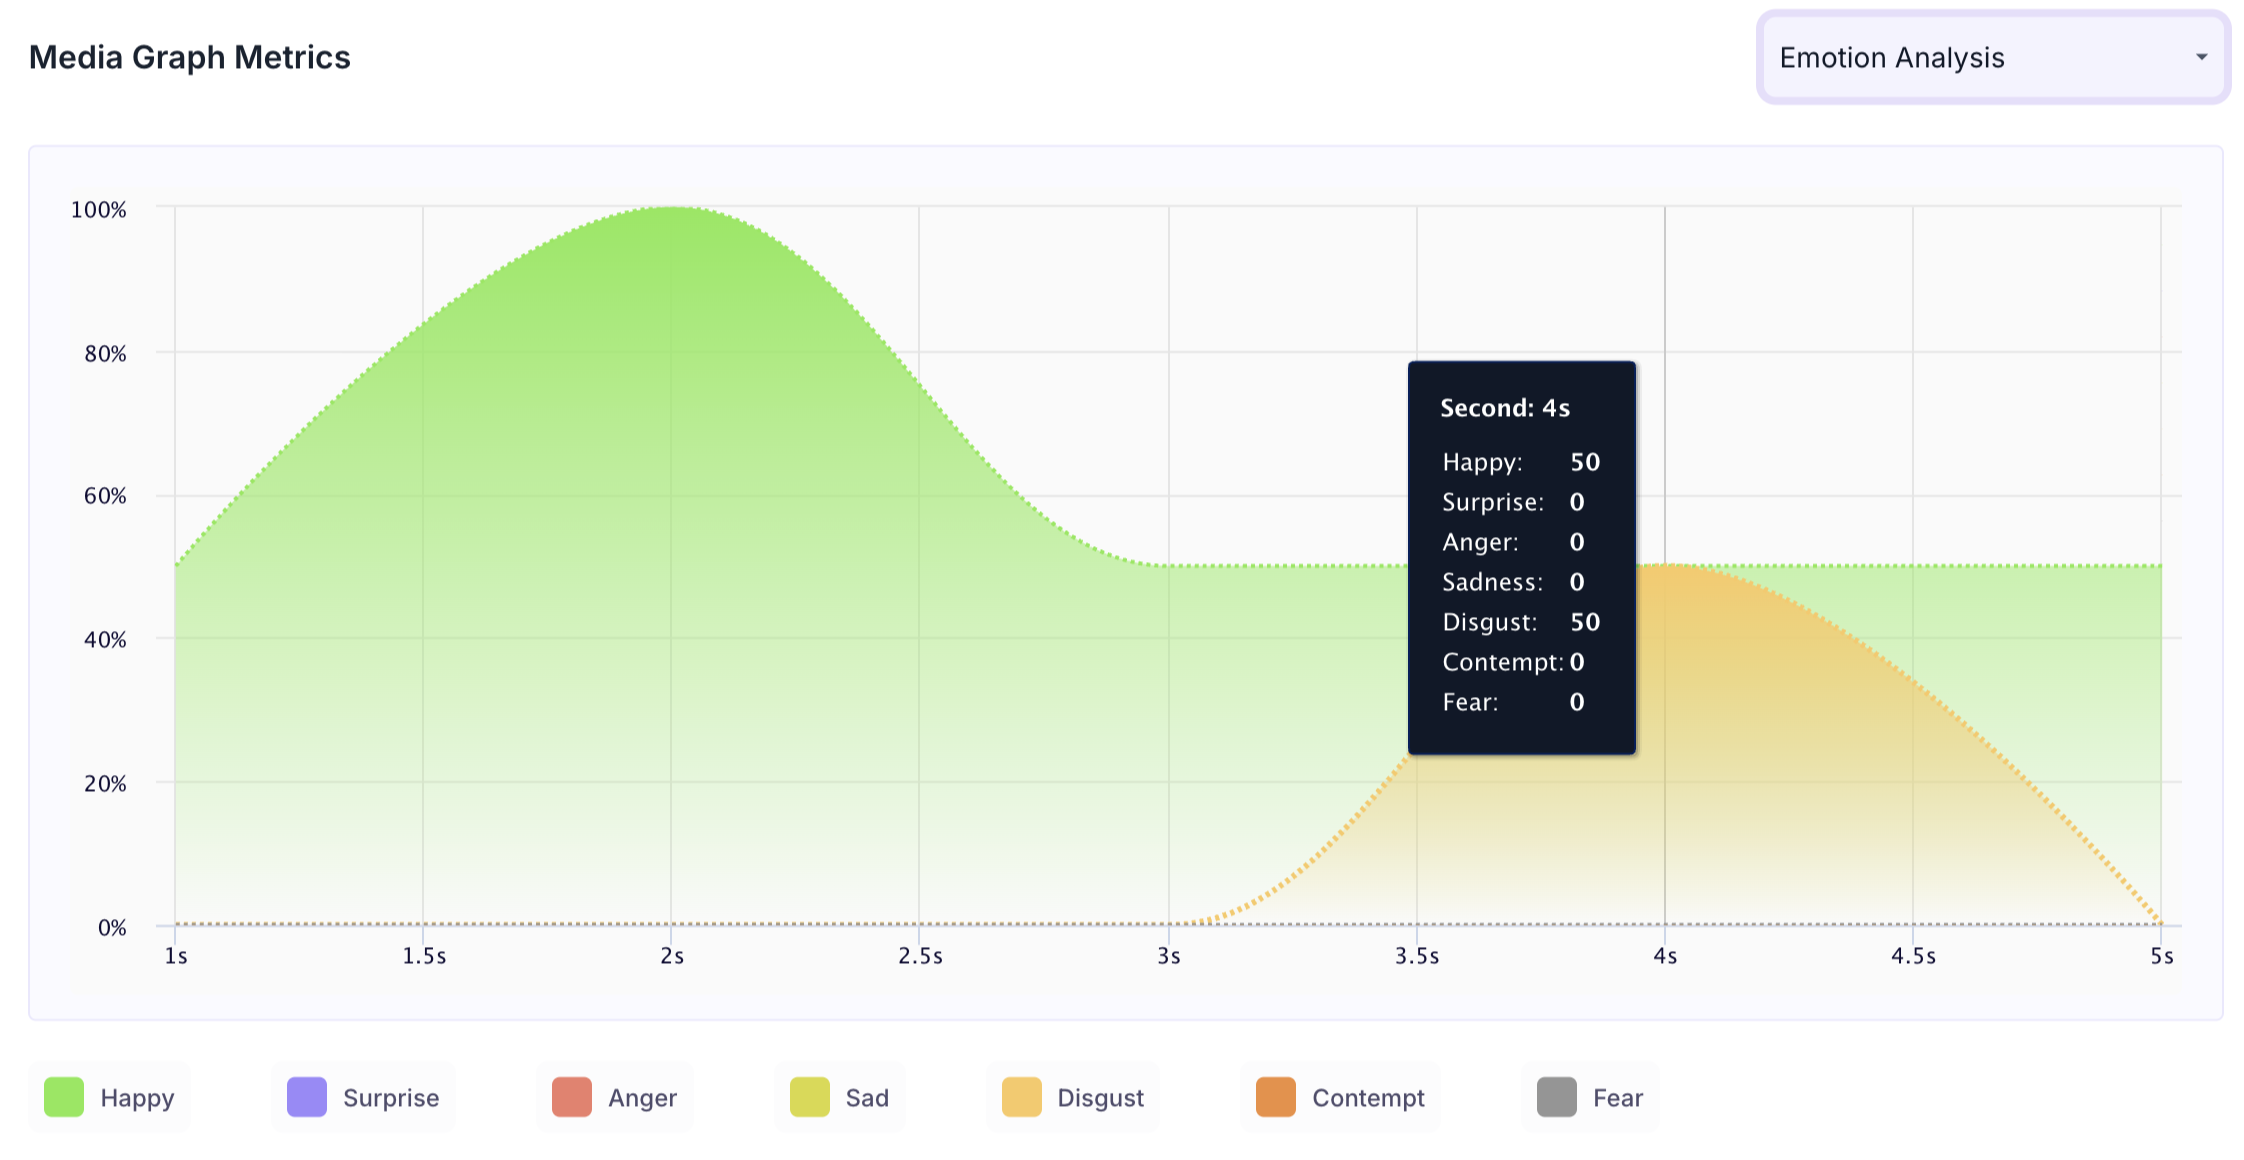
Emotion Analysis
Shows how emotional responses changed across the duration of the viewing period. Each emotion that was expressed is shown as a separate coloured line. A colour key at the bottom of the graph identifies which colour corresponds to which emotion. Hover over the graph to see the score for each emotion at a specific second.
Note
The emotions tracked are Happy, Surprise, Anger, Sadness, Disgust, Contempt and Fear.