Voice Tonality
What is Voice Tonality?
Voice tonality is the way a person speaks to someone. Essentially, it’s how you sound when you say words out loud.
Voice Tonality in Decode
It is the process of studying users' emotions and behaviour using their voices. Speech carries both verbal and non-verbal information, which makes it very dense information. Voice is the only modality to carry such enormous amounts of information about human behaviour.
Using Decode, you can detect multiple cues from voice, such as:
- Speech(verbal data)
- Emotion
- Confidence or Nervousness
At the fundamental level, we can extract the following datapoint from speech for each second:
- Happy
- Sad
- Fear
- Surprise
- Neutral
- Angry
- Disgust
Apart from emotions, confidence is also calculated for each second.
Decode Voice Tonality Metrics
We give these three metrics using voice data
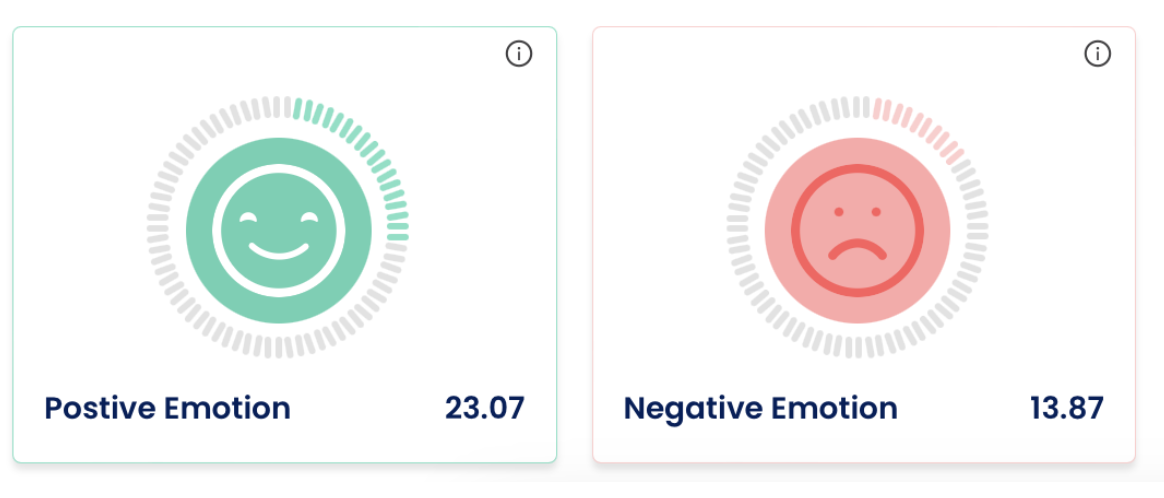
- Positive Emotion: This is calculated as the percentage of the time speakers in the entire meeting felt positive emotions.
- Negative Emotion: The percentage of the time negative emotions were felt by speakers in the meeting.
Note: Silence is removed in these calculations, and the base is always the total amount of time people used to speak. In summary of Decode, however, the positive and negative emotions are also calculated from face data if a face video is available, and then a weighted sum is given as the final AI metric.
Speaker Phase Metrics
This Gantt chart shows the sequence of speaker participation in the meeting. The Gantt chart showcases the sequence of speakers in a horizontal timeline format, where each speaker is represented by a distinct bar. The highlighted part in each bar corresponds to the duration of the speaker's contribution, allowing viewers to quickly grasp the varying levels of engagement among participants. By examining the chart, one can easily identify which speakers had more significant roles or longer speaking durations and which speakers had comparatively lesser involvement.

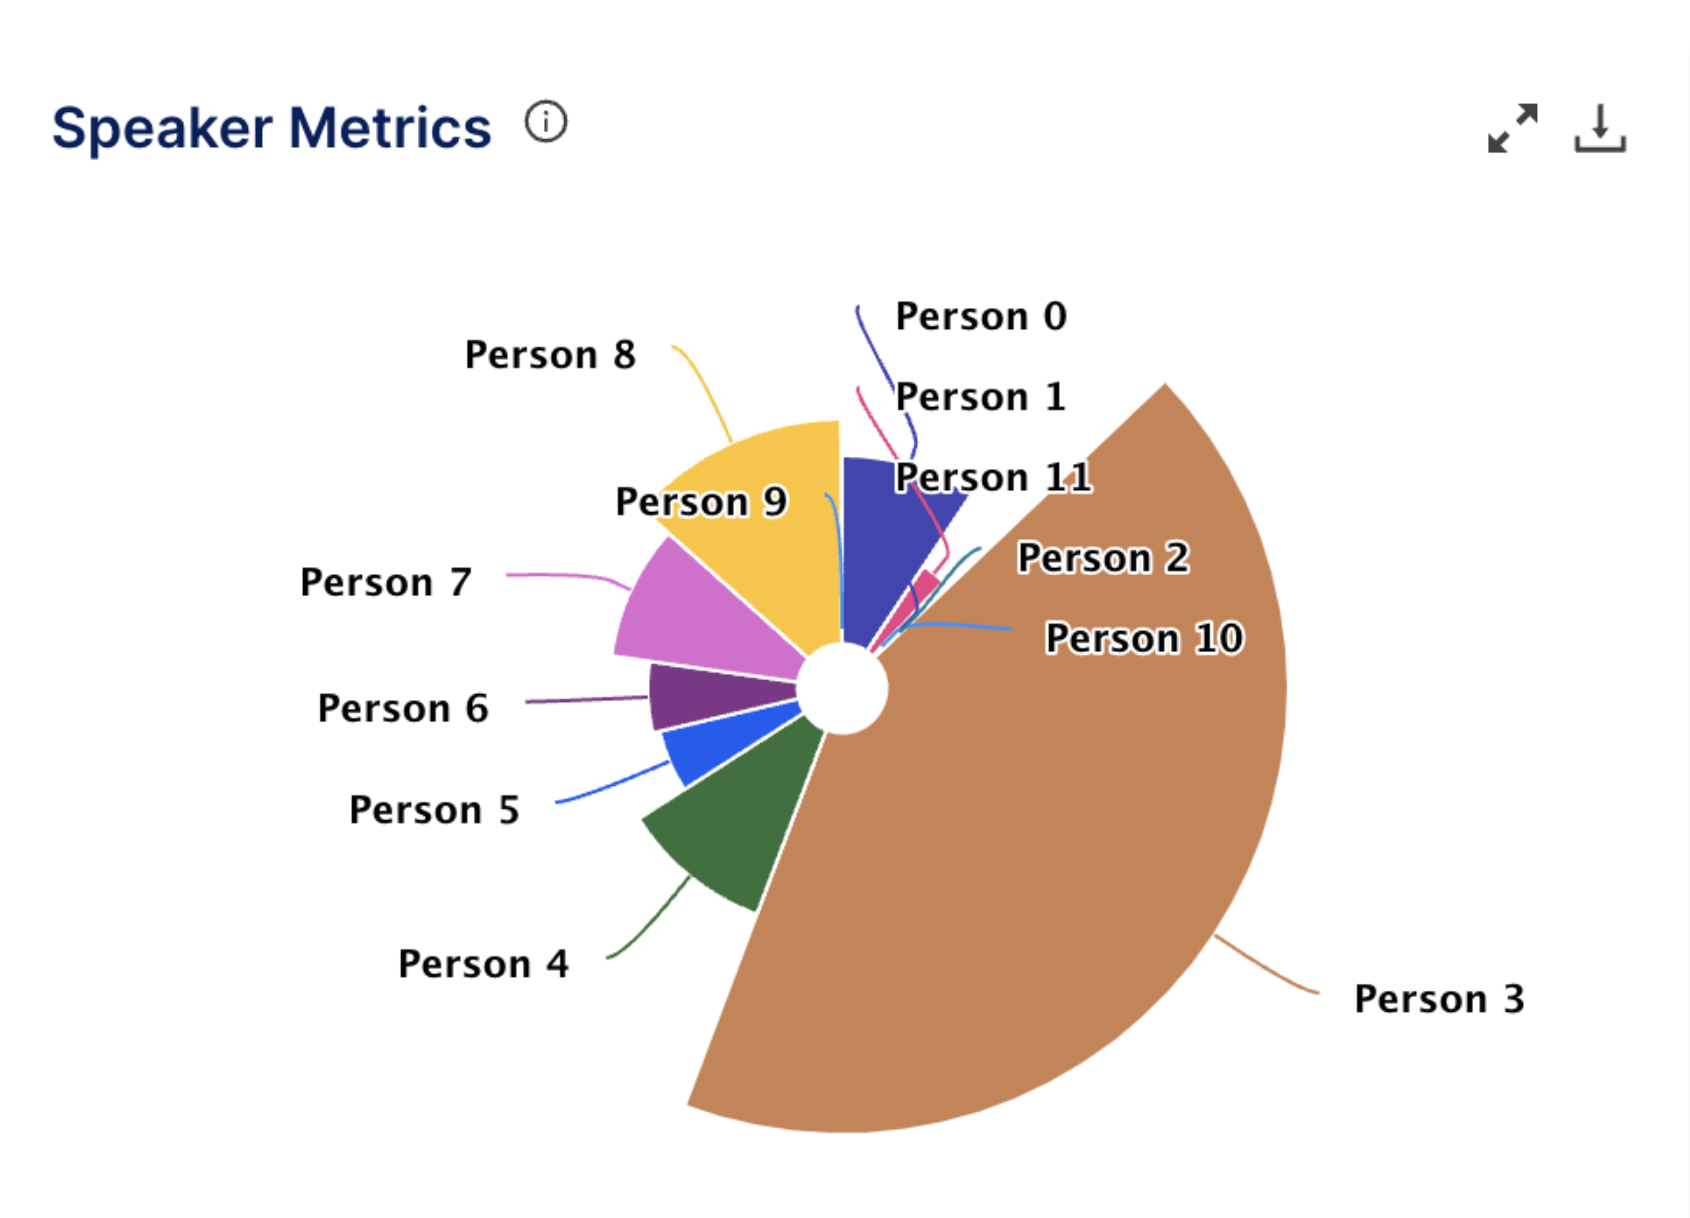
Speaker Metrics
This Pies chart provides information on the percentage of involvement from each participant in the conversation. To calculate the percentage of involvement, the total speaking time of each participant is measured and compared to the overall duration of the conversation. This calculation provides a relative representation of the proportion of speaking opportunities each participant had during the discussion.