How to view the result/analytics of the study?
The Result tab on the study page provides complete data about the responses submitted by the survey respondents and the analytics for their emotions and behaviour while viewing the media uploaded using the Upload/YouTube/Vimeo question block.
Here are the steps for accessing the results of your study:
Step 1: Once you log in to your Decode account, you will be directed to the dashboard.
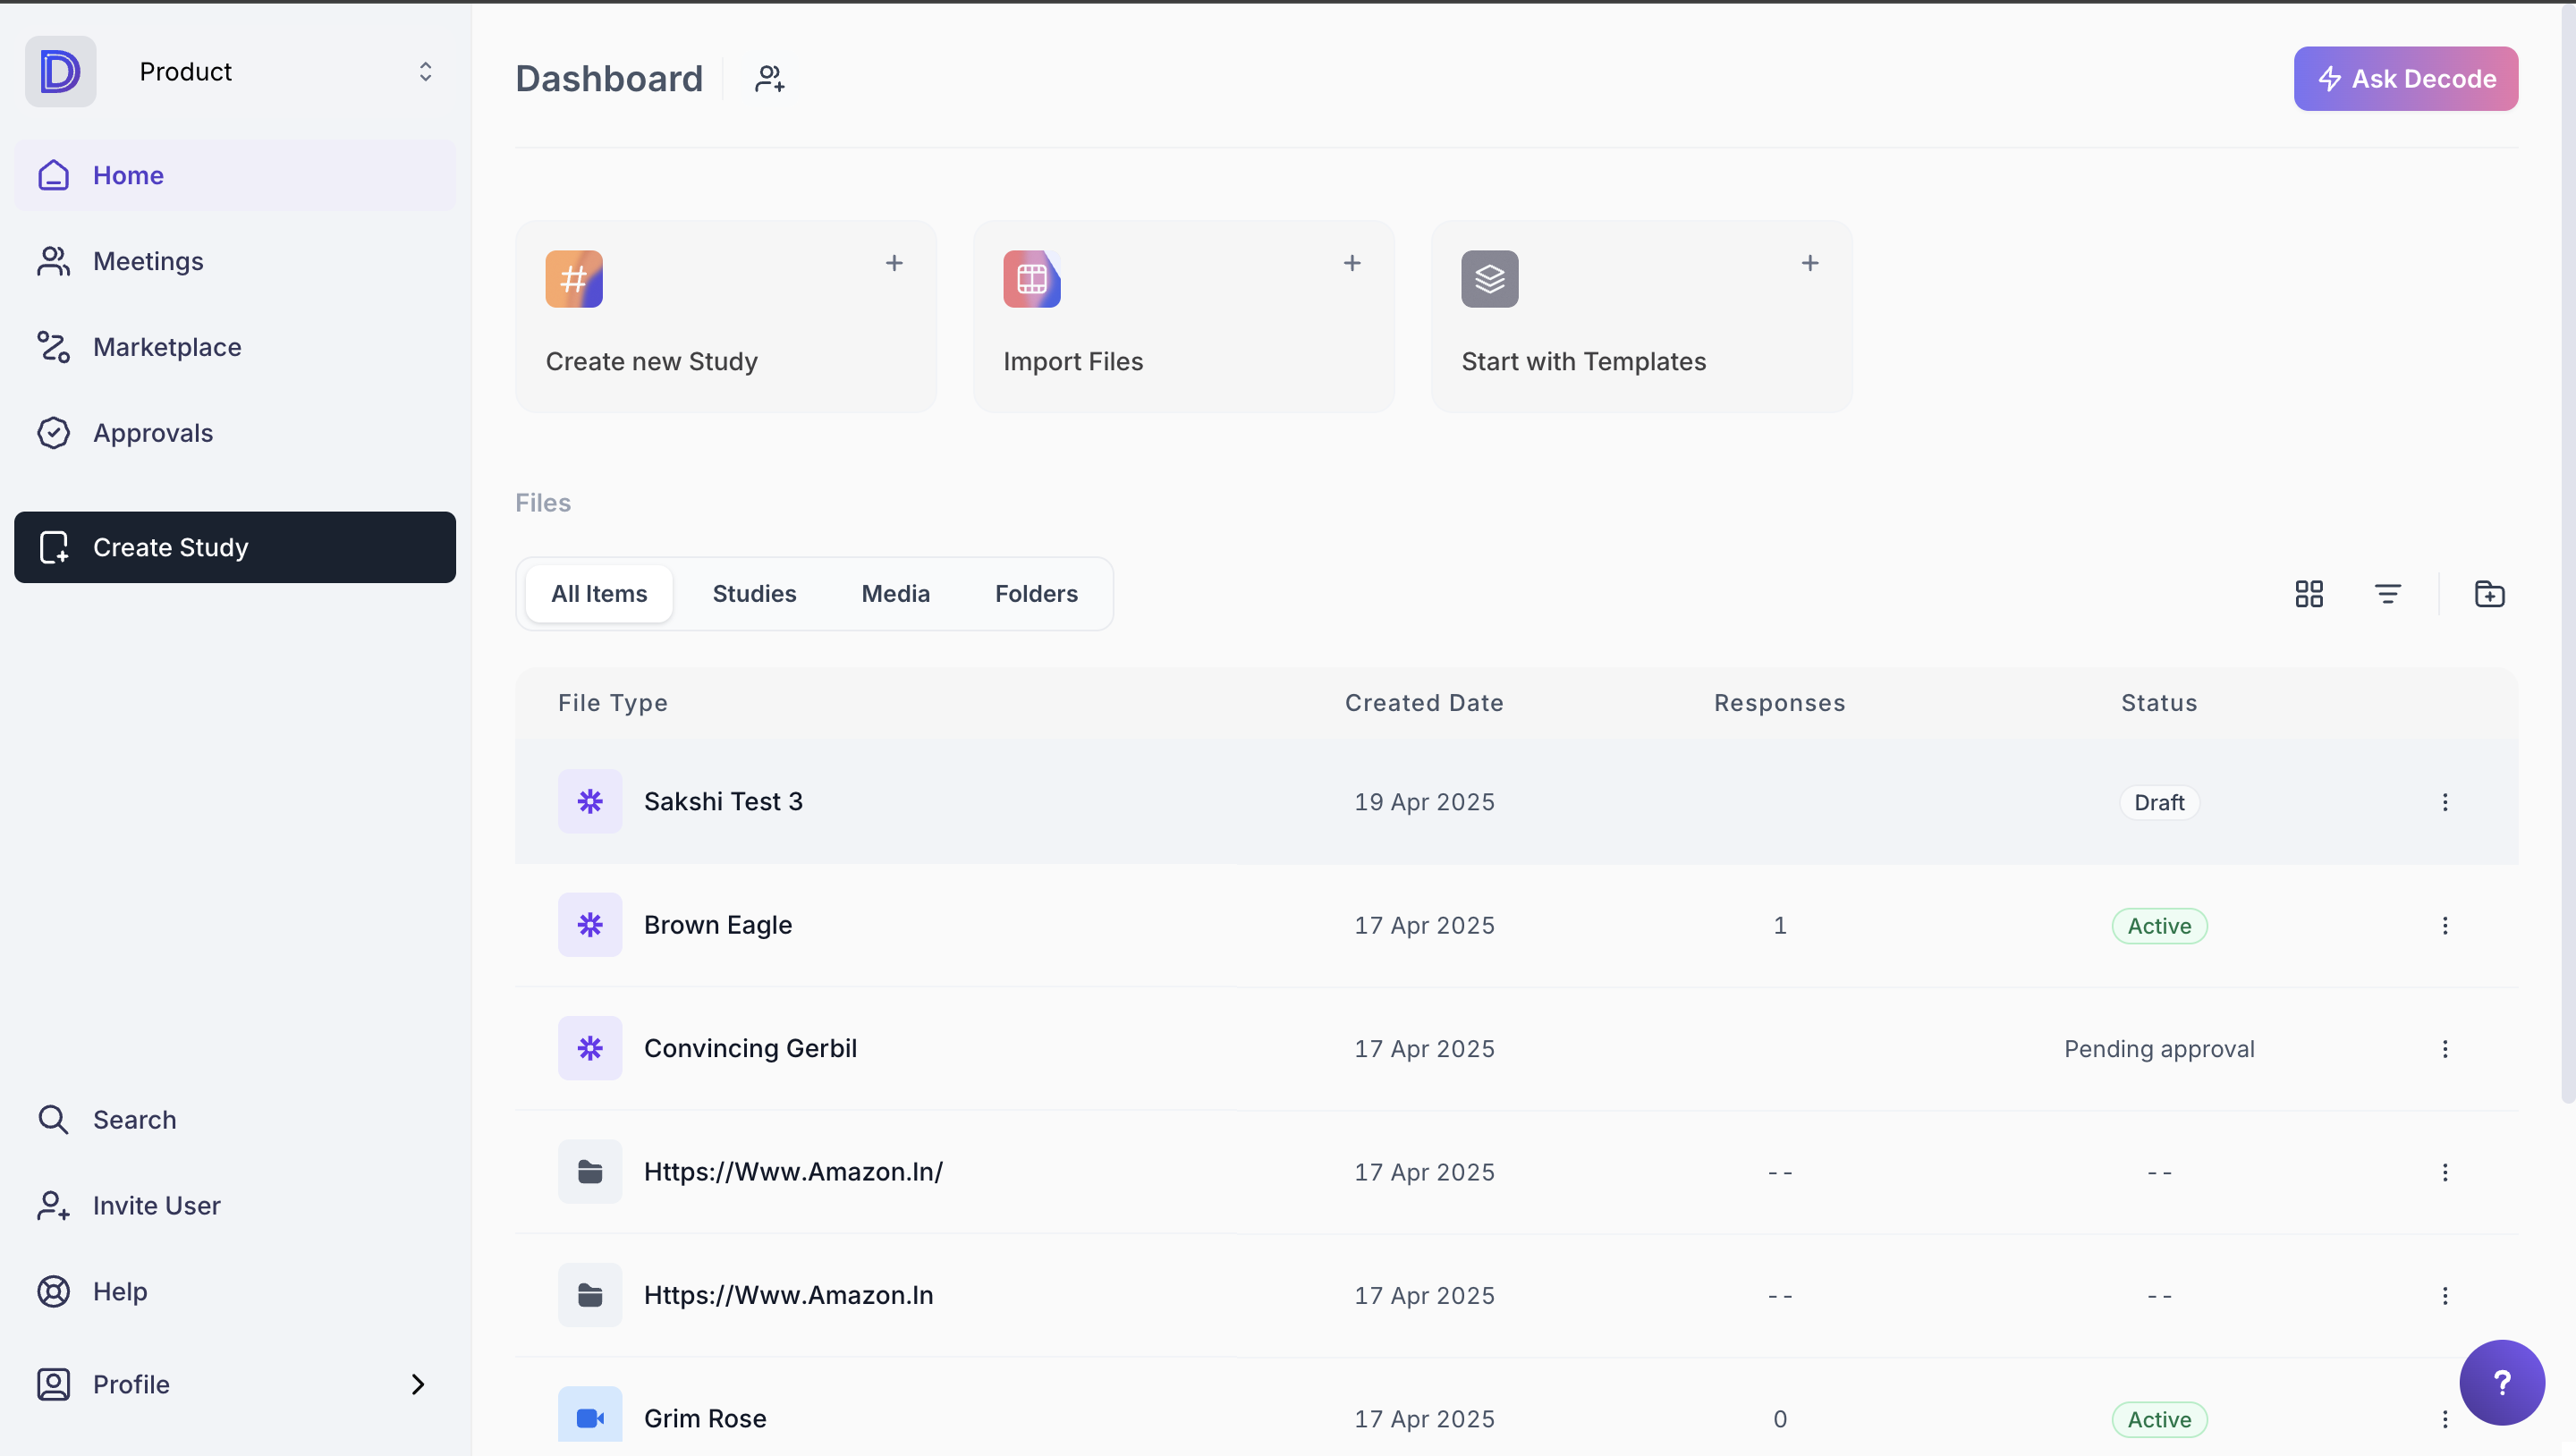
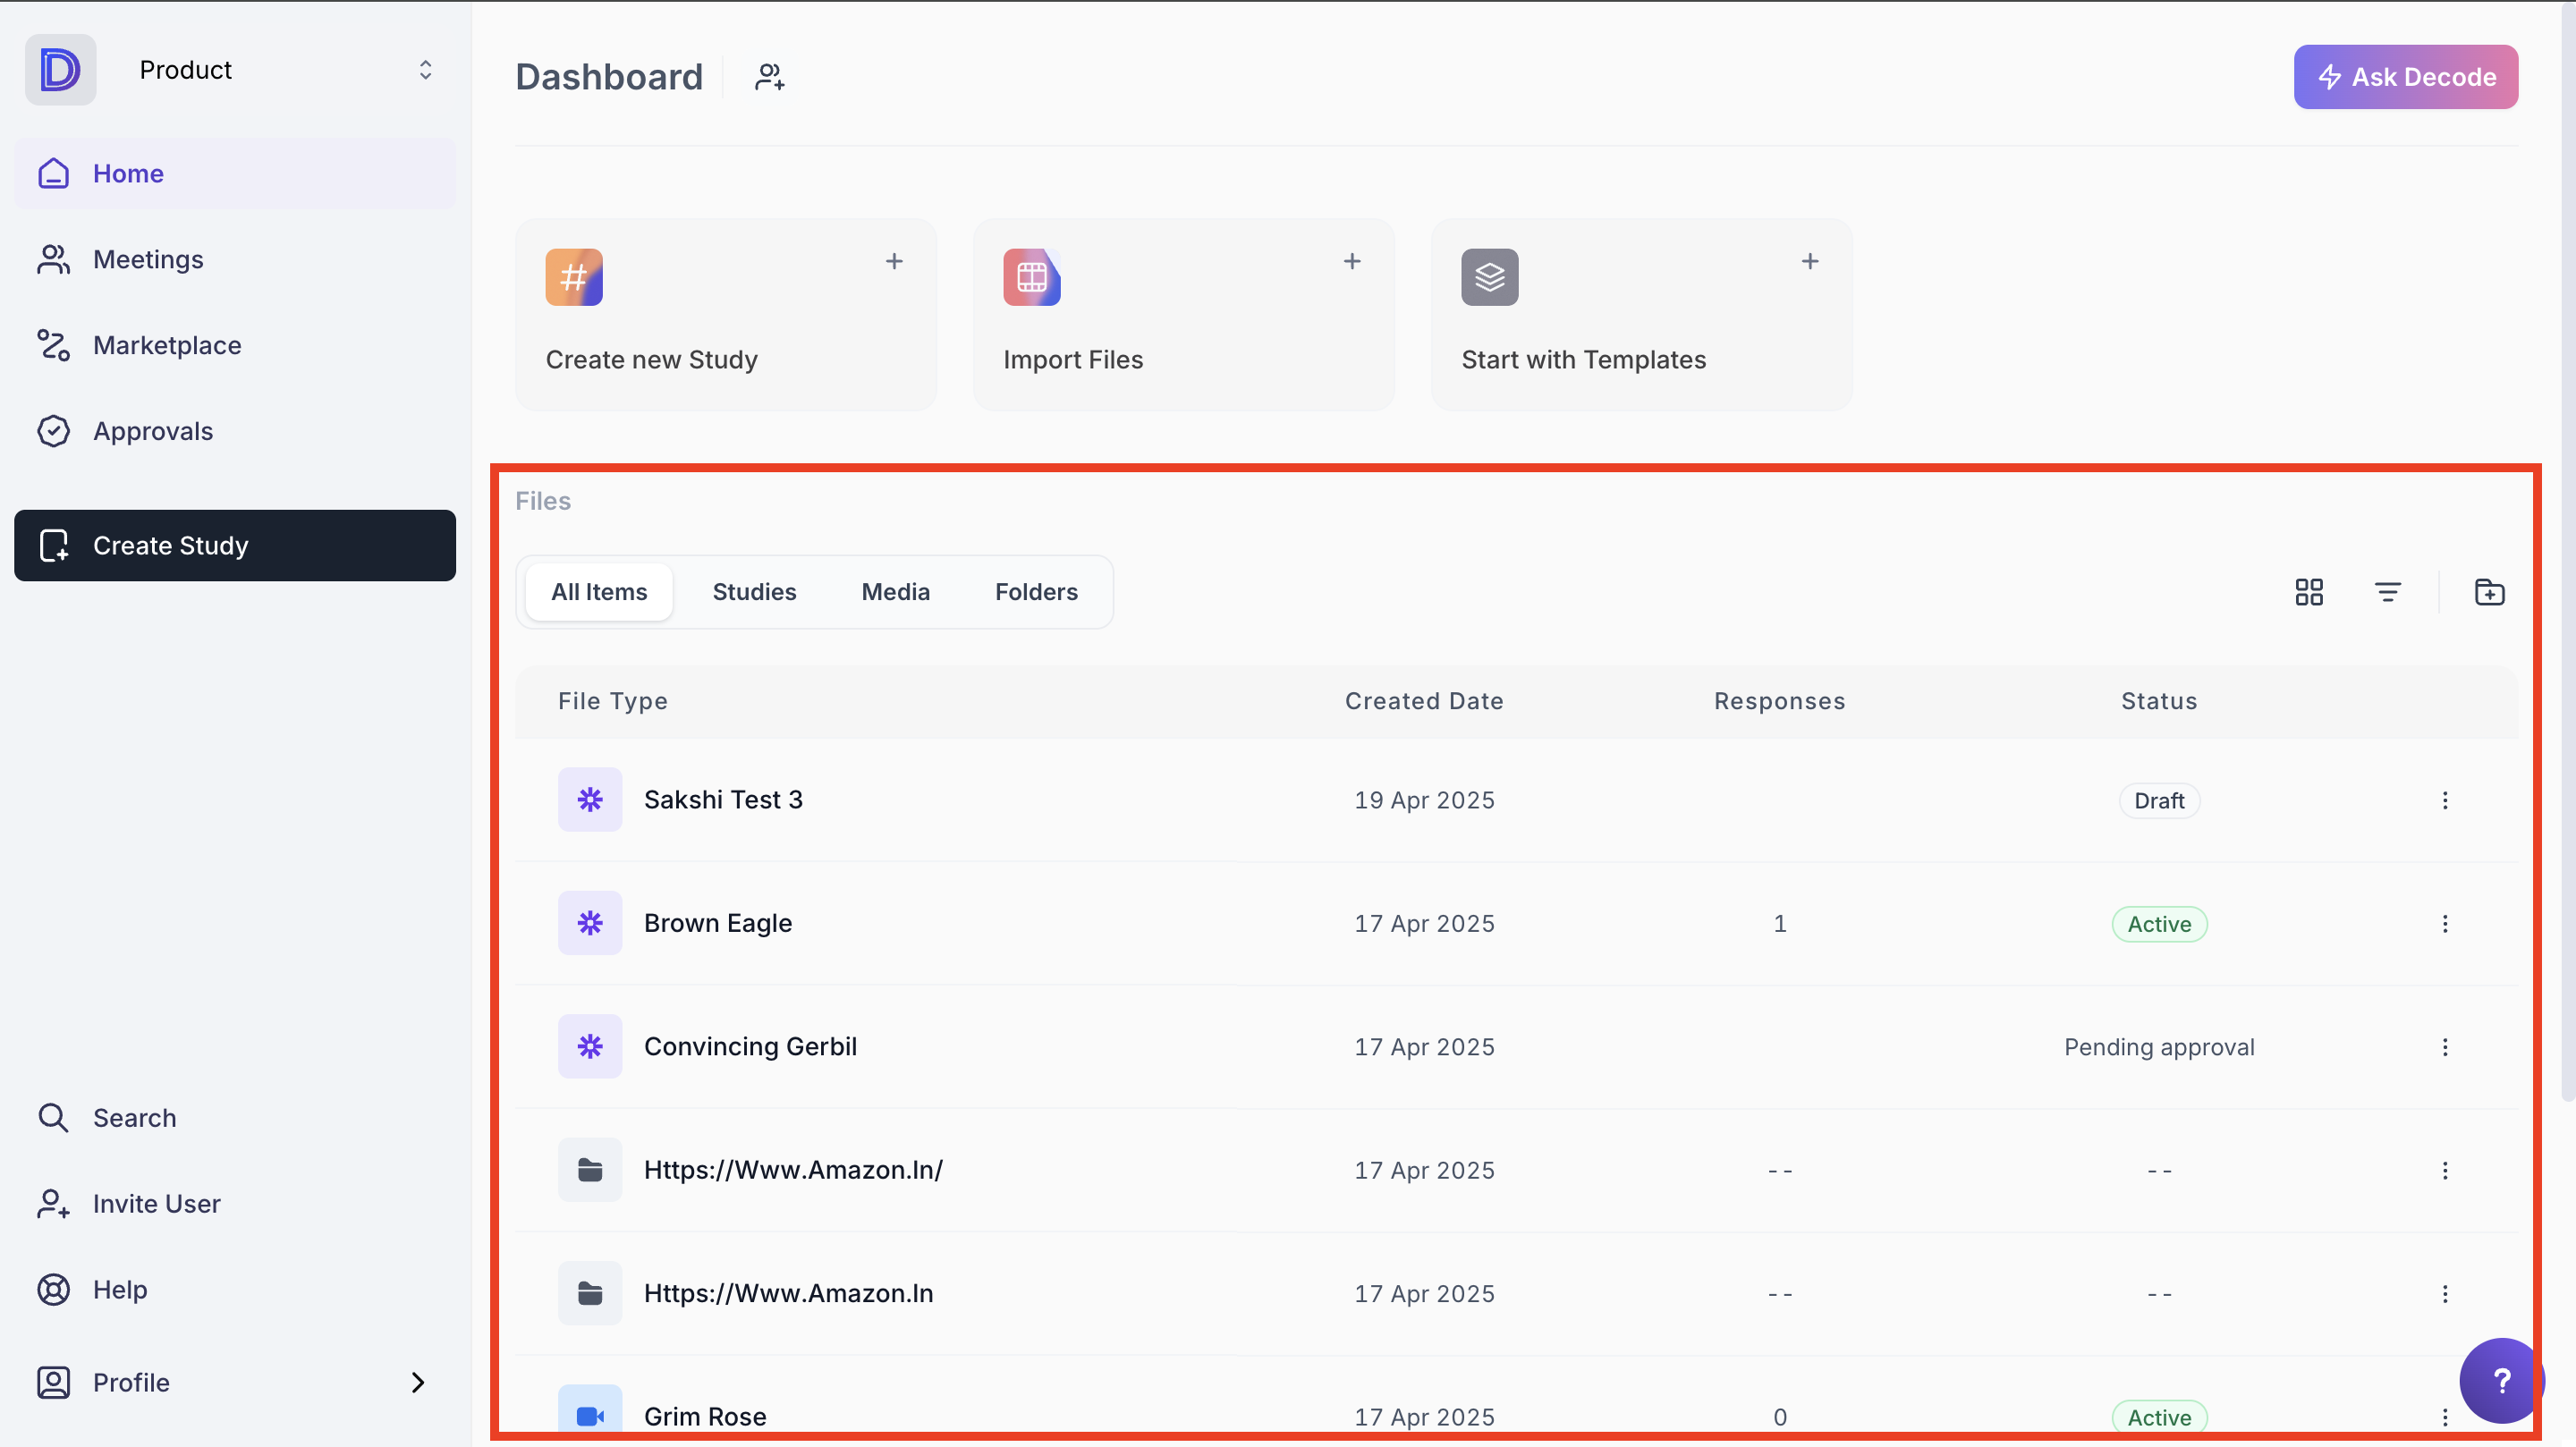
Step 2: Select the study you want to open from the files section.
Step 4: Go to the result tab from the navigation panel at the top of the page to view the results for question blocks.
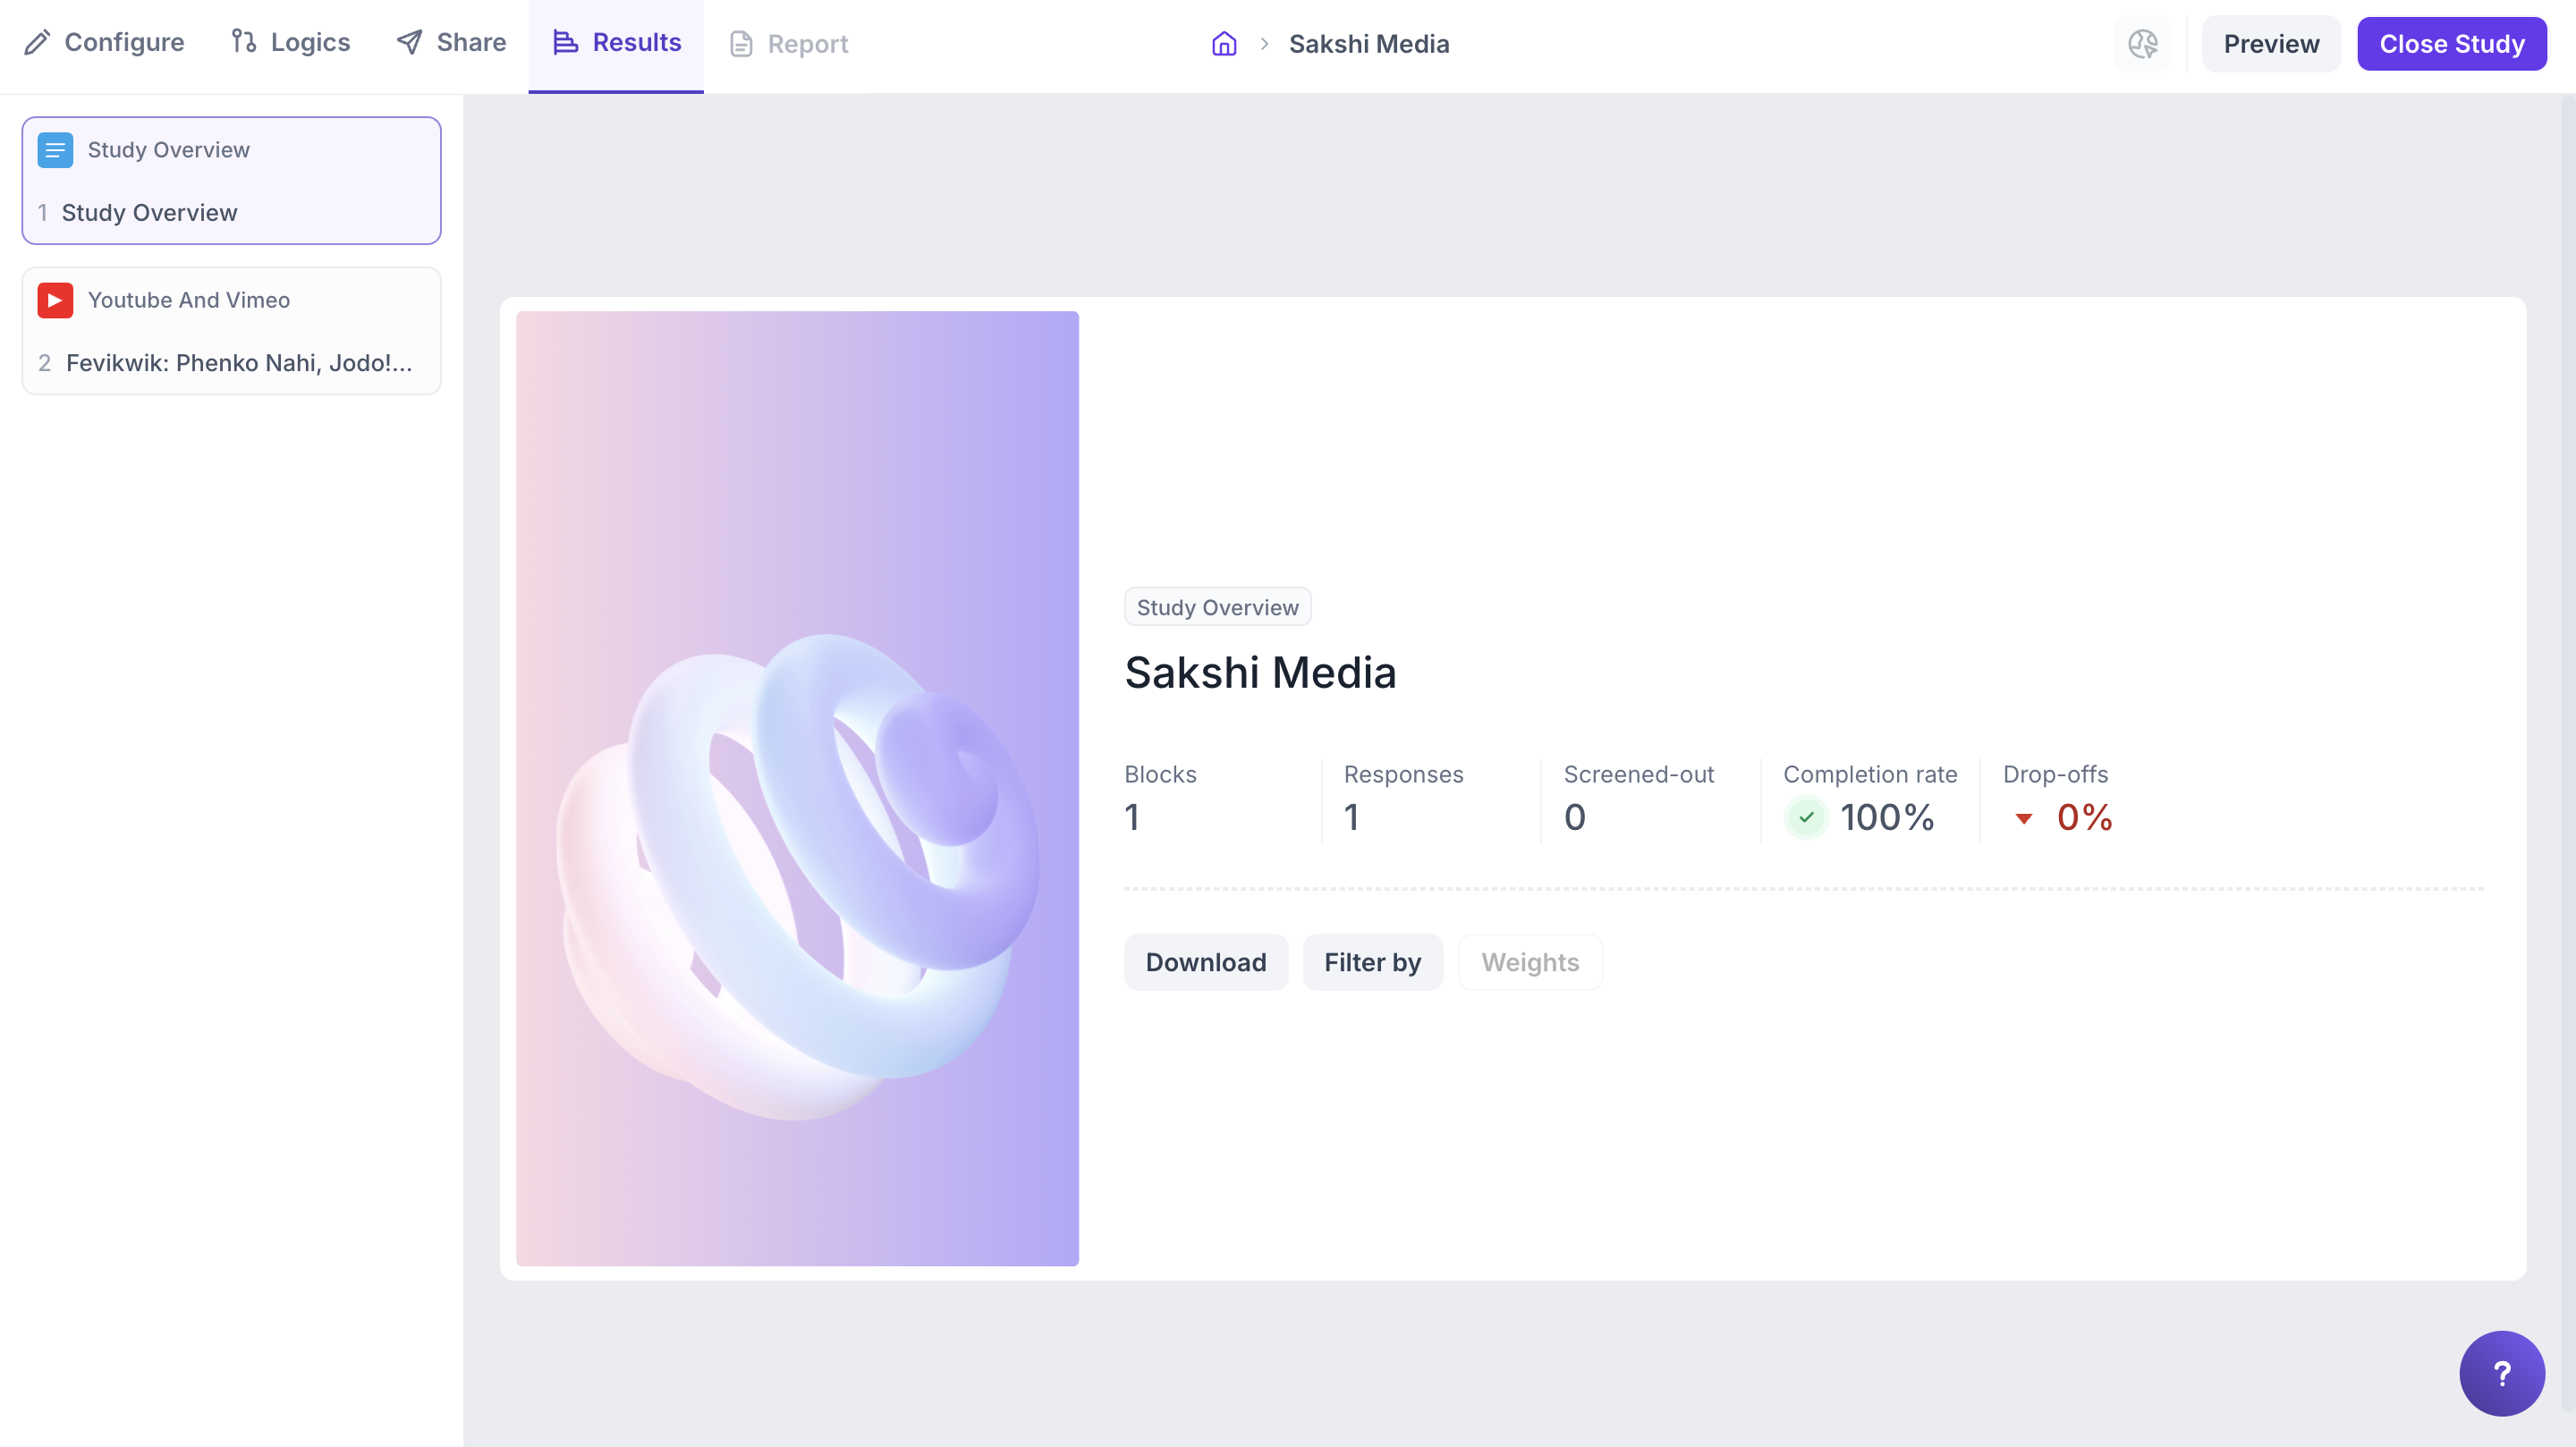
Step 5: On the result page, you will also be able to view question-wise analytics for all the question blocks added.
For the questions in the "General" section, you will find different types of graphs, and for the questions in the "Media" section, you will find analytics data and charts for understanding the respondent's emotions.
Graph type for different question blocks:
- General Section:
- Paragraph - Word Cloud
- Short answer - Word Cloud
- Checkbox - Horizontal Bar Chart
- Dropdown - Horizontal Bar Chart
- MCQ - Horizontal Bar Chart
- Thumbs-up/down - Pie Chart
- Linear scale - Column Chart
- Smiley Rating - Column Chart
- Star Rating - Column Chart
- NPS Rating: Speedometer and column chart
Step 6: You can navigate to different questions from the navigation panel and view the results for the question block.
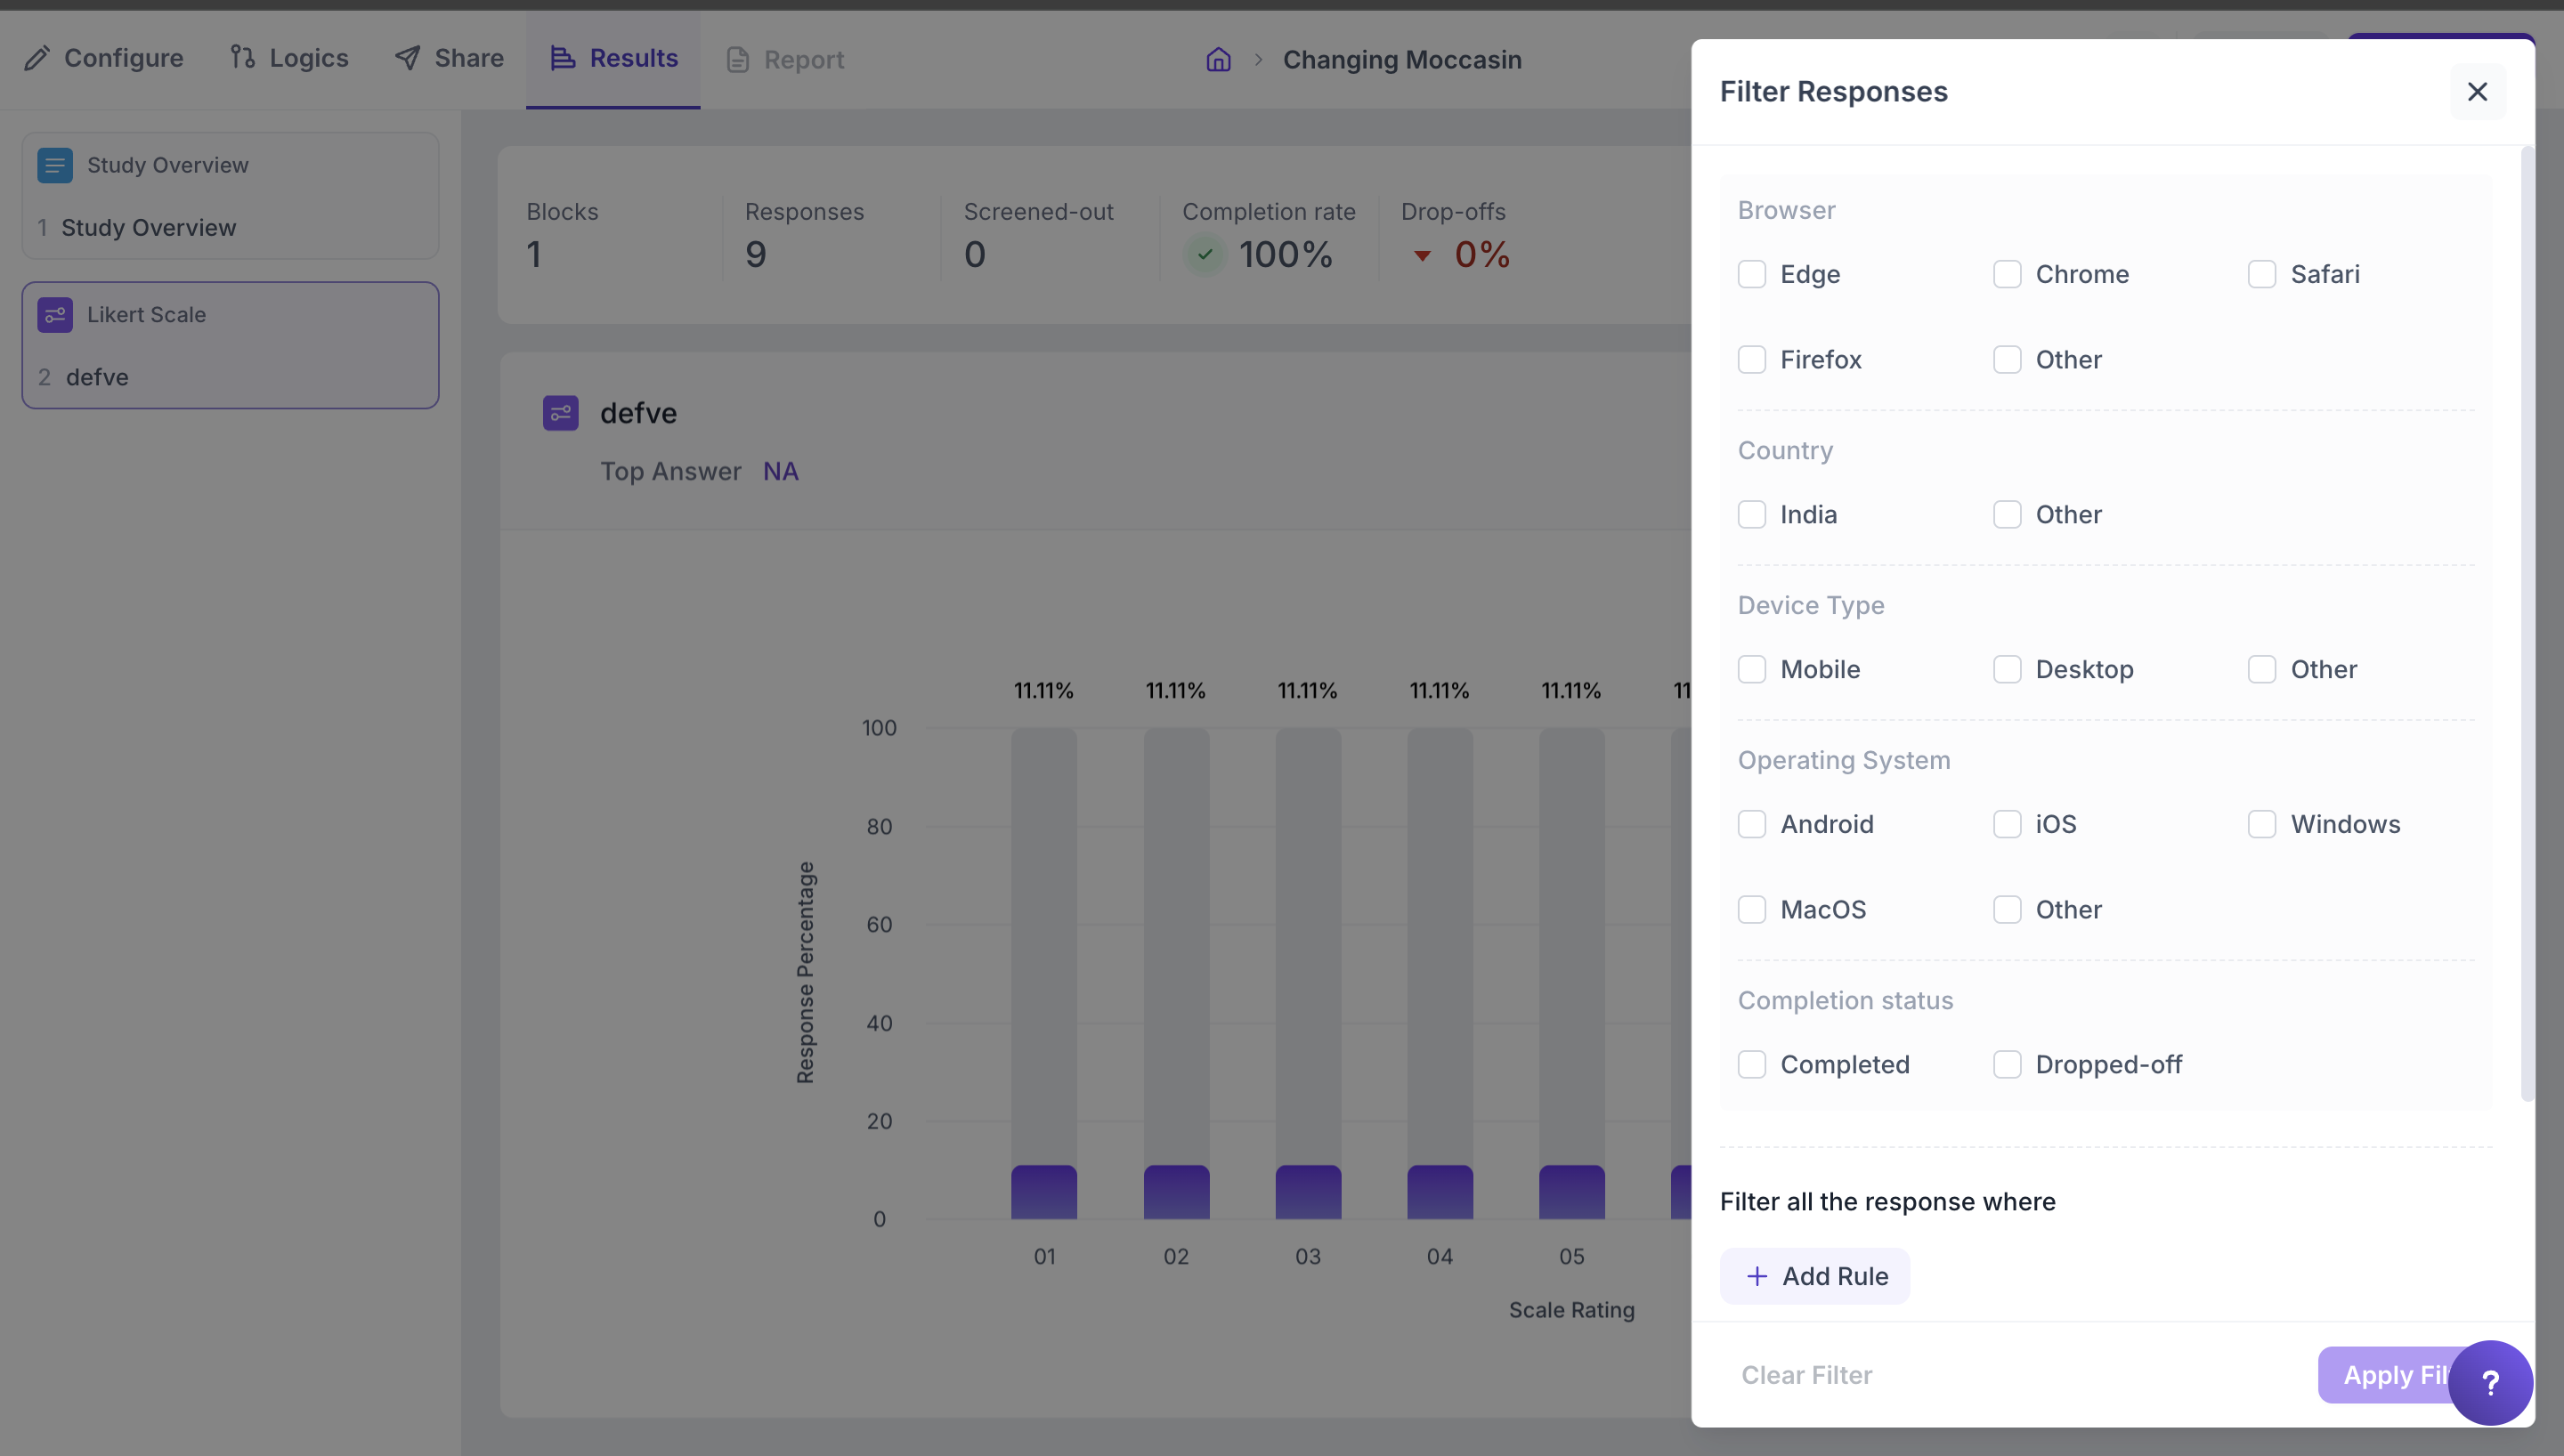
Step 7: You can also apply filters to view the responses of a particular set of respondents. To access the filter, click on the "Filter" icon on the top right corner of the page; here, you will find all the filters; you can select the respondents by selecting the checkboxes.