How to view Highlight Analytics?
Overview
Highlight analytics is a feature that allows you to gain valuable insights into the emotion and sentiment of the highlighted text. When you create a highlight, our platform analyzes the text and provides you with detailed emotional insights. These insights help you understand the tone of the conversation, giving you a better understanding of the overall sentiment of the meeting or video. In this article, we will guide you through the process of viewing highlights analytics in Decode:
Steps
Step 1: Once you login into your Decode account, you will be directed to the dashboard.
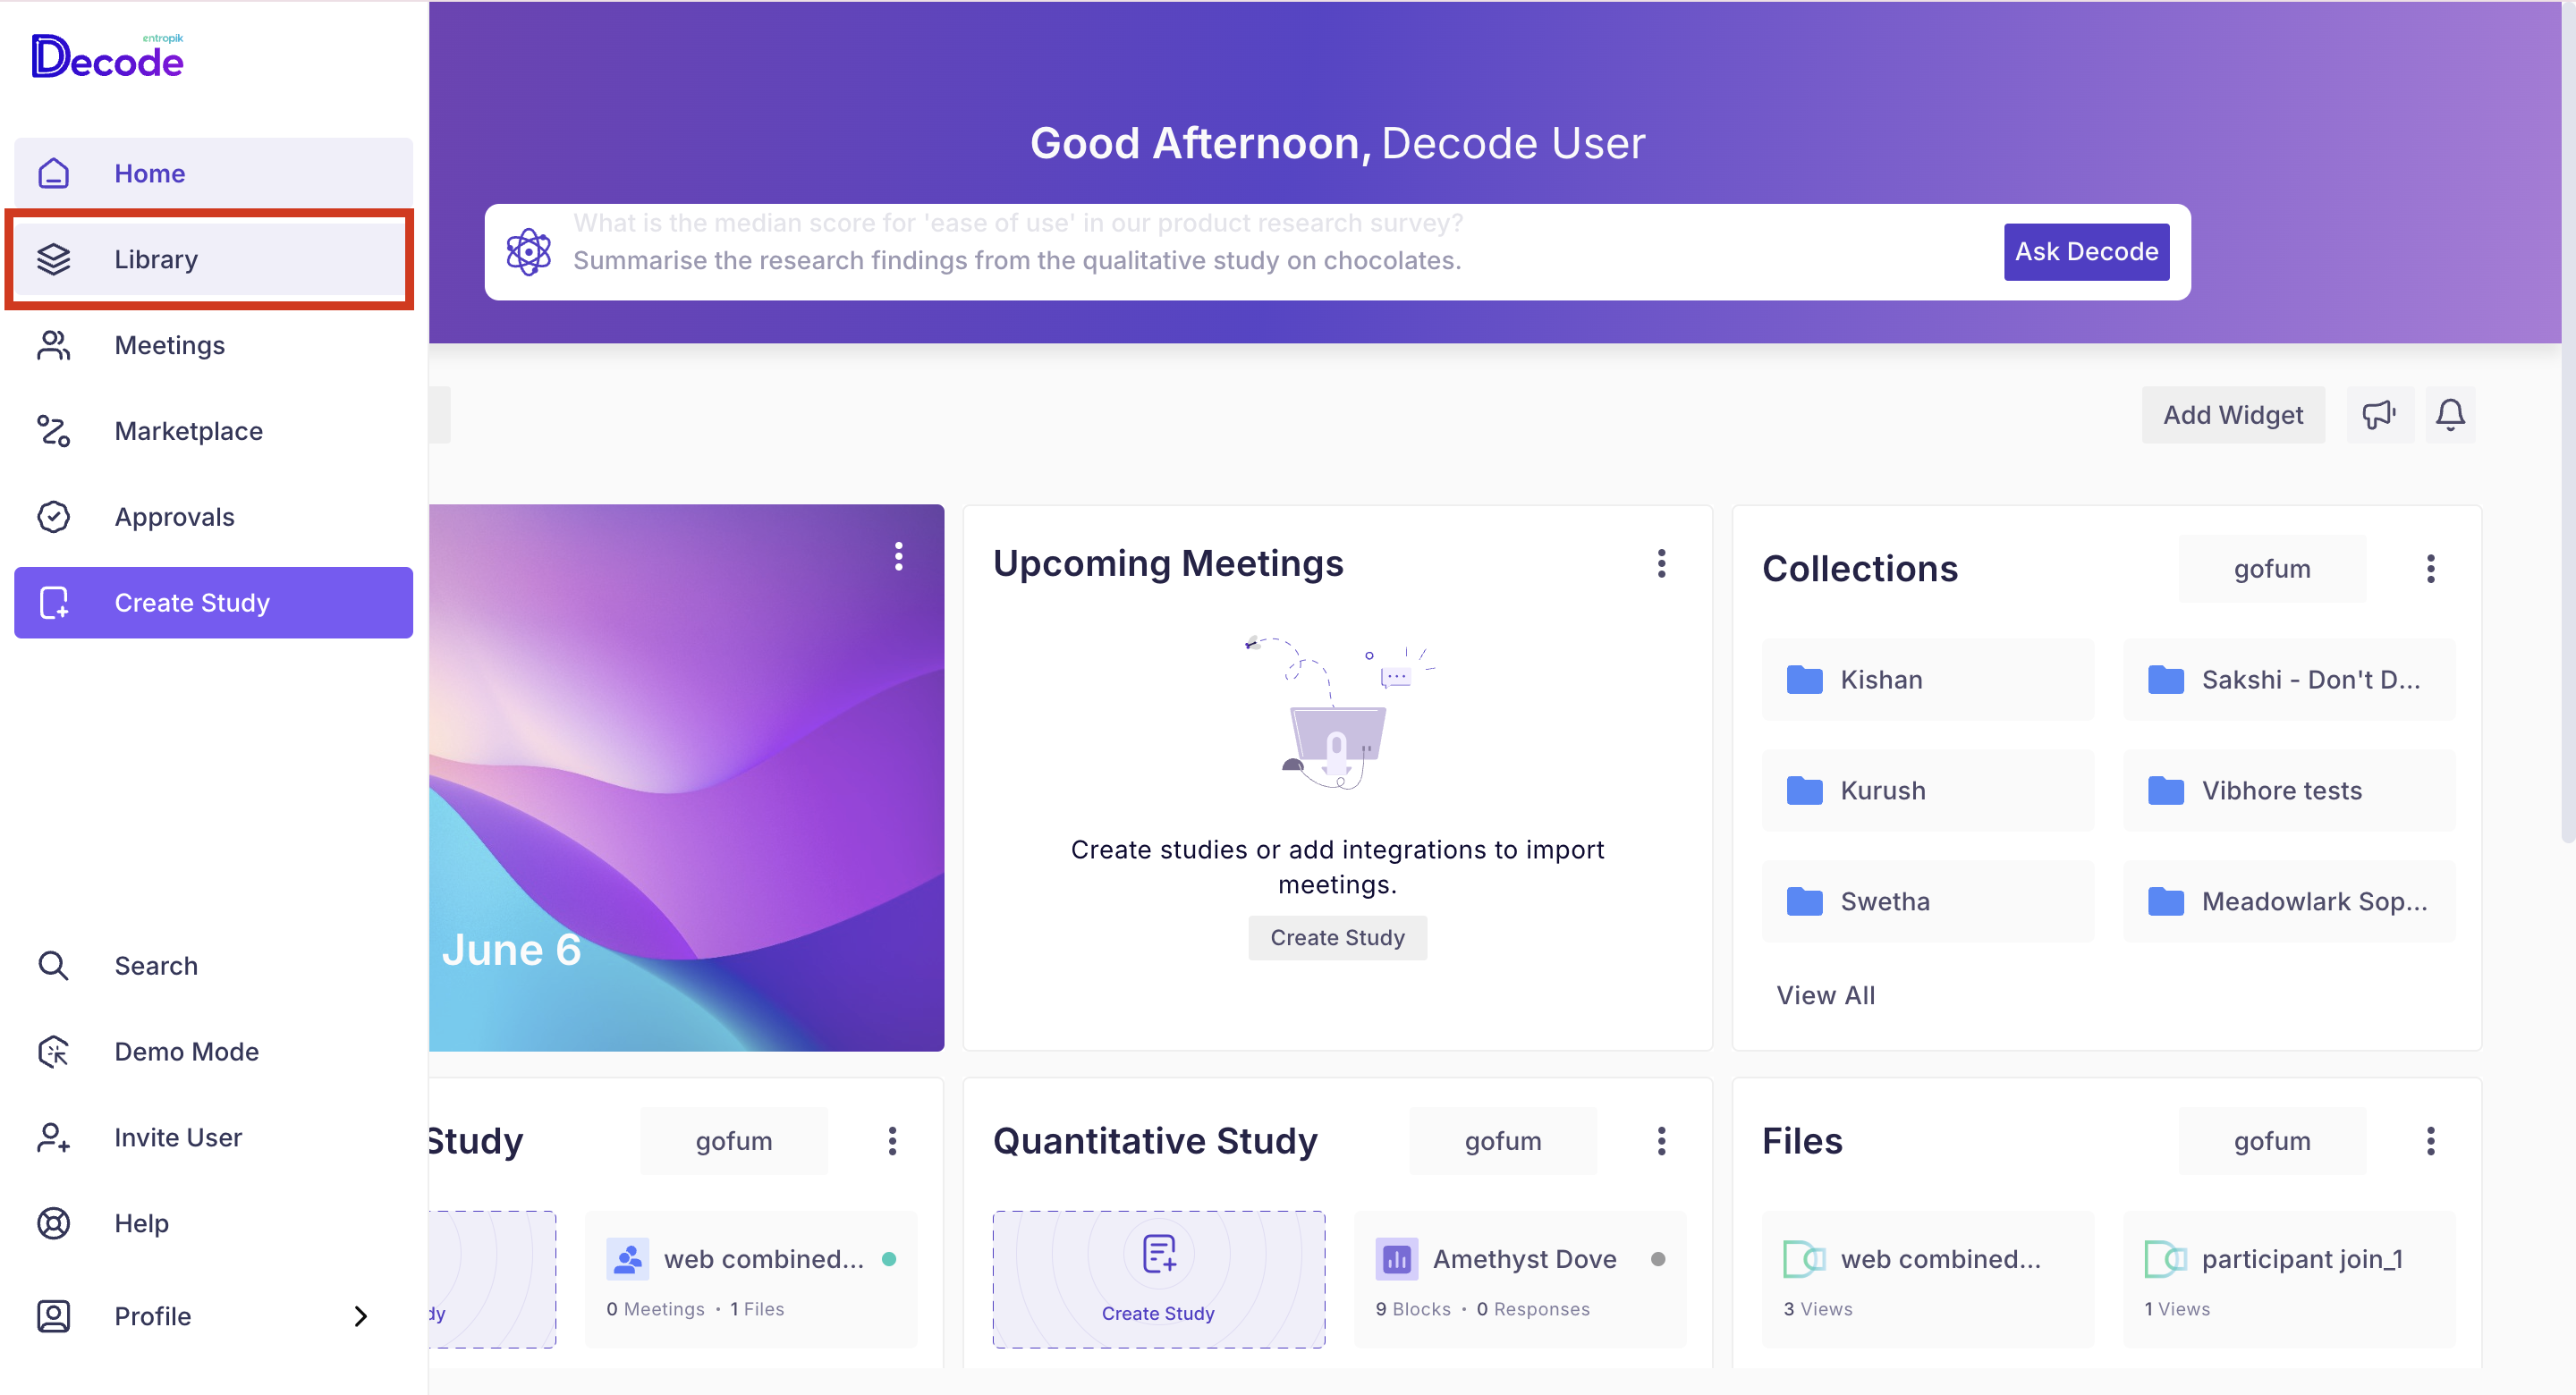
Step 2: From the navigation panel on the left-hand side, click on the "Library" icon.
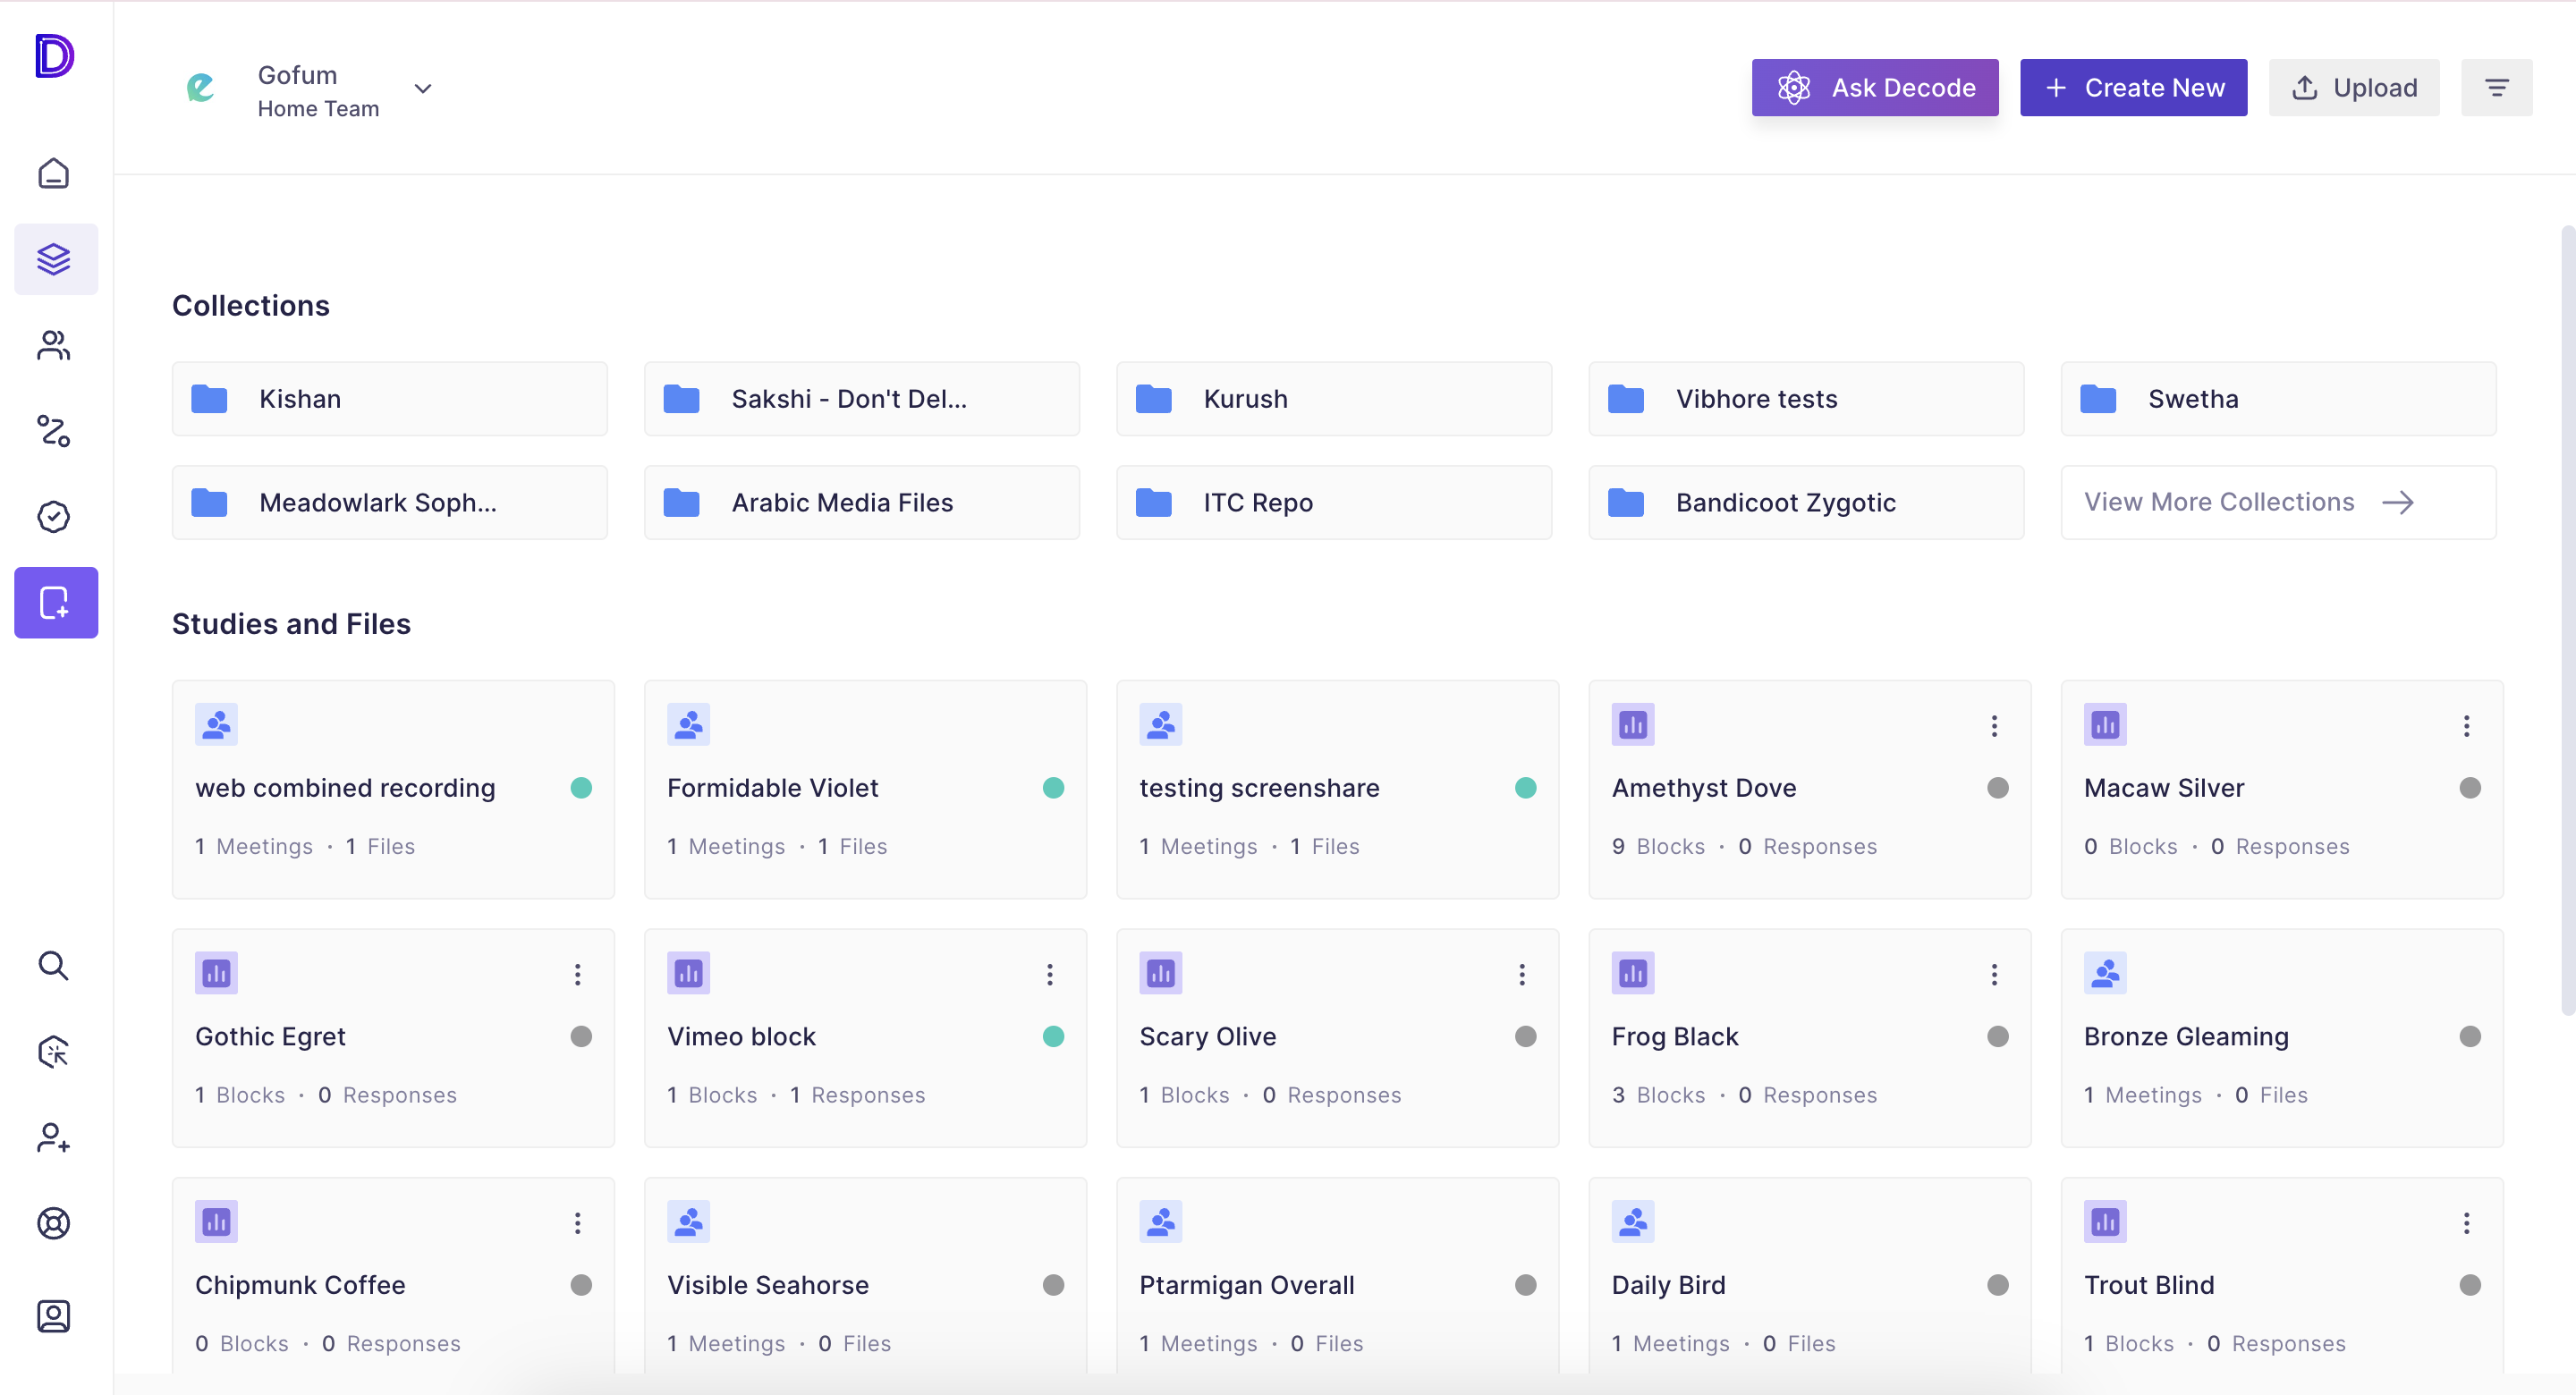
Step 3: You will see all the studies and media uploaded on this page. Click on any qualitative study or media to open it.
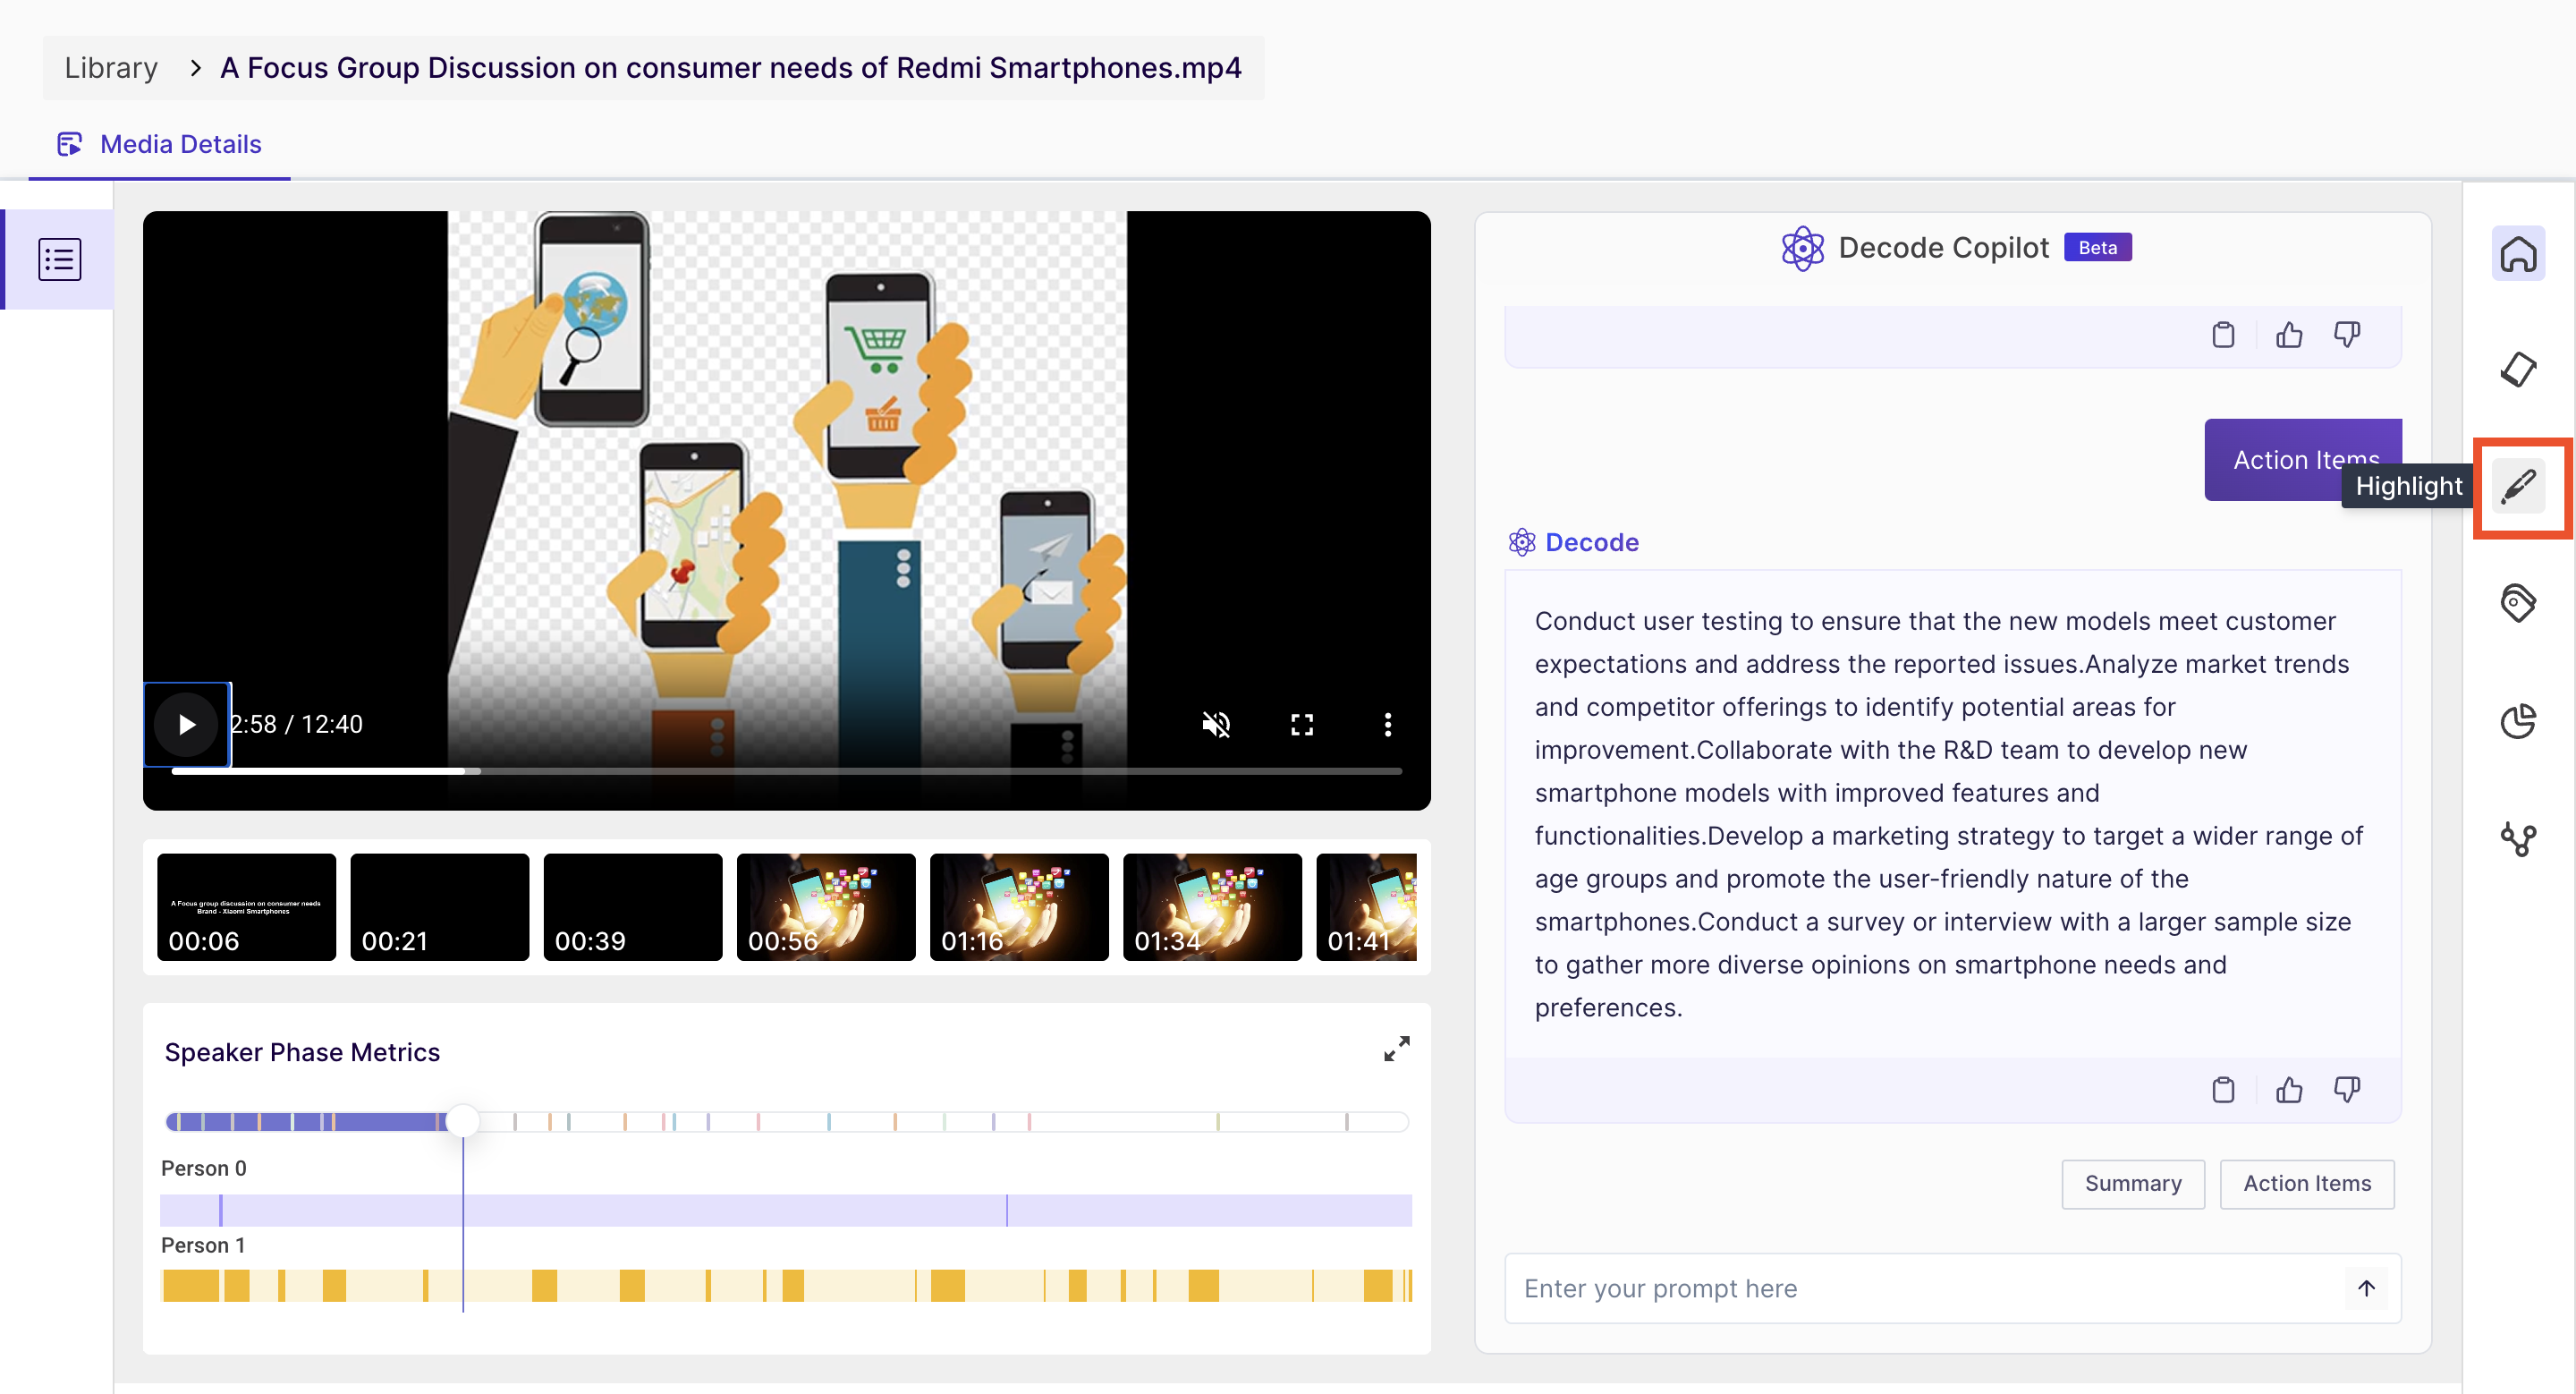
Step 4: Once you open the study or media, you will land on the Media detail page, where you will find the basic media details. To open the highlight page, click on the "Highlight" icon from the right navigation panel.
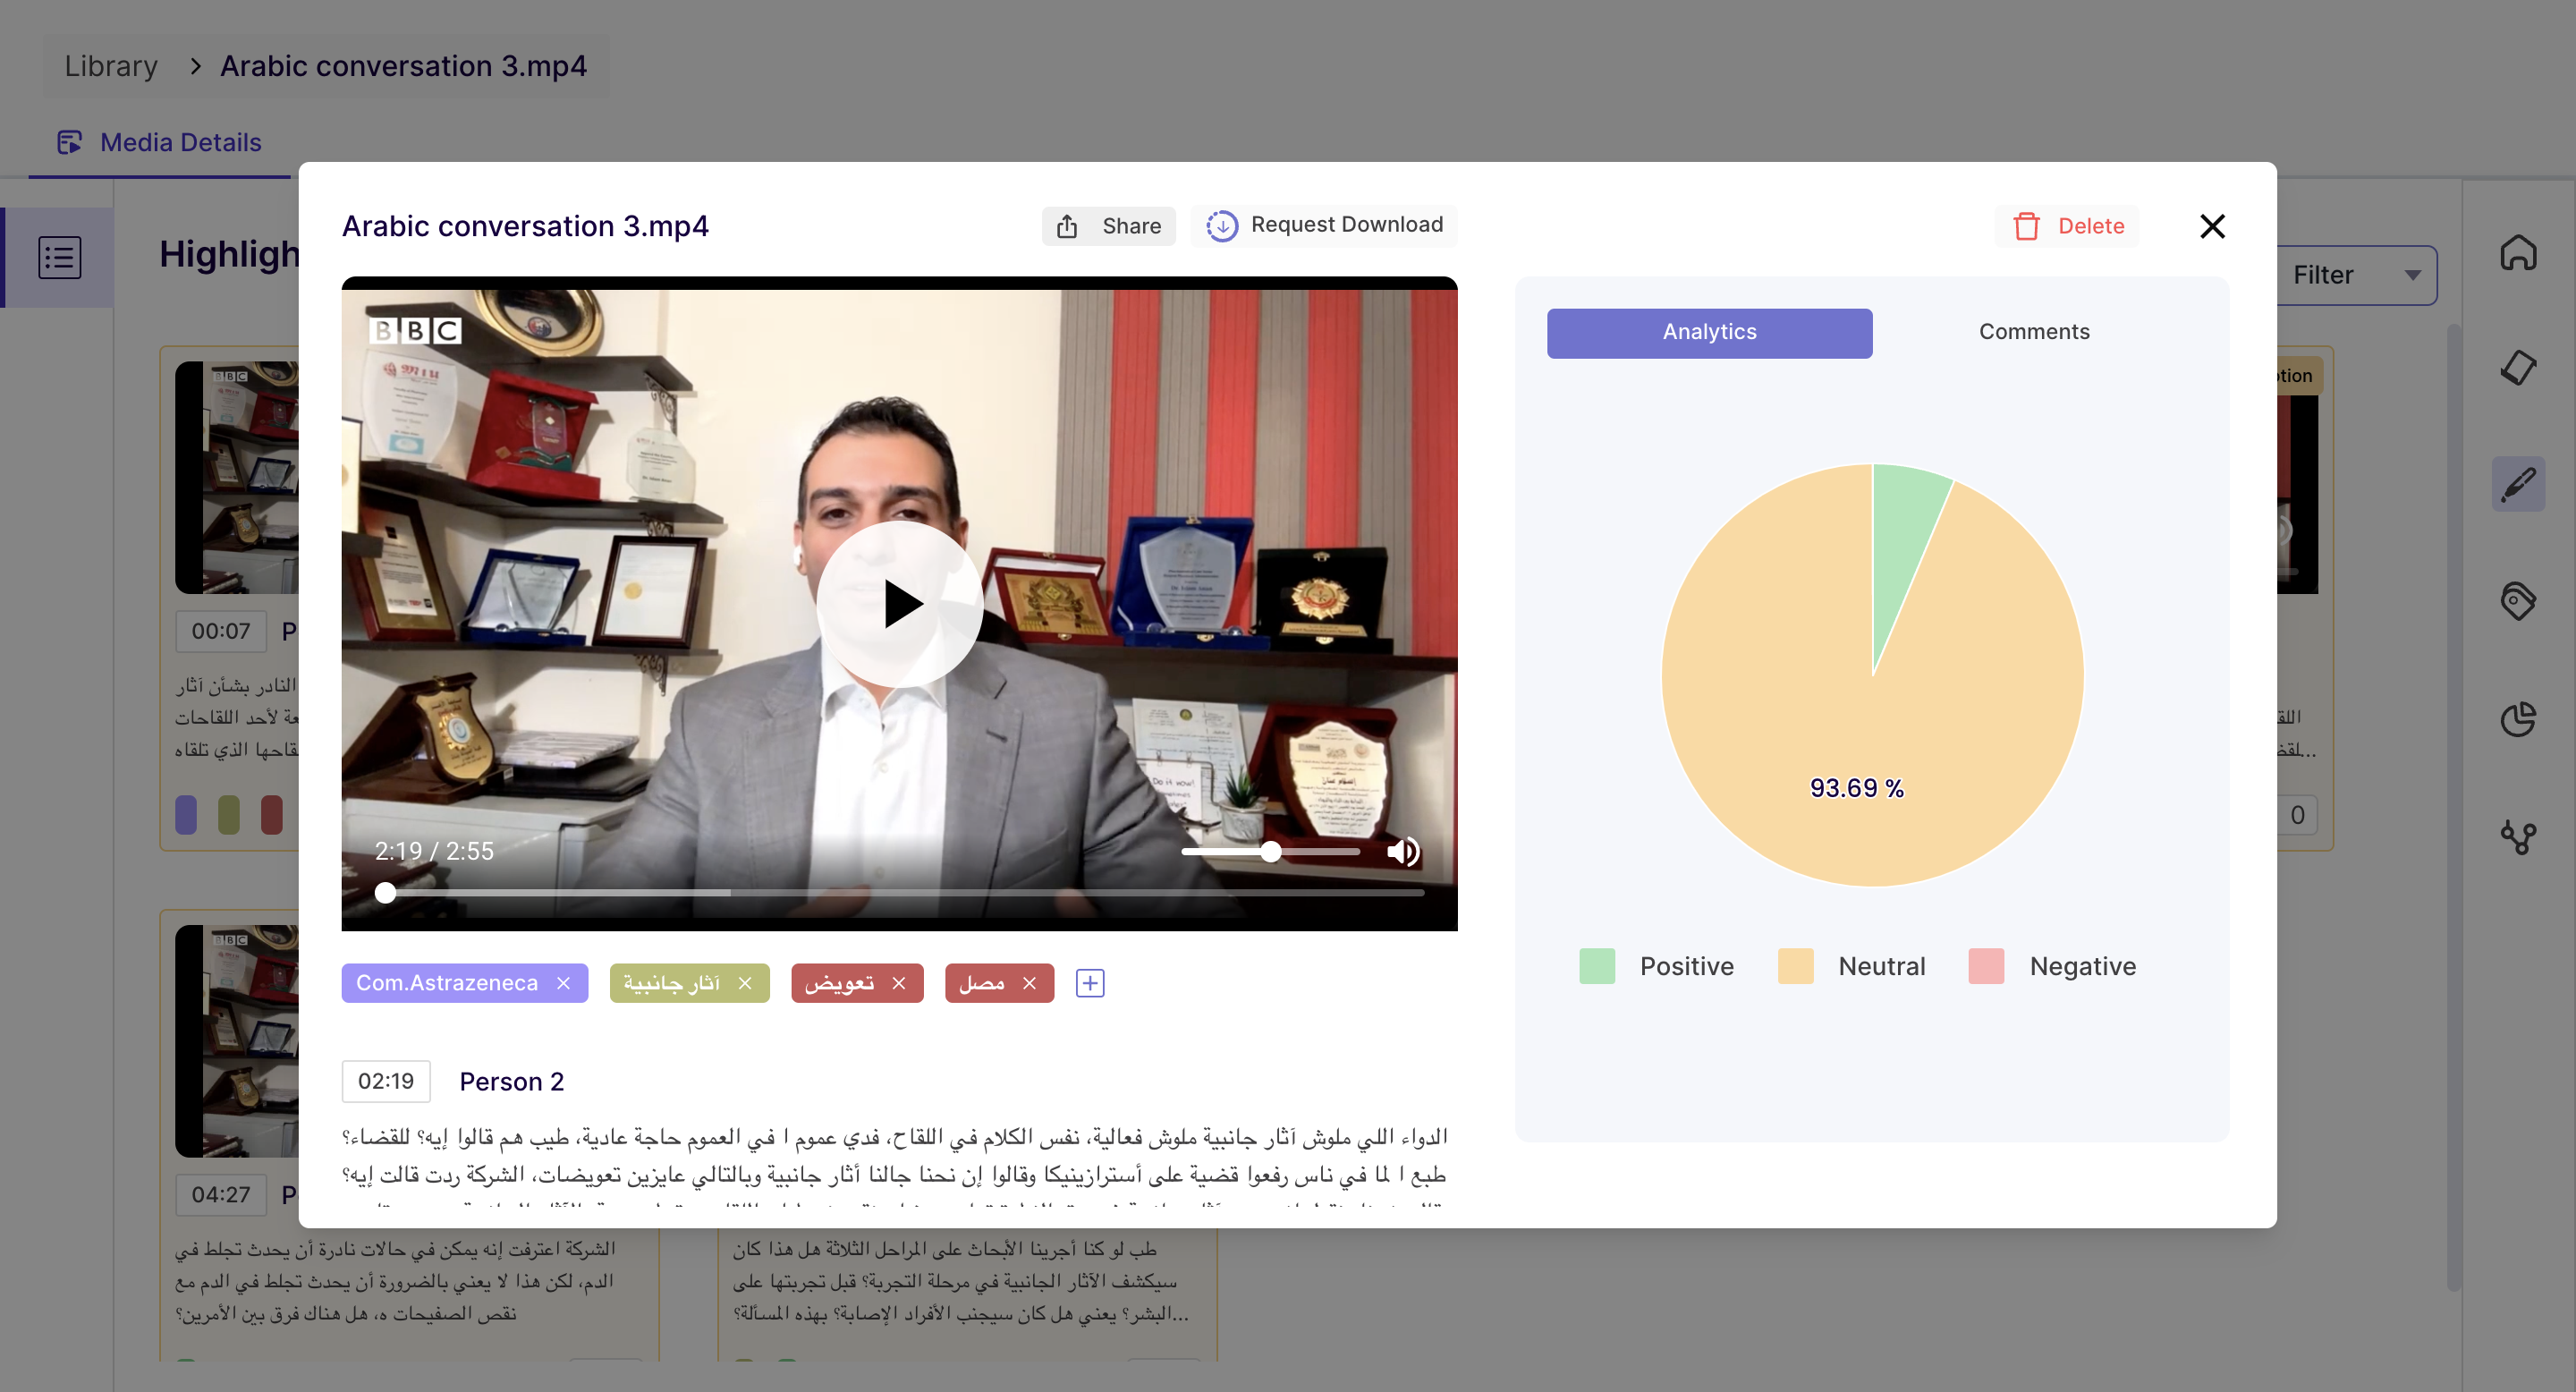
Step 5: On the highlight page, you will find all the highlights created in the transcripts as highlight cards. Click on the highlight card to open it.
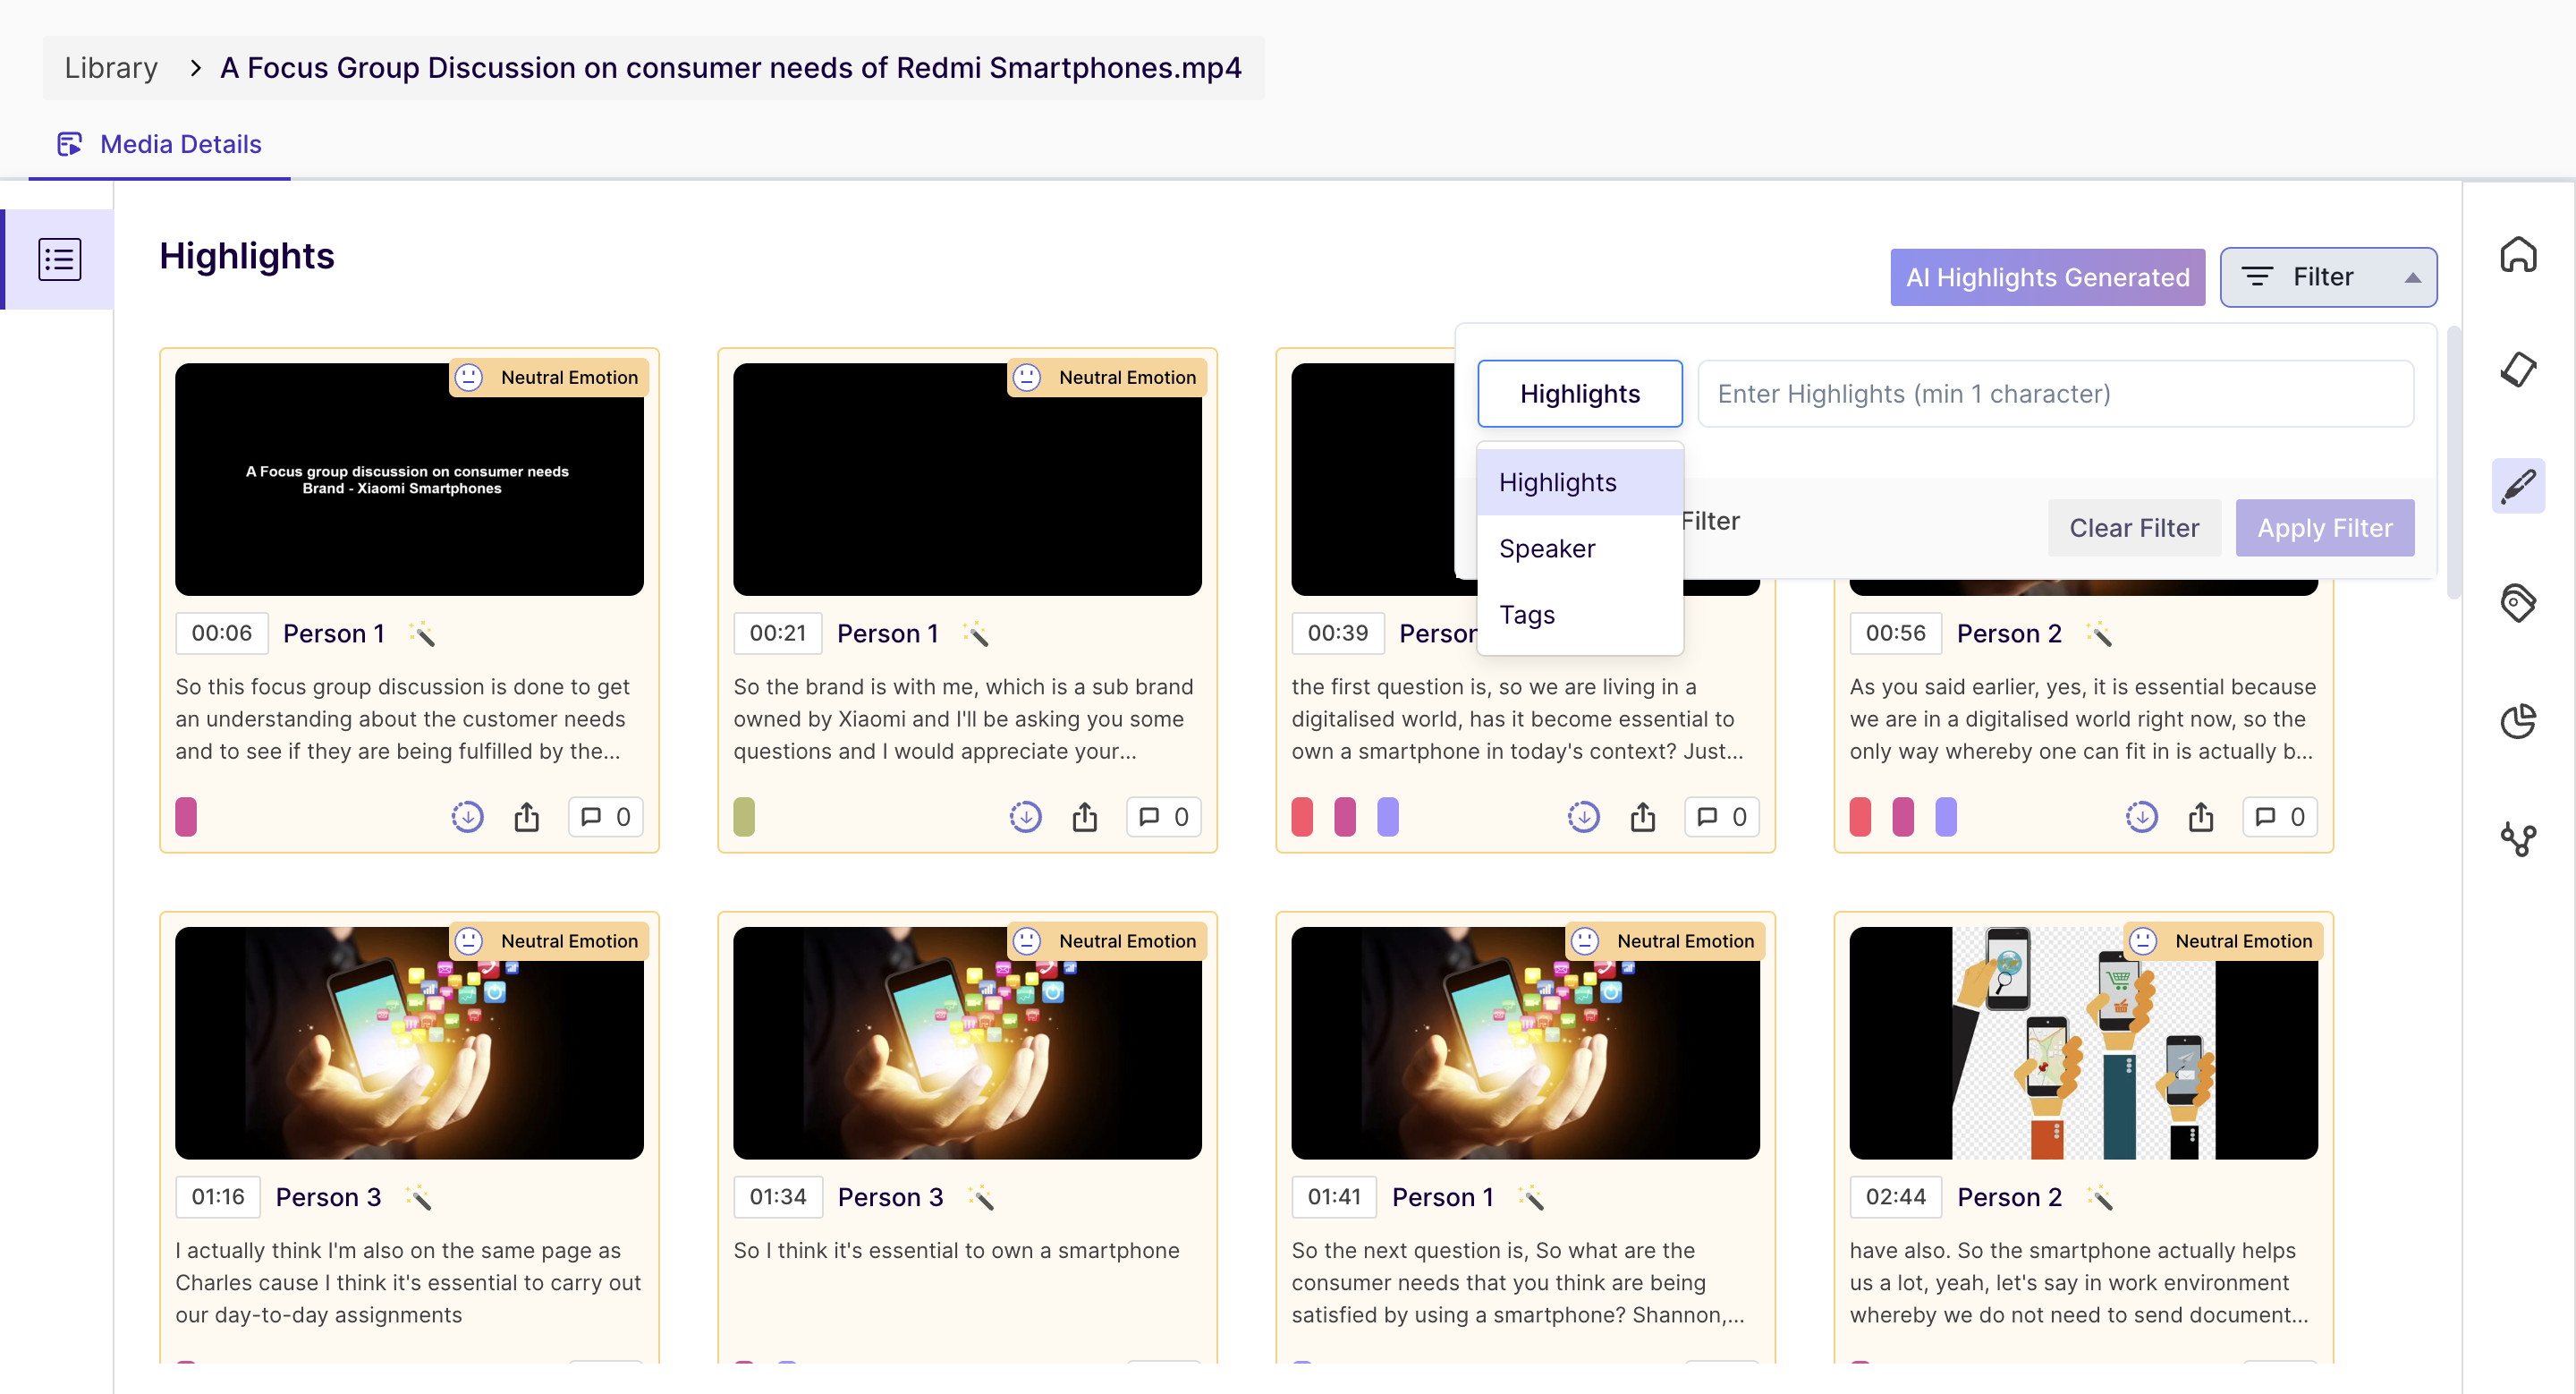
Bonus point: On every highlight card, you can view the dominant (most prominent) emotion.
Step 6: Once you open the card, you will a pie chart displaying the emotional analysis of the highlight. These scores are calculated from the transcript text (sentiment analysis) and the emotion displayed in that part of the video(emotion analysis).