Media Analytics Page on Decode
Overview
This article discusses the various charts and insights available in Decode's Analytics for each media. Analytics acts as a single source of truth about all your conversations. With a range of metrics available, including emotion AI metrics, speaker phase metrics, sentiment analysis, and text analysis, you can gain a deeper understanding of your research data and draw meaningful insights from it.
The Analytics tab on the Media page provides complete data about the key metrics from the uploaded conversation. Users can traverse to the Analytics tab by selecting the Media and navigating to the Analytics tab as shown below.
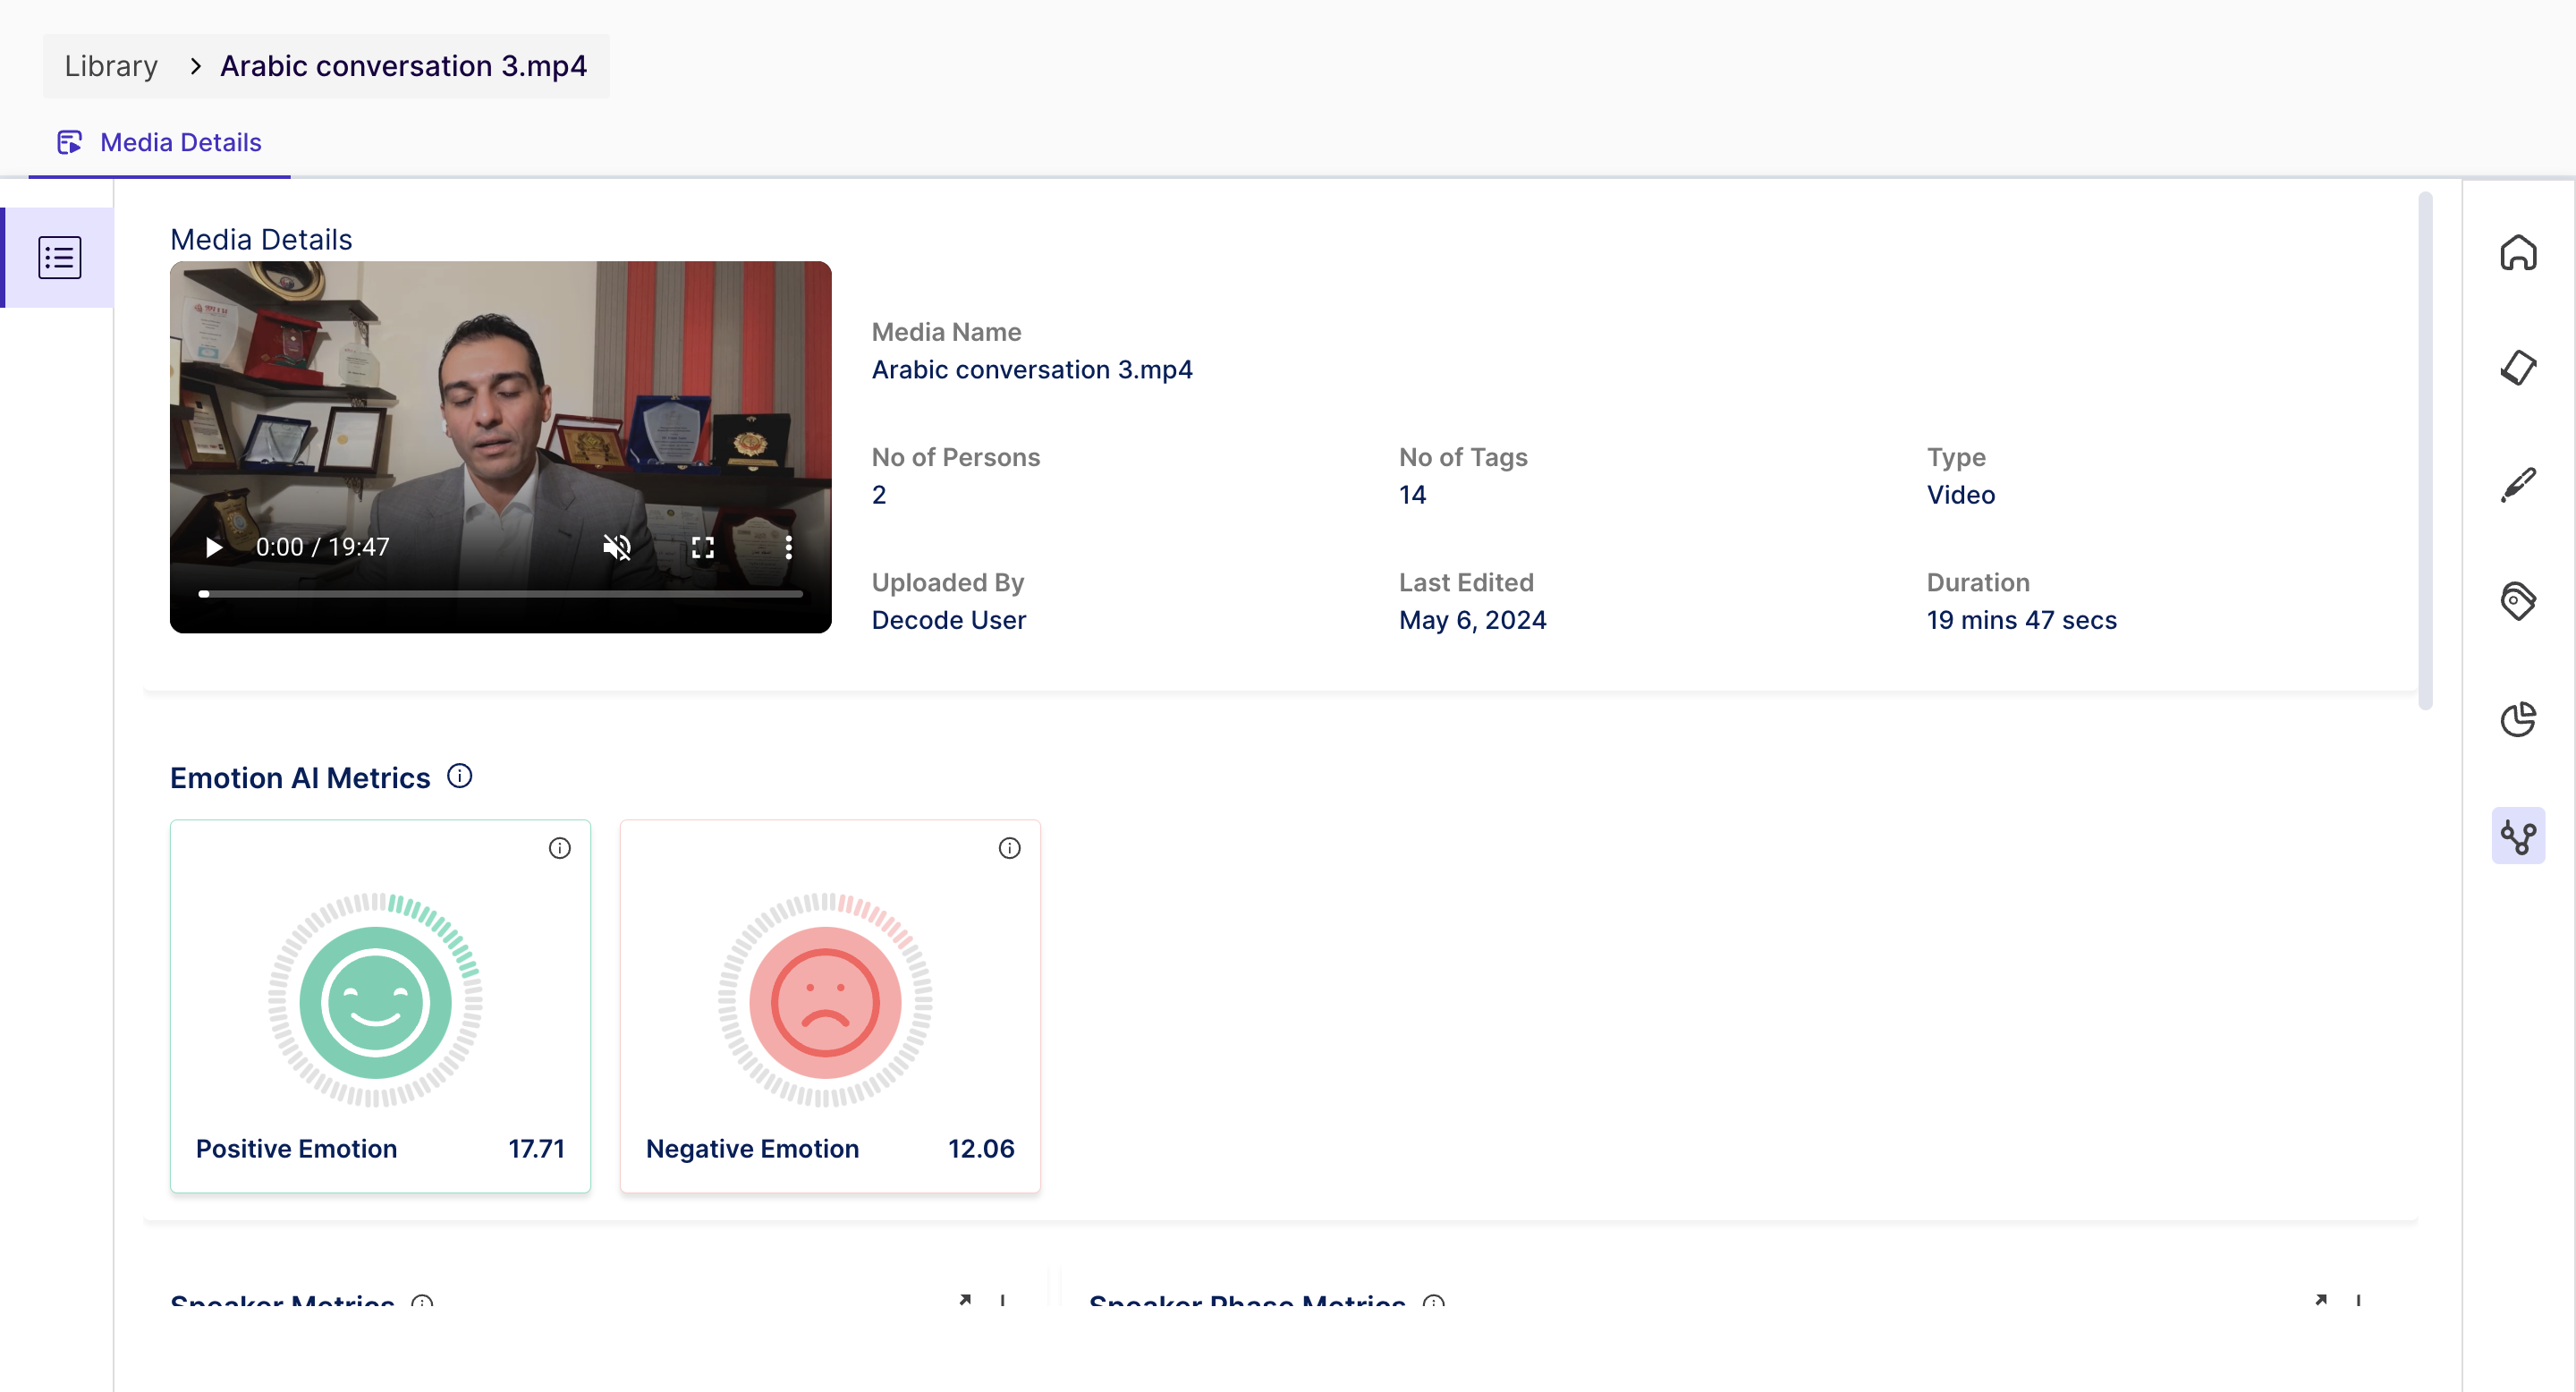
- Users can play the uploaded media for quick reference to the discussion. The Media Name and details about the Media are presented in a summary view next to the Media.
Metrics
- Emotion AI Metrics: The overall distribution of emotion in the discussion is obtained and presented using easy-to-read charts, as shown above. Below, emotion metrics are identified from the conversation and can be used to discover the participants' emotional states.
- Positive Emotions: the platform uses a combination of two emotions - Happy and Surprise - to determine whether the user felt happy while watching a particular video.
- Negative Emotions: the platform is using a combination of three emotions - Anger, Disgust, and Contempt - to determine whether the user felt sad while watching a particular video.
Note: Fear and sadness are not included in negative emotions, as these emotions need to be considered in the context of the media and can be shown as standalone emotions.
Followed by the Emotion AI Metrics, Users can find details about the participation of the speakers in the overall discussion.
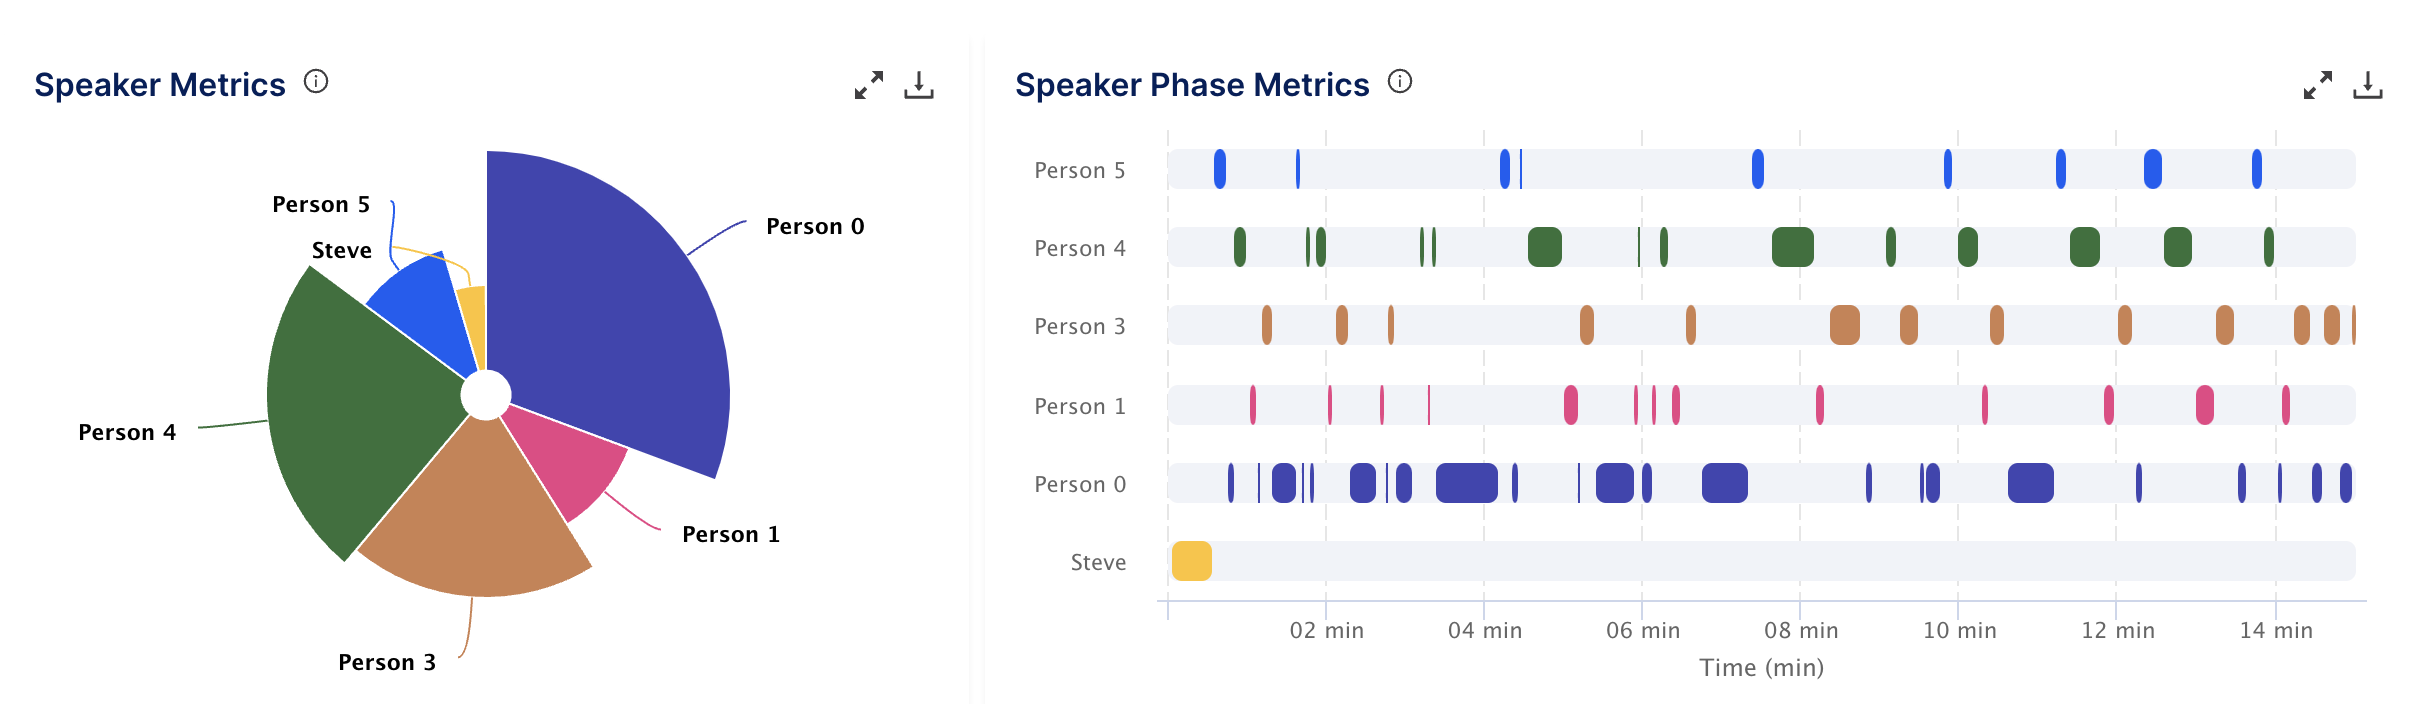
- Speaker Metrics and Speaker Phase Metrics provide information on the percentage of involvement from each participant in the conversation and the sequence of dialogue change between them.
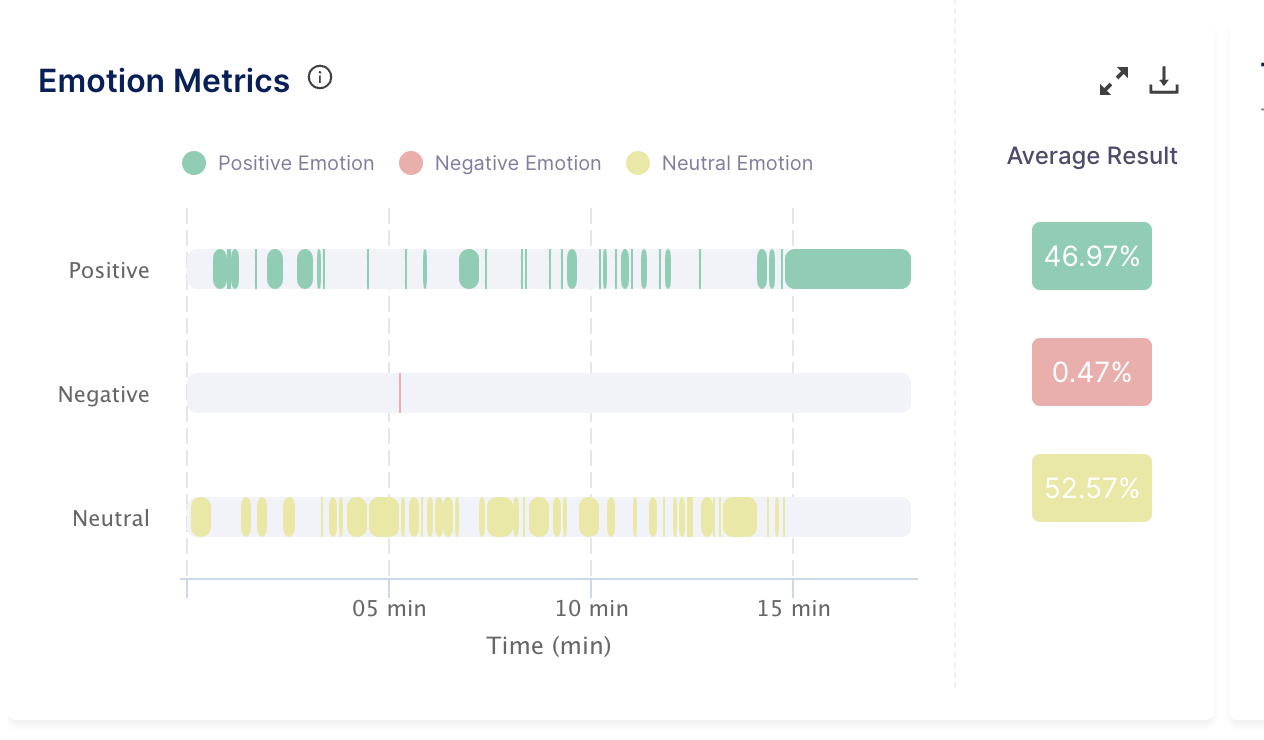
- Emotion Metrics: This graph showcases the overall emotion of the media at a particular time. These emotions are calculated using facial coding data, voice tonality data, and text sentiment analysis. This consolidation provides a more comprehensive and simplified view of the overall sentiment expressed in the media content.
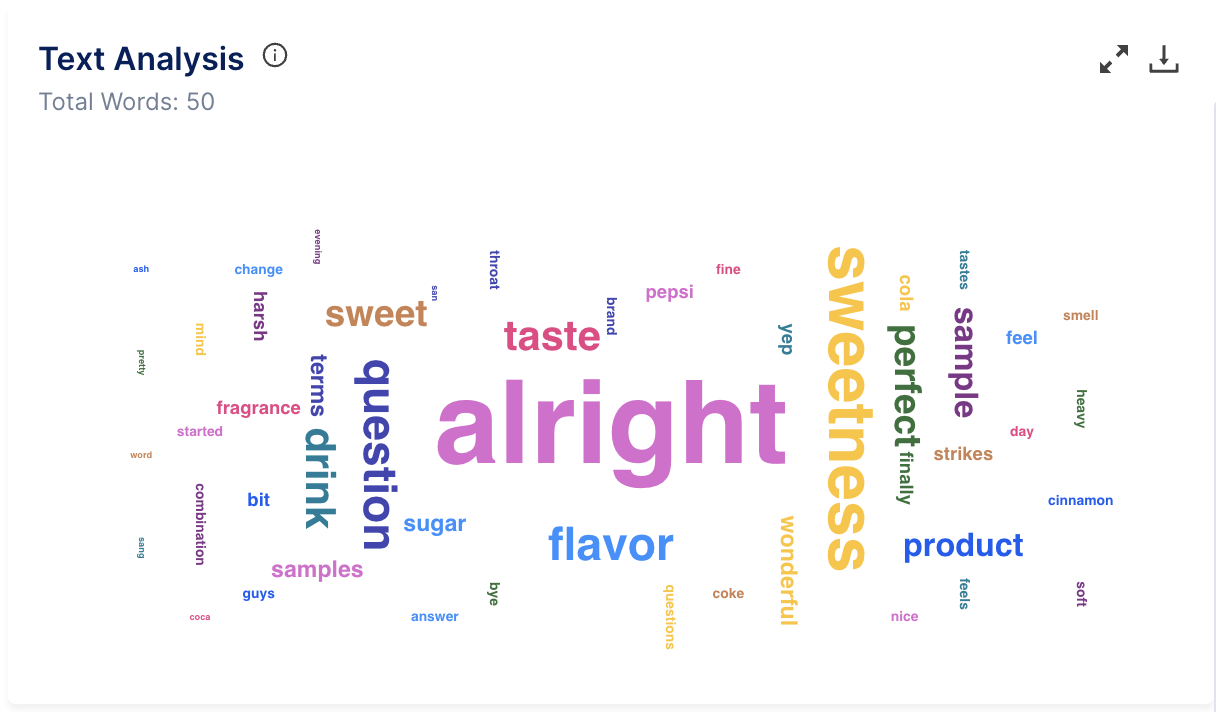
- Text Analysis provides a word cloud on the frequently used words.