Media/Recording Analytics in Decode
Overview
Decode is a powerful tool that helps businesses improve their meetings by unlocking valuable insights and data. With its advanced technology, Decode captures a transcript of the uploaded media/Recording and provides features like translation into 100+ languages, split, merge edit them. Users can then review the transcript and gain valuable insights into the media, such as the most frequently used words, sentiment analysis, and action items. In addition, Decode uses facial coding and eye tracking to capture participants' emotional and visual responses, providing users with a detailed analysis of the emotion displayed during the meeting, engagement and attention and other analytics needed to make informed decisions. In this article, we will walk you through the result page of analytics of the media and teach you how you can use different features:
- To access the uploaded media, open it from the Decode Library. Once you open a Media, you will land on the Media Detail Page.
- To access your meeting recordings, go to the study and navigate to the recording page, you will find the meeting recordings as well as the uploaded recordings in the study.
1. Media Detail Page
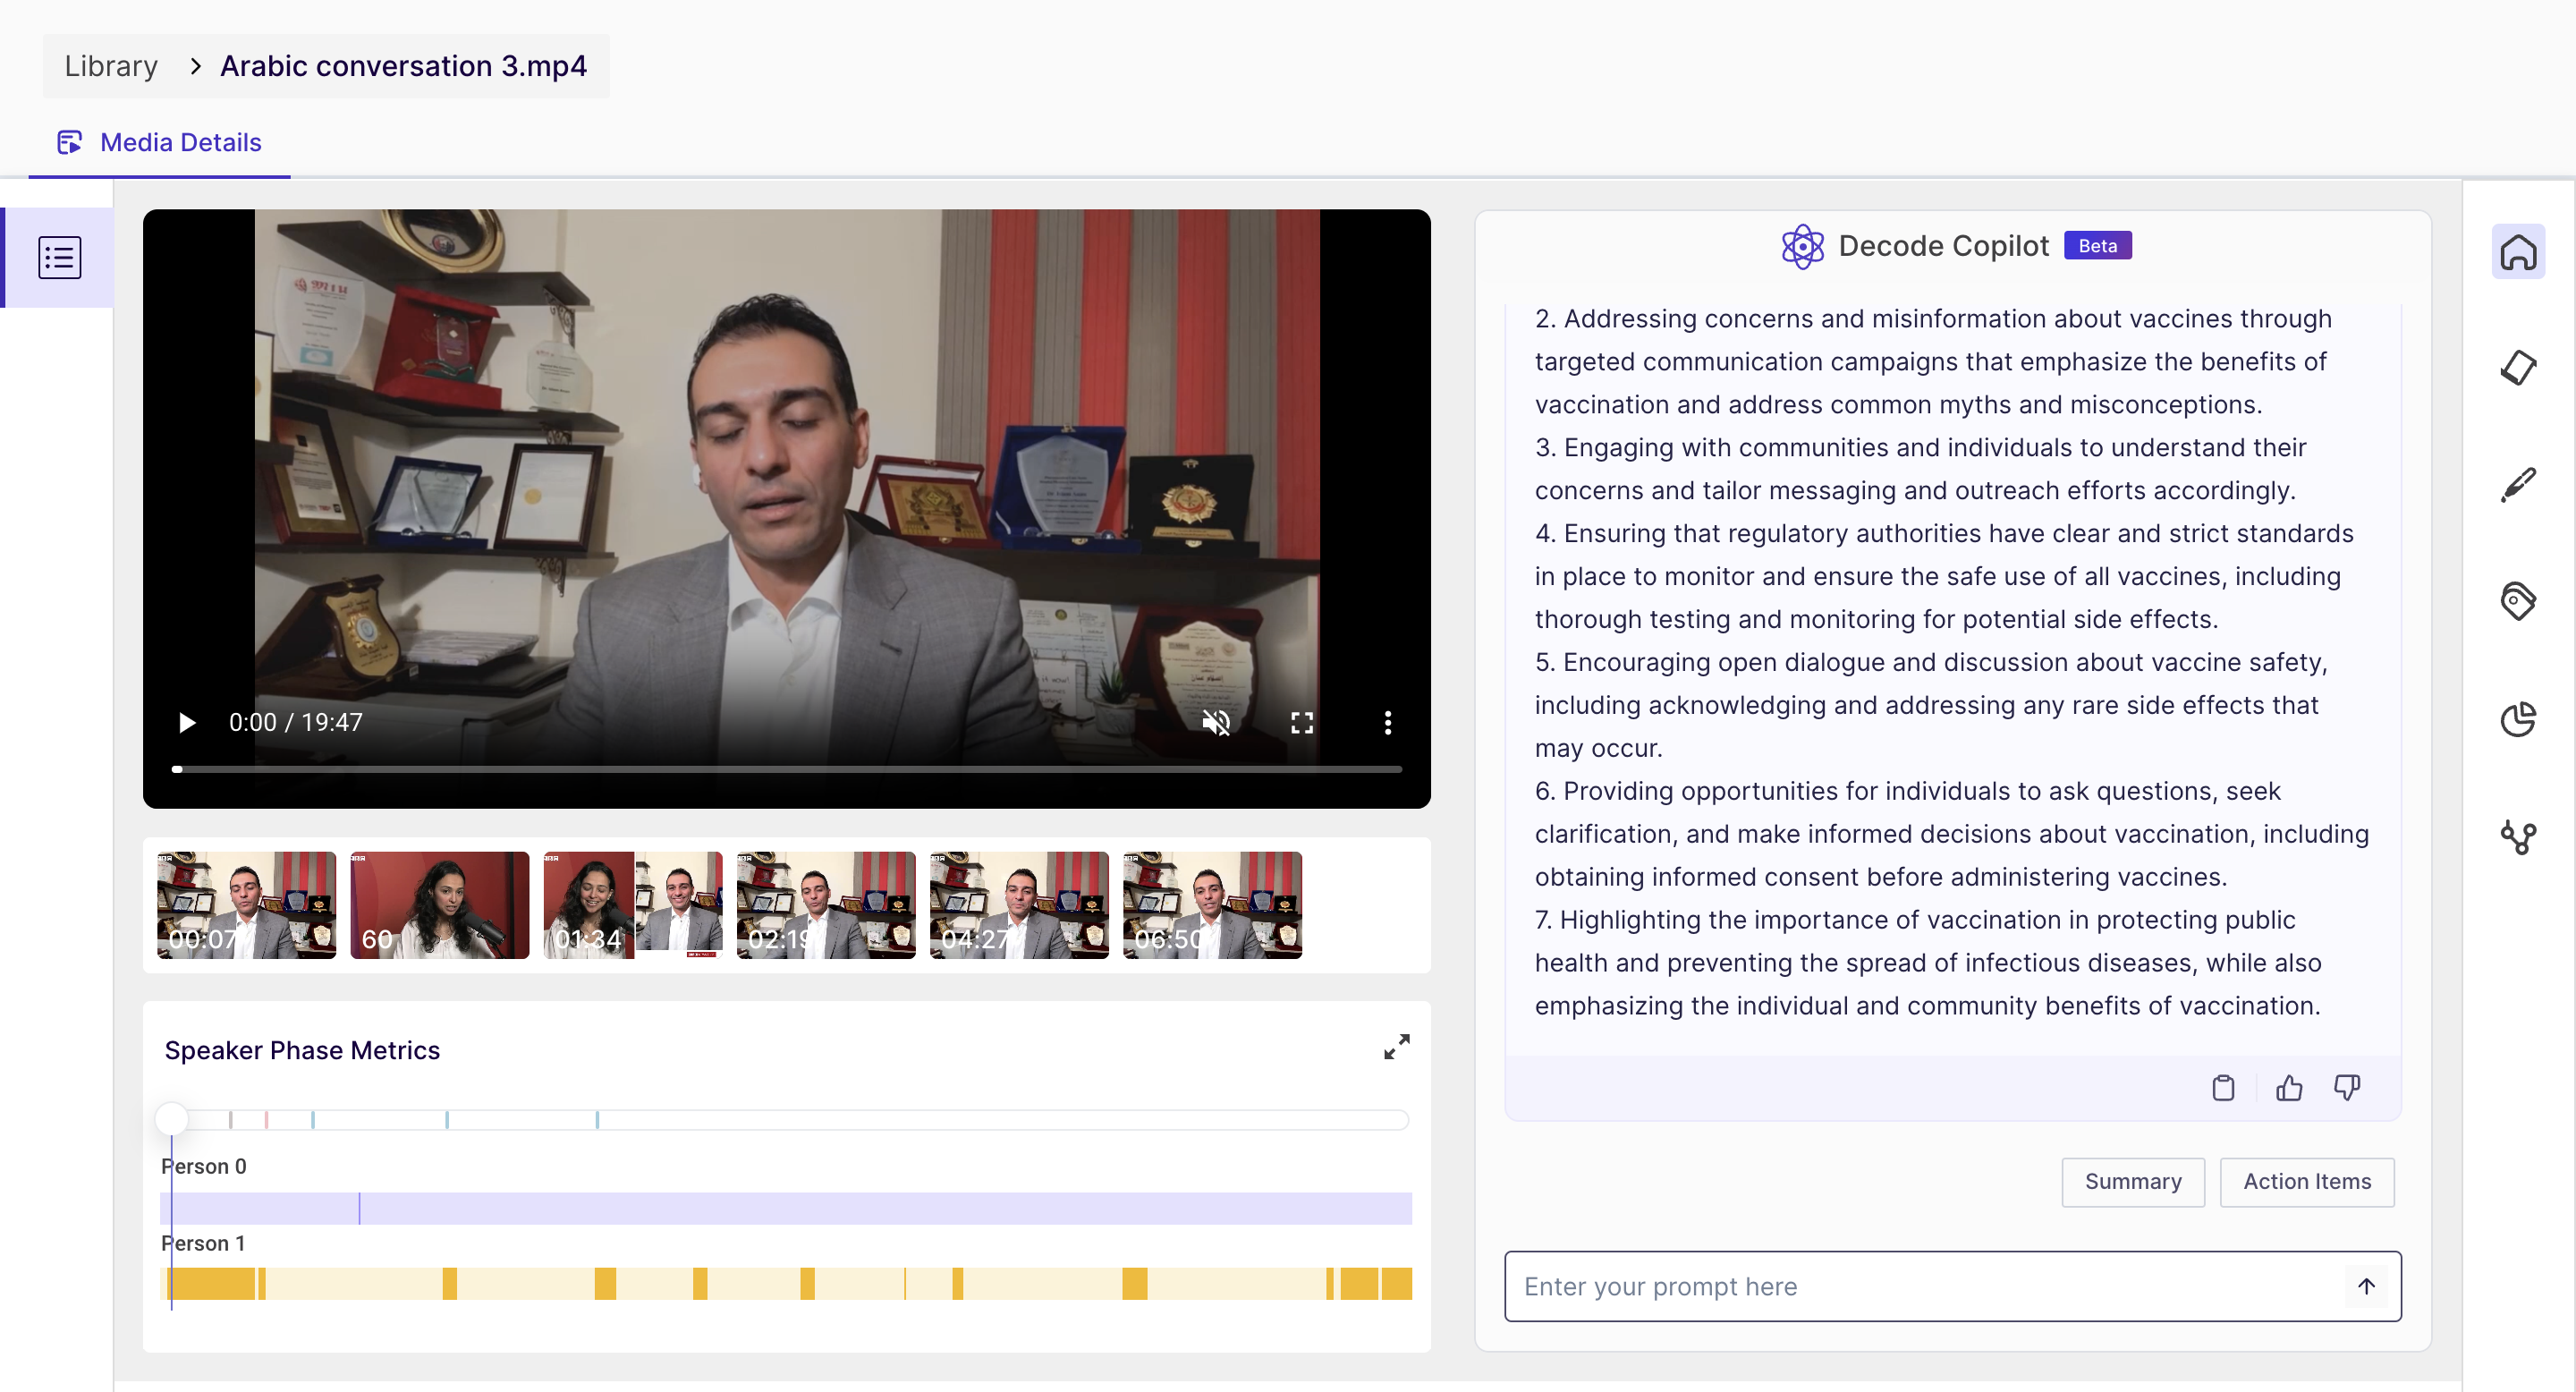
On this page, you will find the following details:
- The media player is where you can play the video.
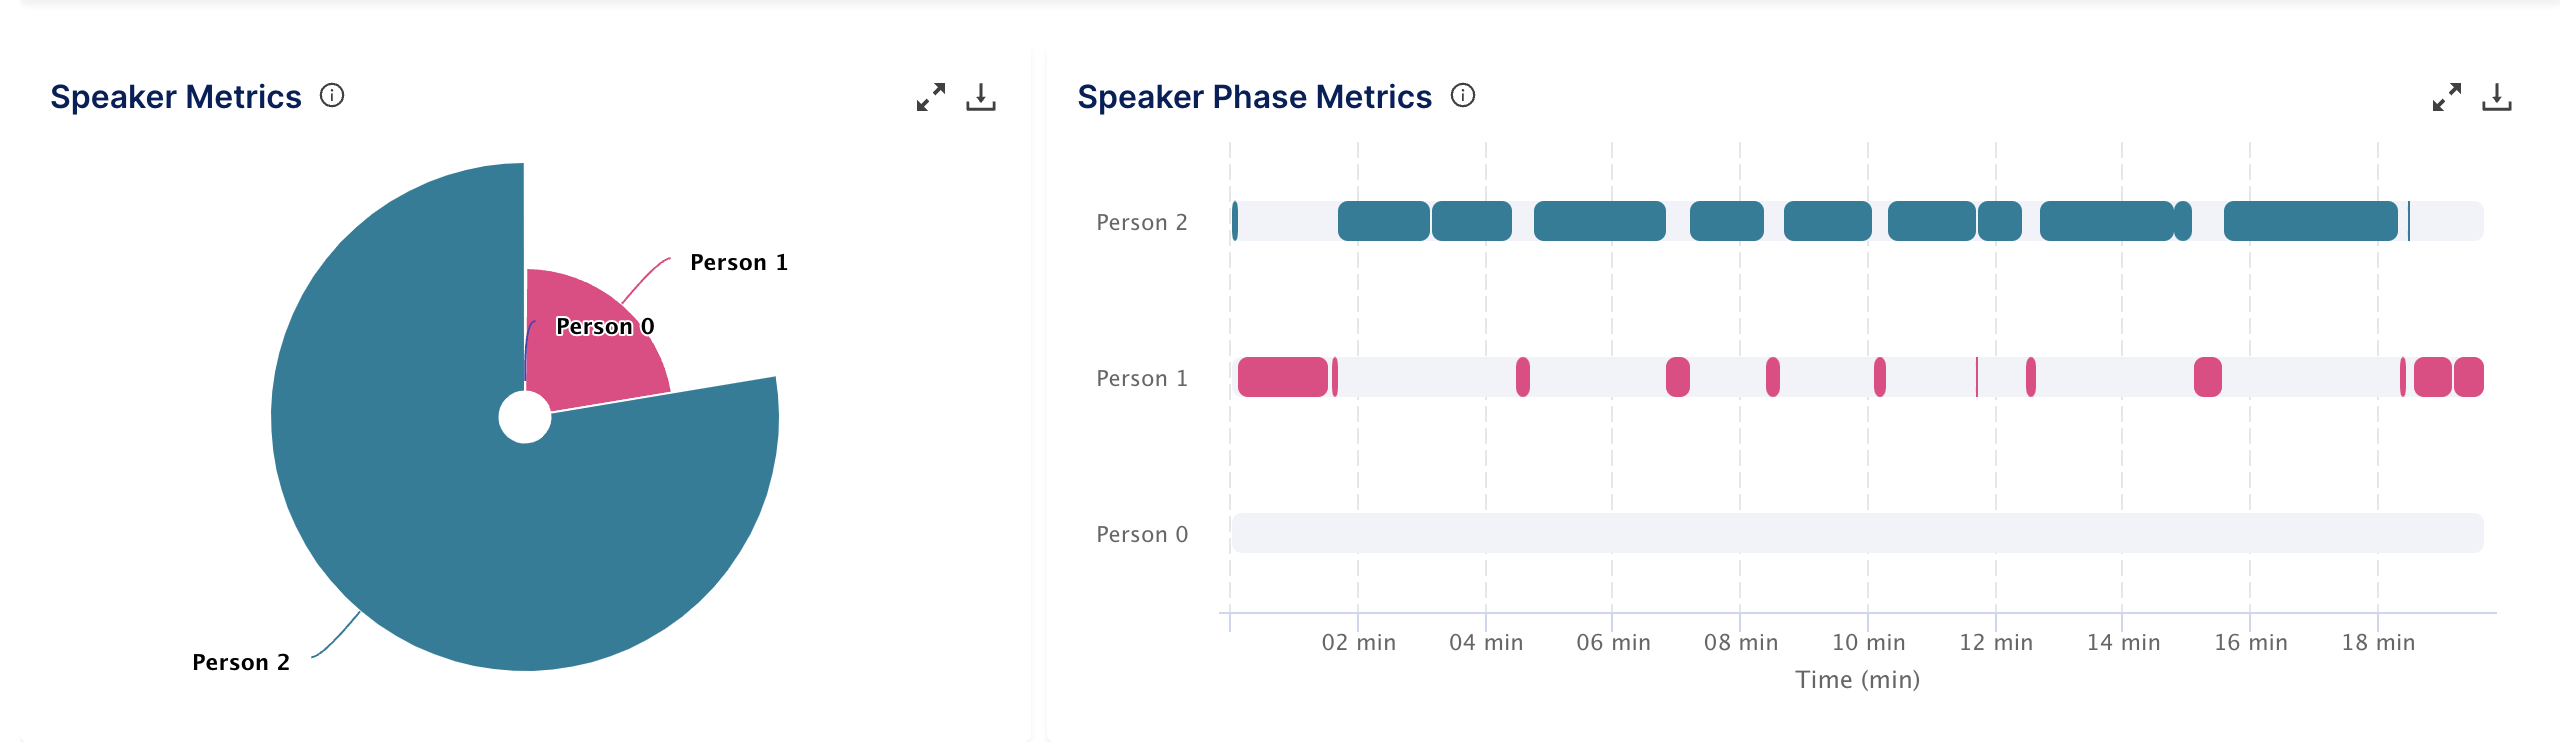
- The speaker phase metrics - The speaker phase metrics show the time duration of each speaker's speech in the audio or video file, represented by a bar. It also displayed the overall percentage of contribution of the participants in the conversation.
- Decode Copilot(Beta) - We have integrated Chat GPT with our platform to provide a summary of your media/recordings. This feature generates a concise summary/action items of the recording content, eliminating the need for manual scanning and specific prompts can be thrown for deeper analysis.
2. Transcripts page
What is Transcription?
Transcription is the process of converting spoken words into written text. This can be done by a person or by a computer program. Transcription is often used in the fields of media, medicine, and law to create written records of interviews, speeches, and other audio sources.
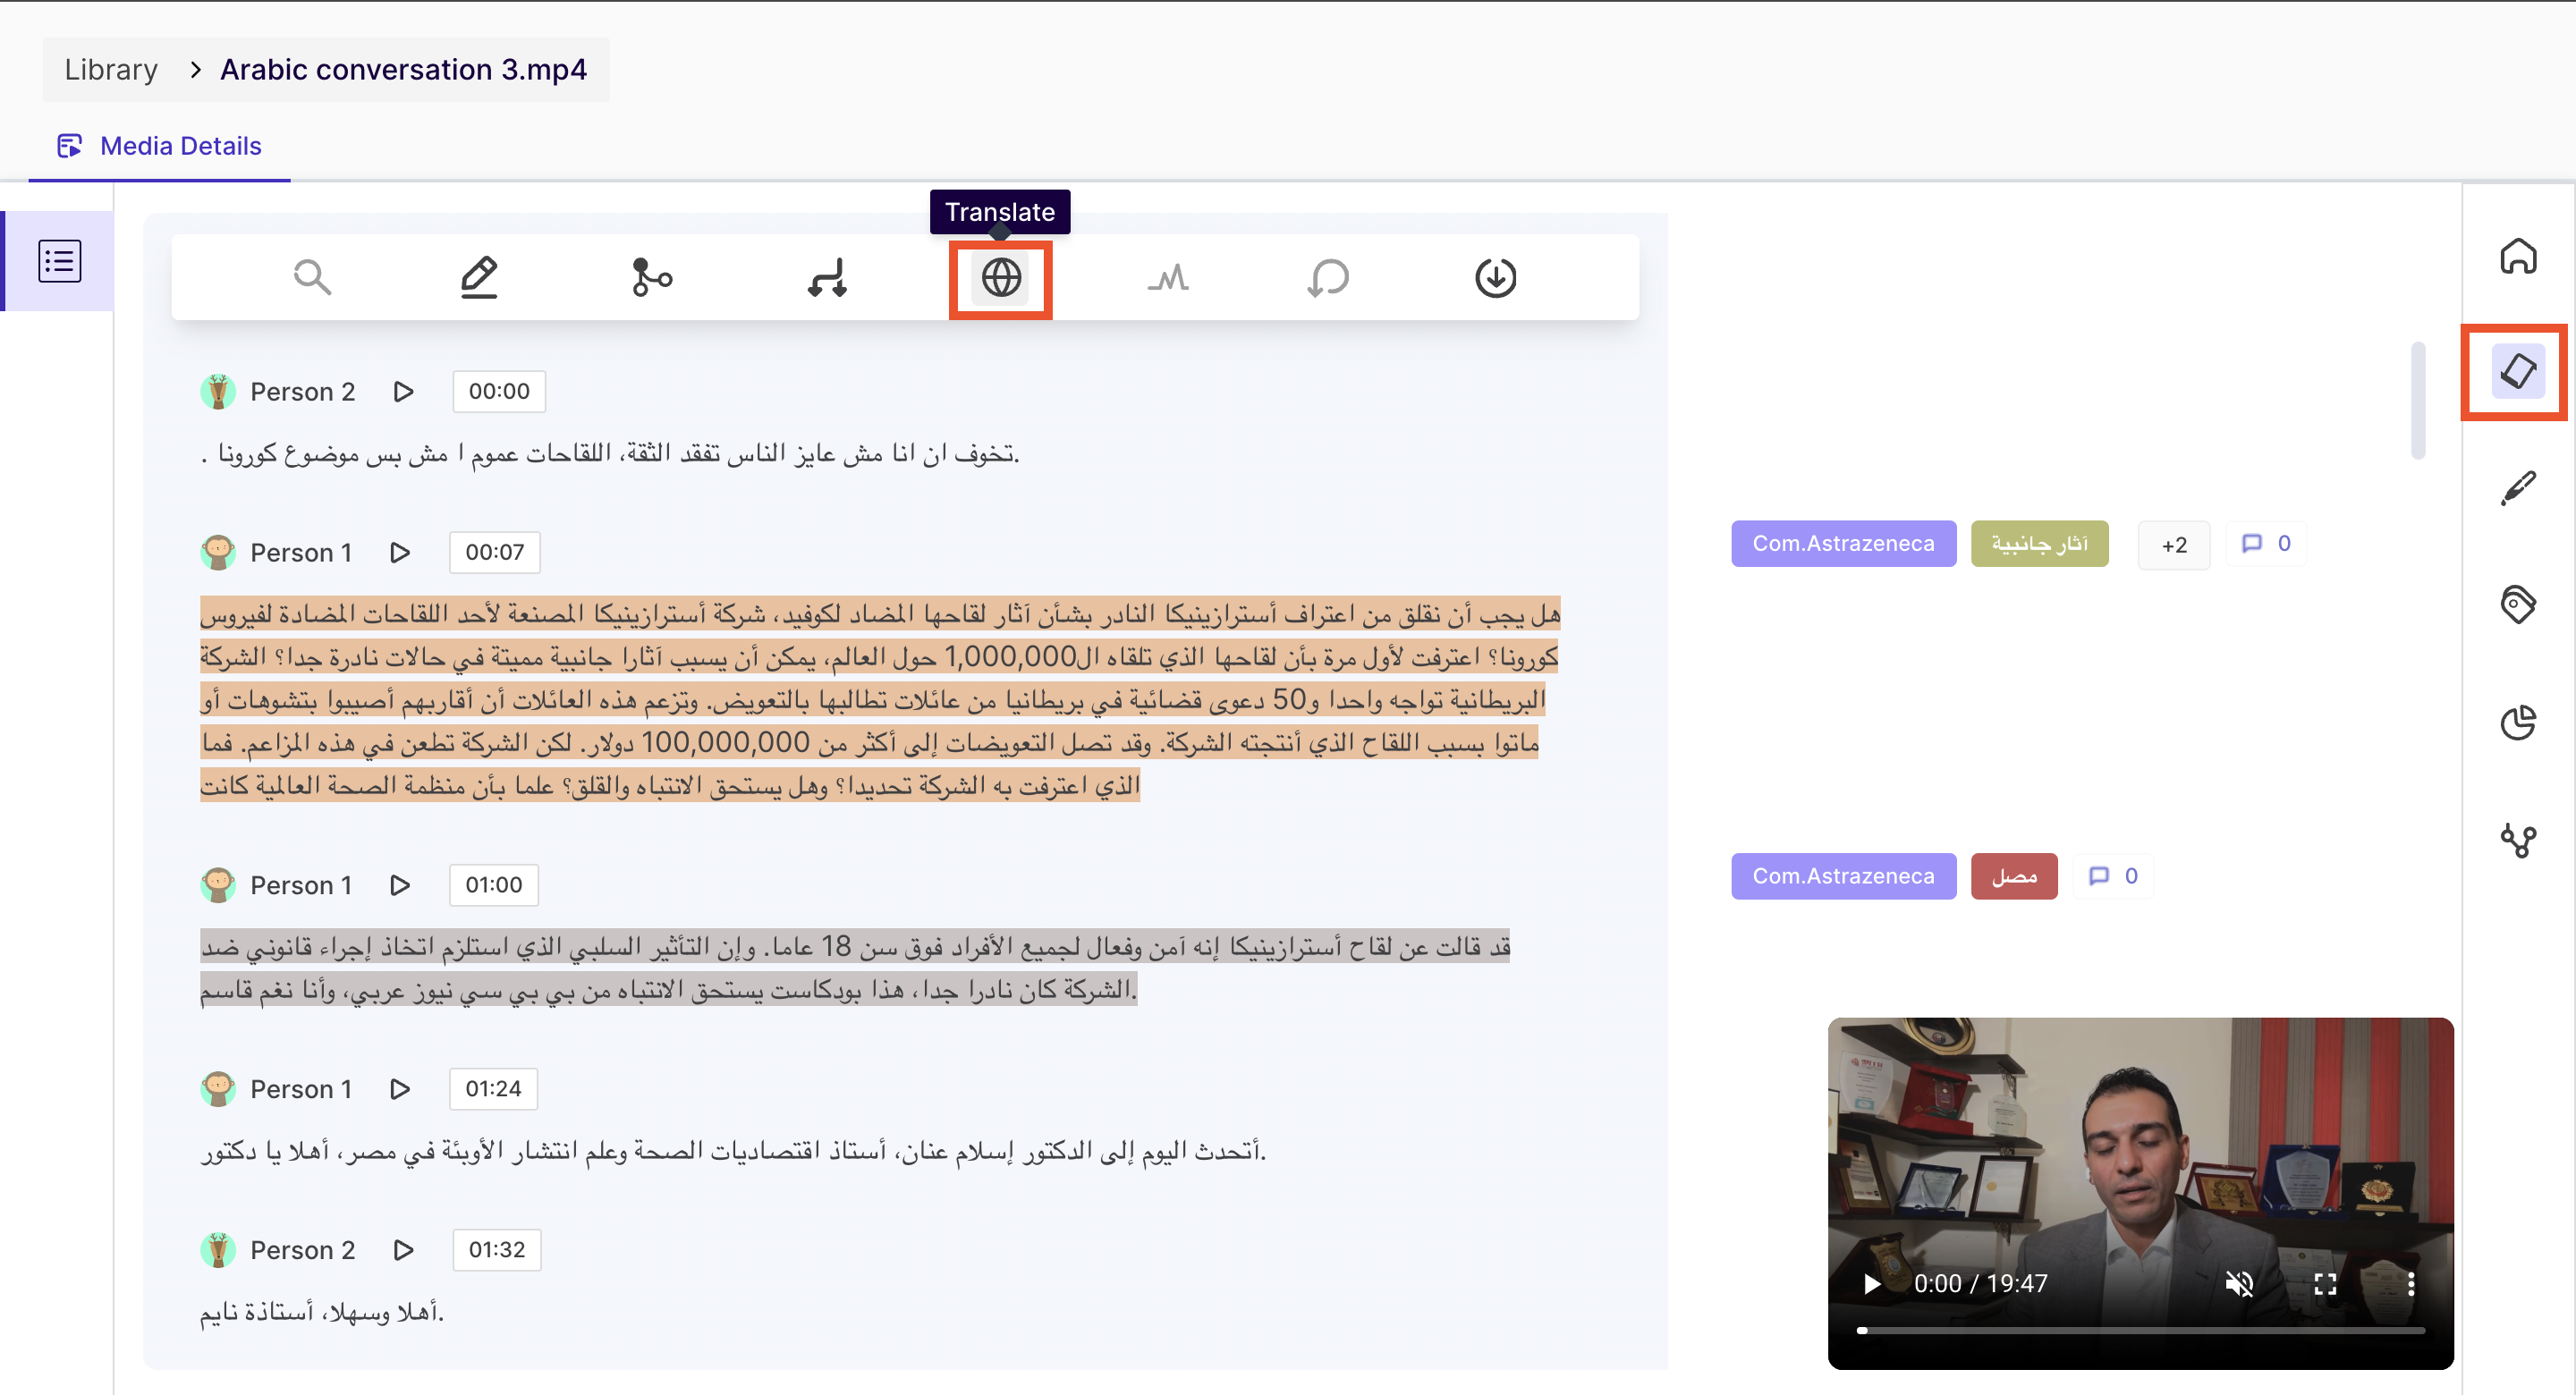
On this page, you will find the transcript of the conversation in the media and different sections for different speakers. You can also edit the transcripts, translate them to other languages and generate the analysis for them.
What can you do on this page?
Create highlights: You can select specific parts of the transcript and create highlights, which can be used to reference important topics, keep track of action items, or share specific sections with other team members.
Edit transcript: You can edit the transcript to correct any errors or inaccuracies that may have been detected during the transcription process.
Split and merge transcript cards: You can split and merge the transcript cards to create a more accurate representation of the meeting. This is particularly useful when there are multiple speakers.
Translate: You can translate the transcript into 100+ languages to make it more accessible to non-native speakers or to collaborate with teams in different countries.
Regenerate analytics: If you make any changes to the transcript, you can regenerate the analytics to update the insights and data based on the new transcript.
Undo changes: you can undo any changes made to the transcript if they need to revert to the previous version.
Download transcript: You can download the transcript as a file, which can be shared with team members or used for reference later on.
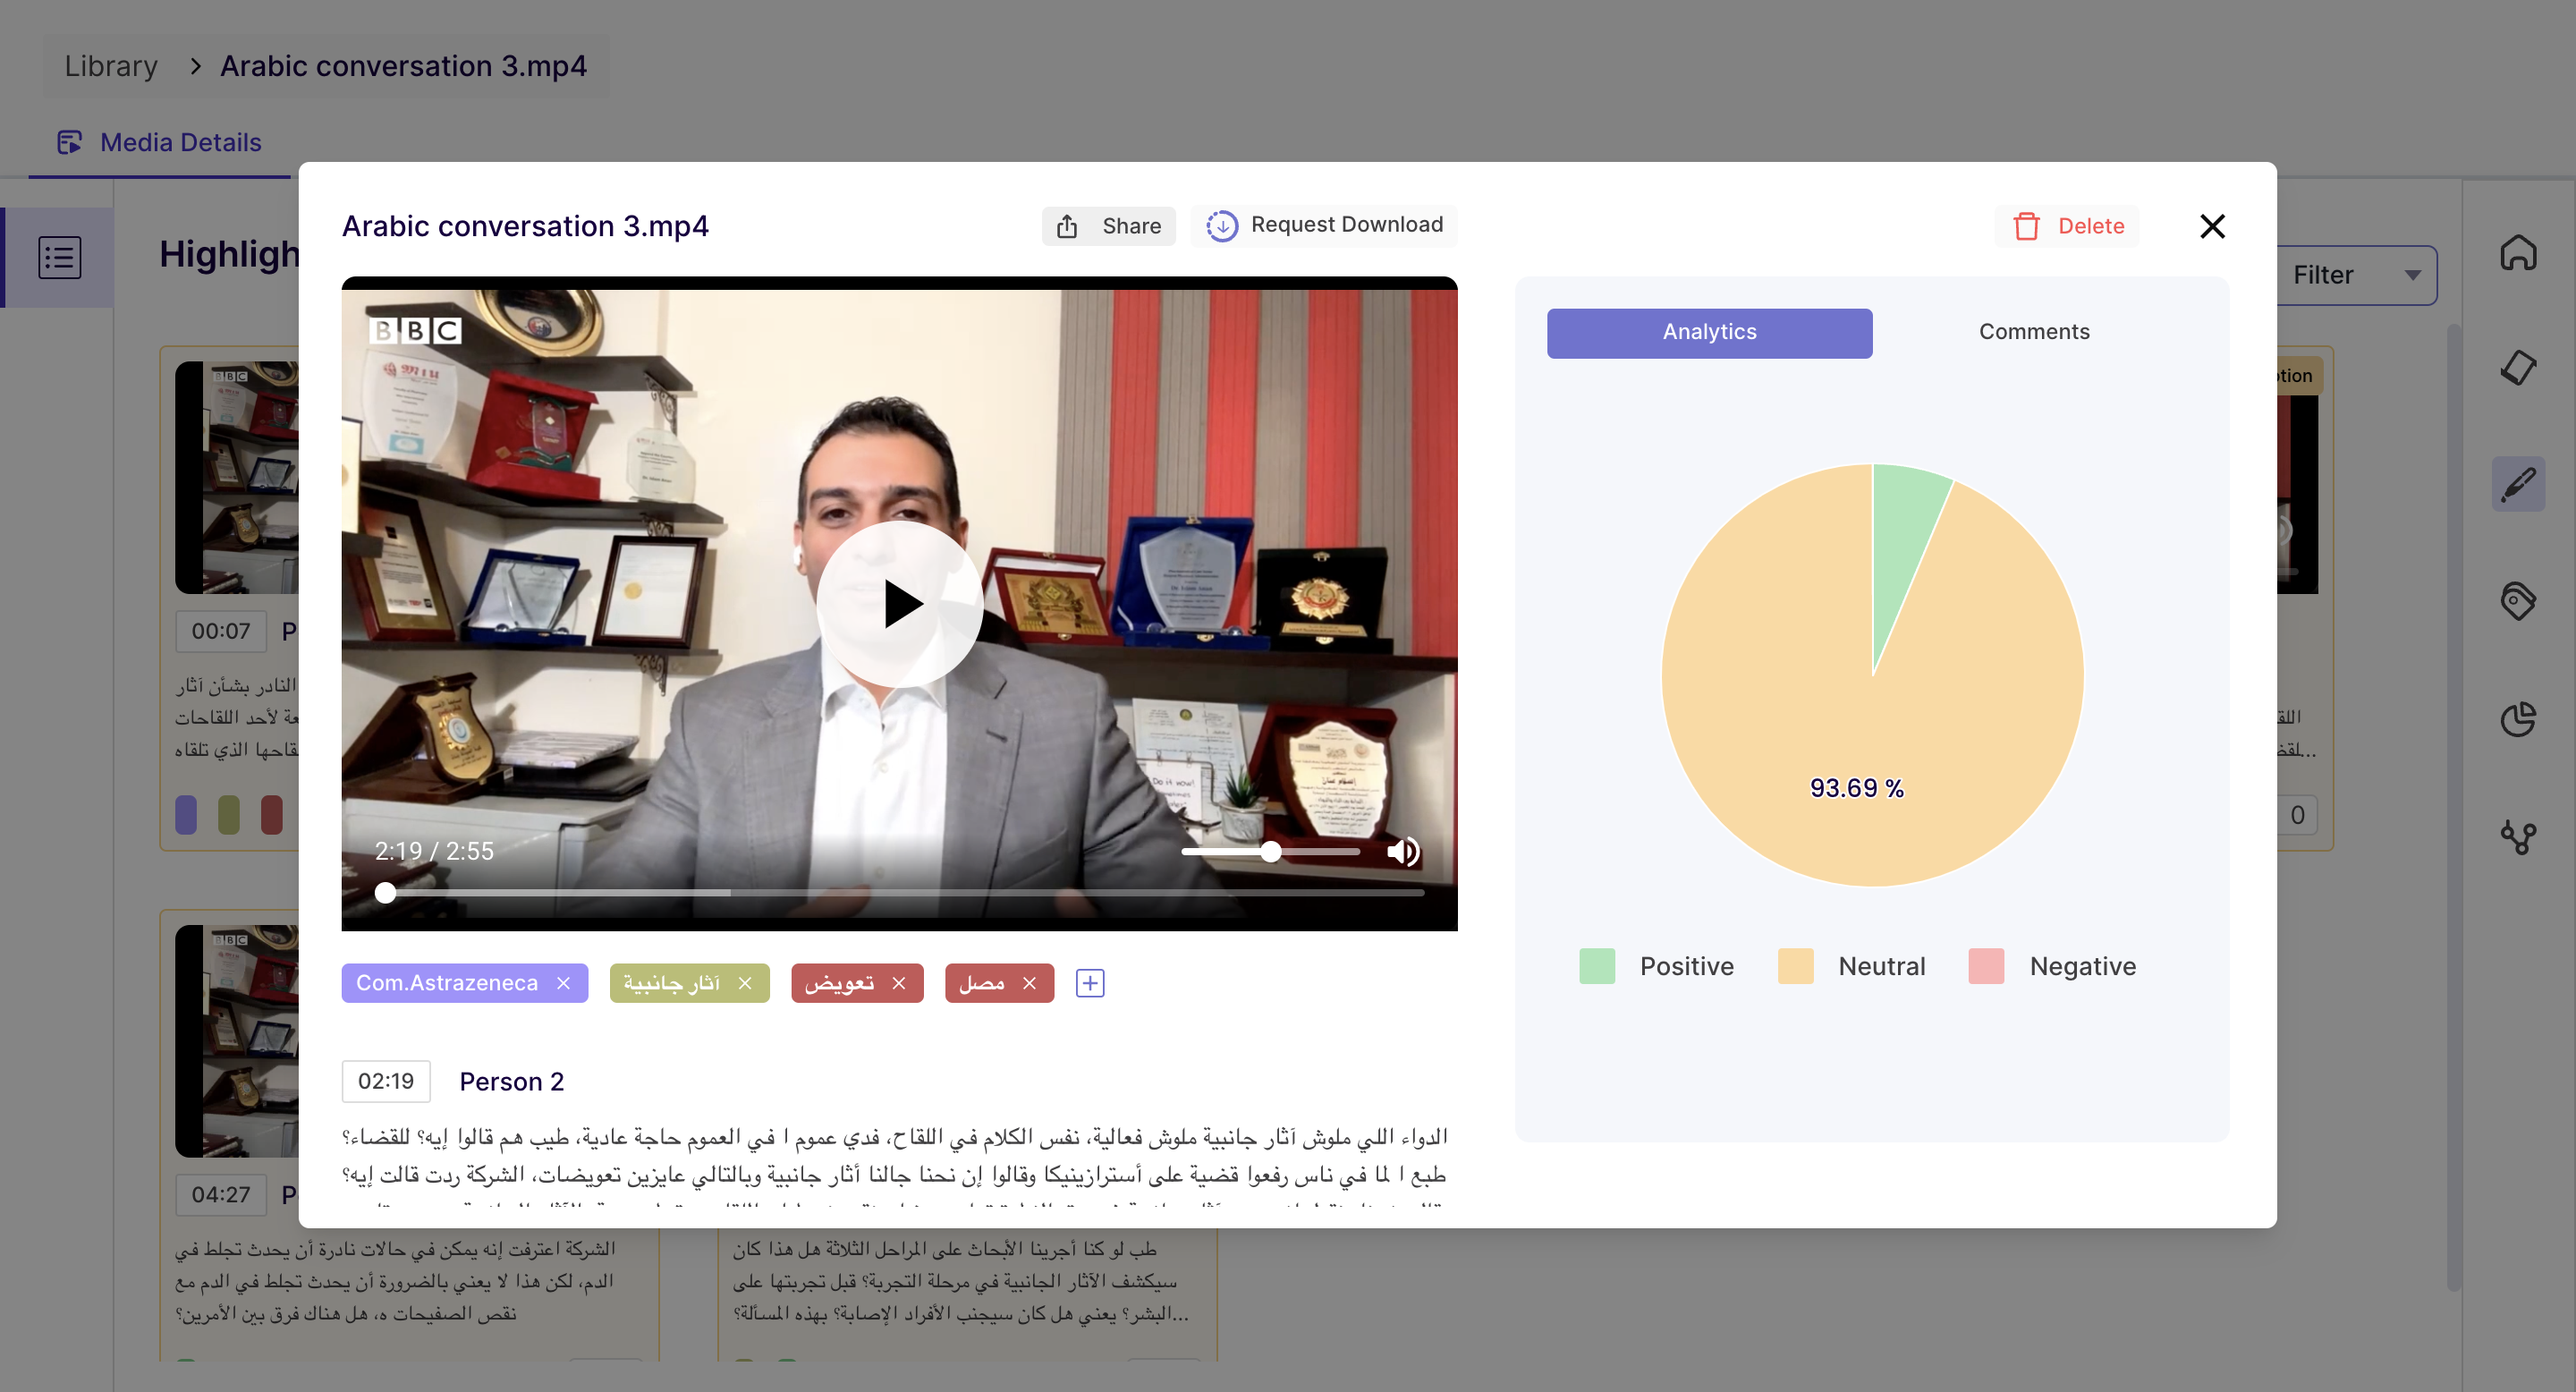
3. Highlight Page
On this page, you will find all the highlights created for the media from the transcript section. You can download, share and view emotion analytics of the highlights from here.
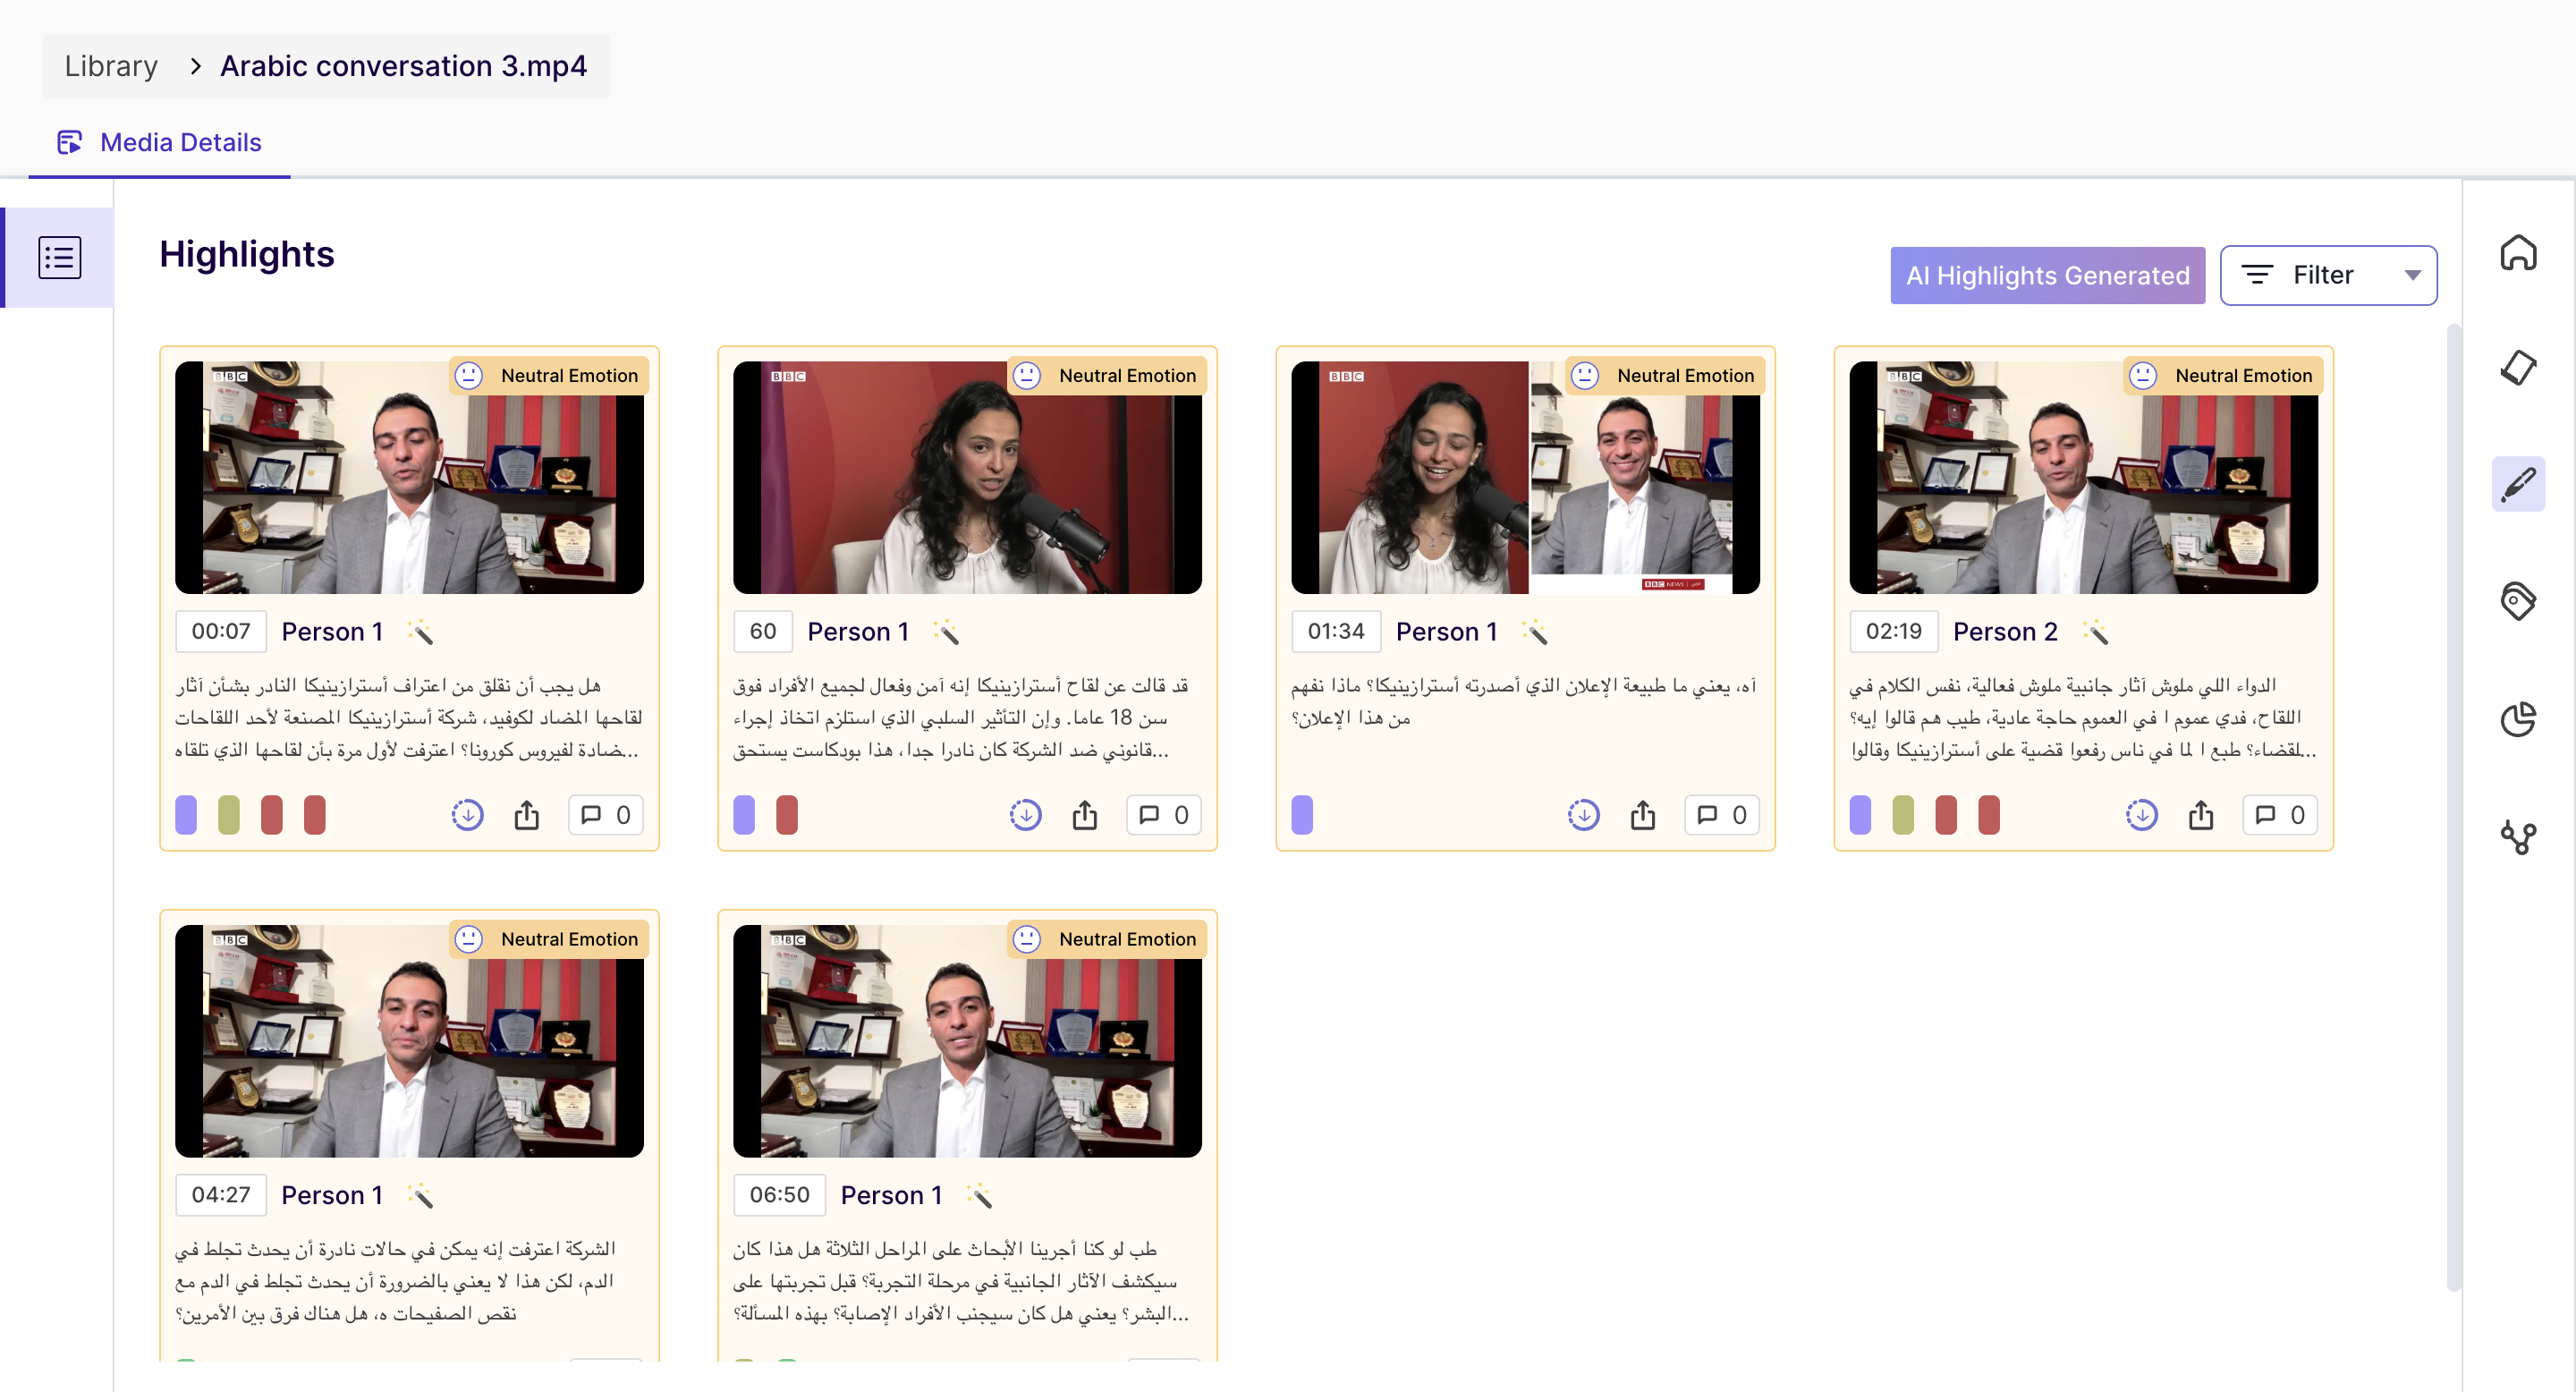
Once you click on the highlight card, you can view the details of the highlights.
4. Tag Page
Tags are helpful in identifying the essential parts of your video; you can group them and visualize the data.
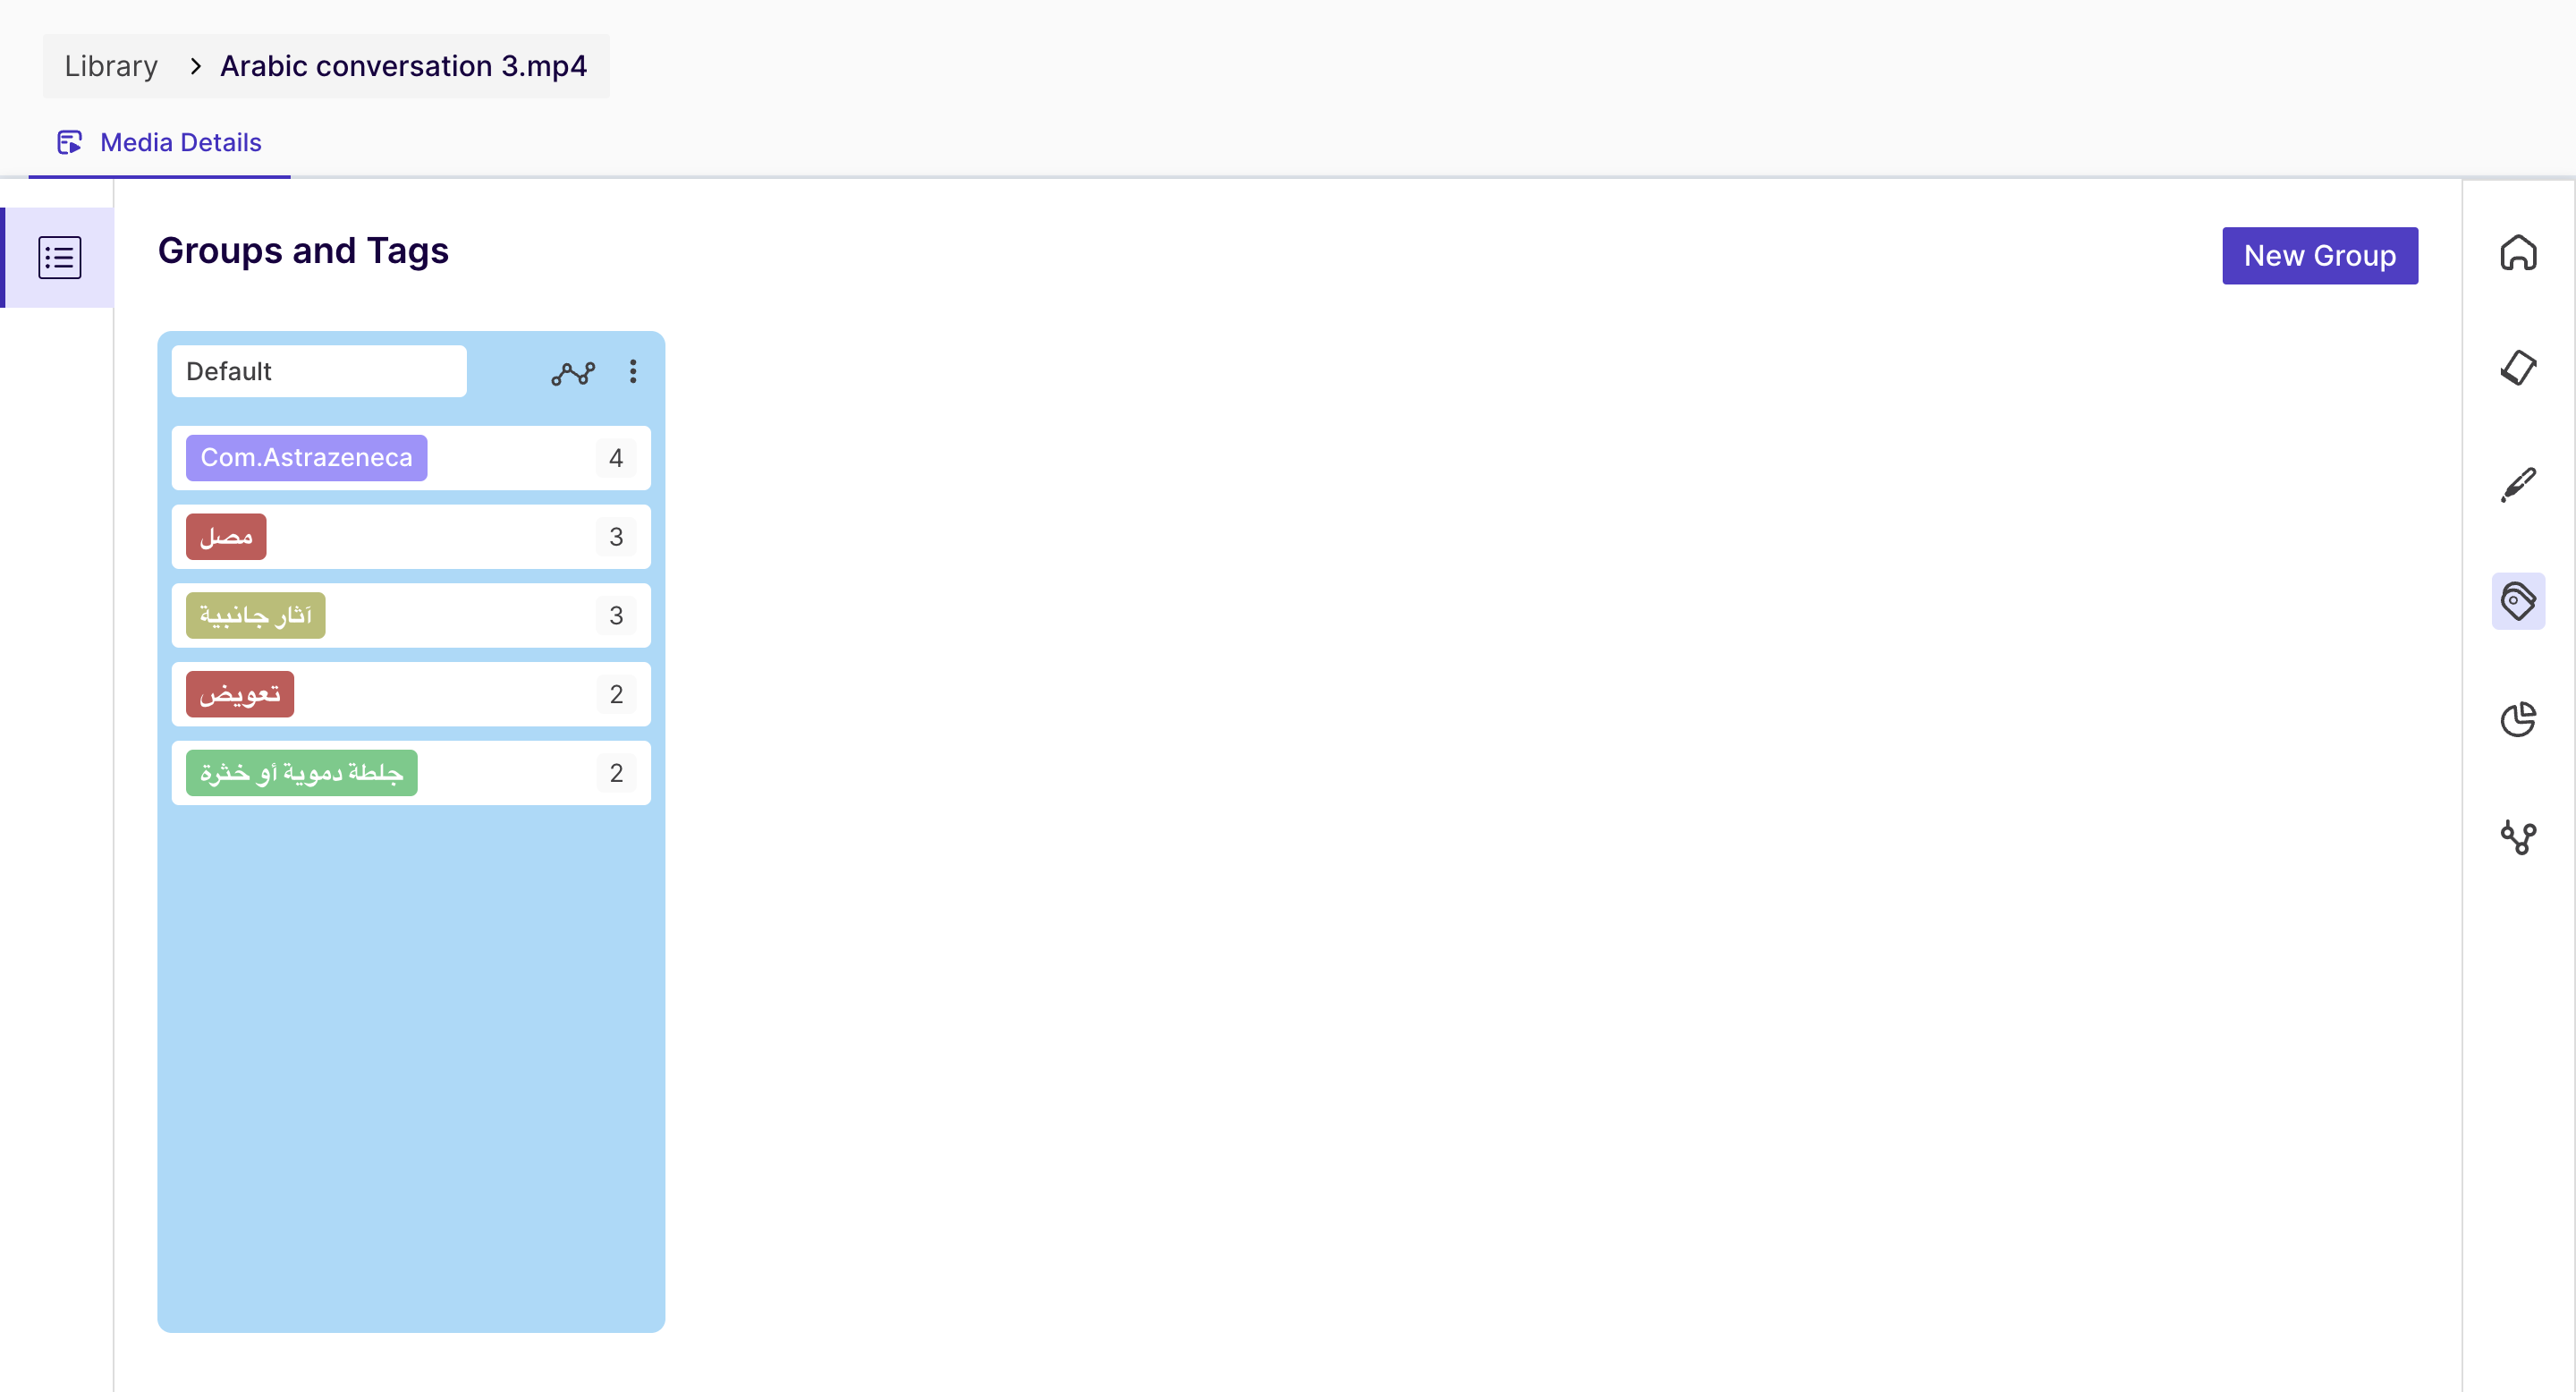
One highlight can be associated with multiple tags.
In the above screenshots, it can be seen that for the tag "Recording", we have two highlights, and for the "Introduction", we have one.
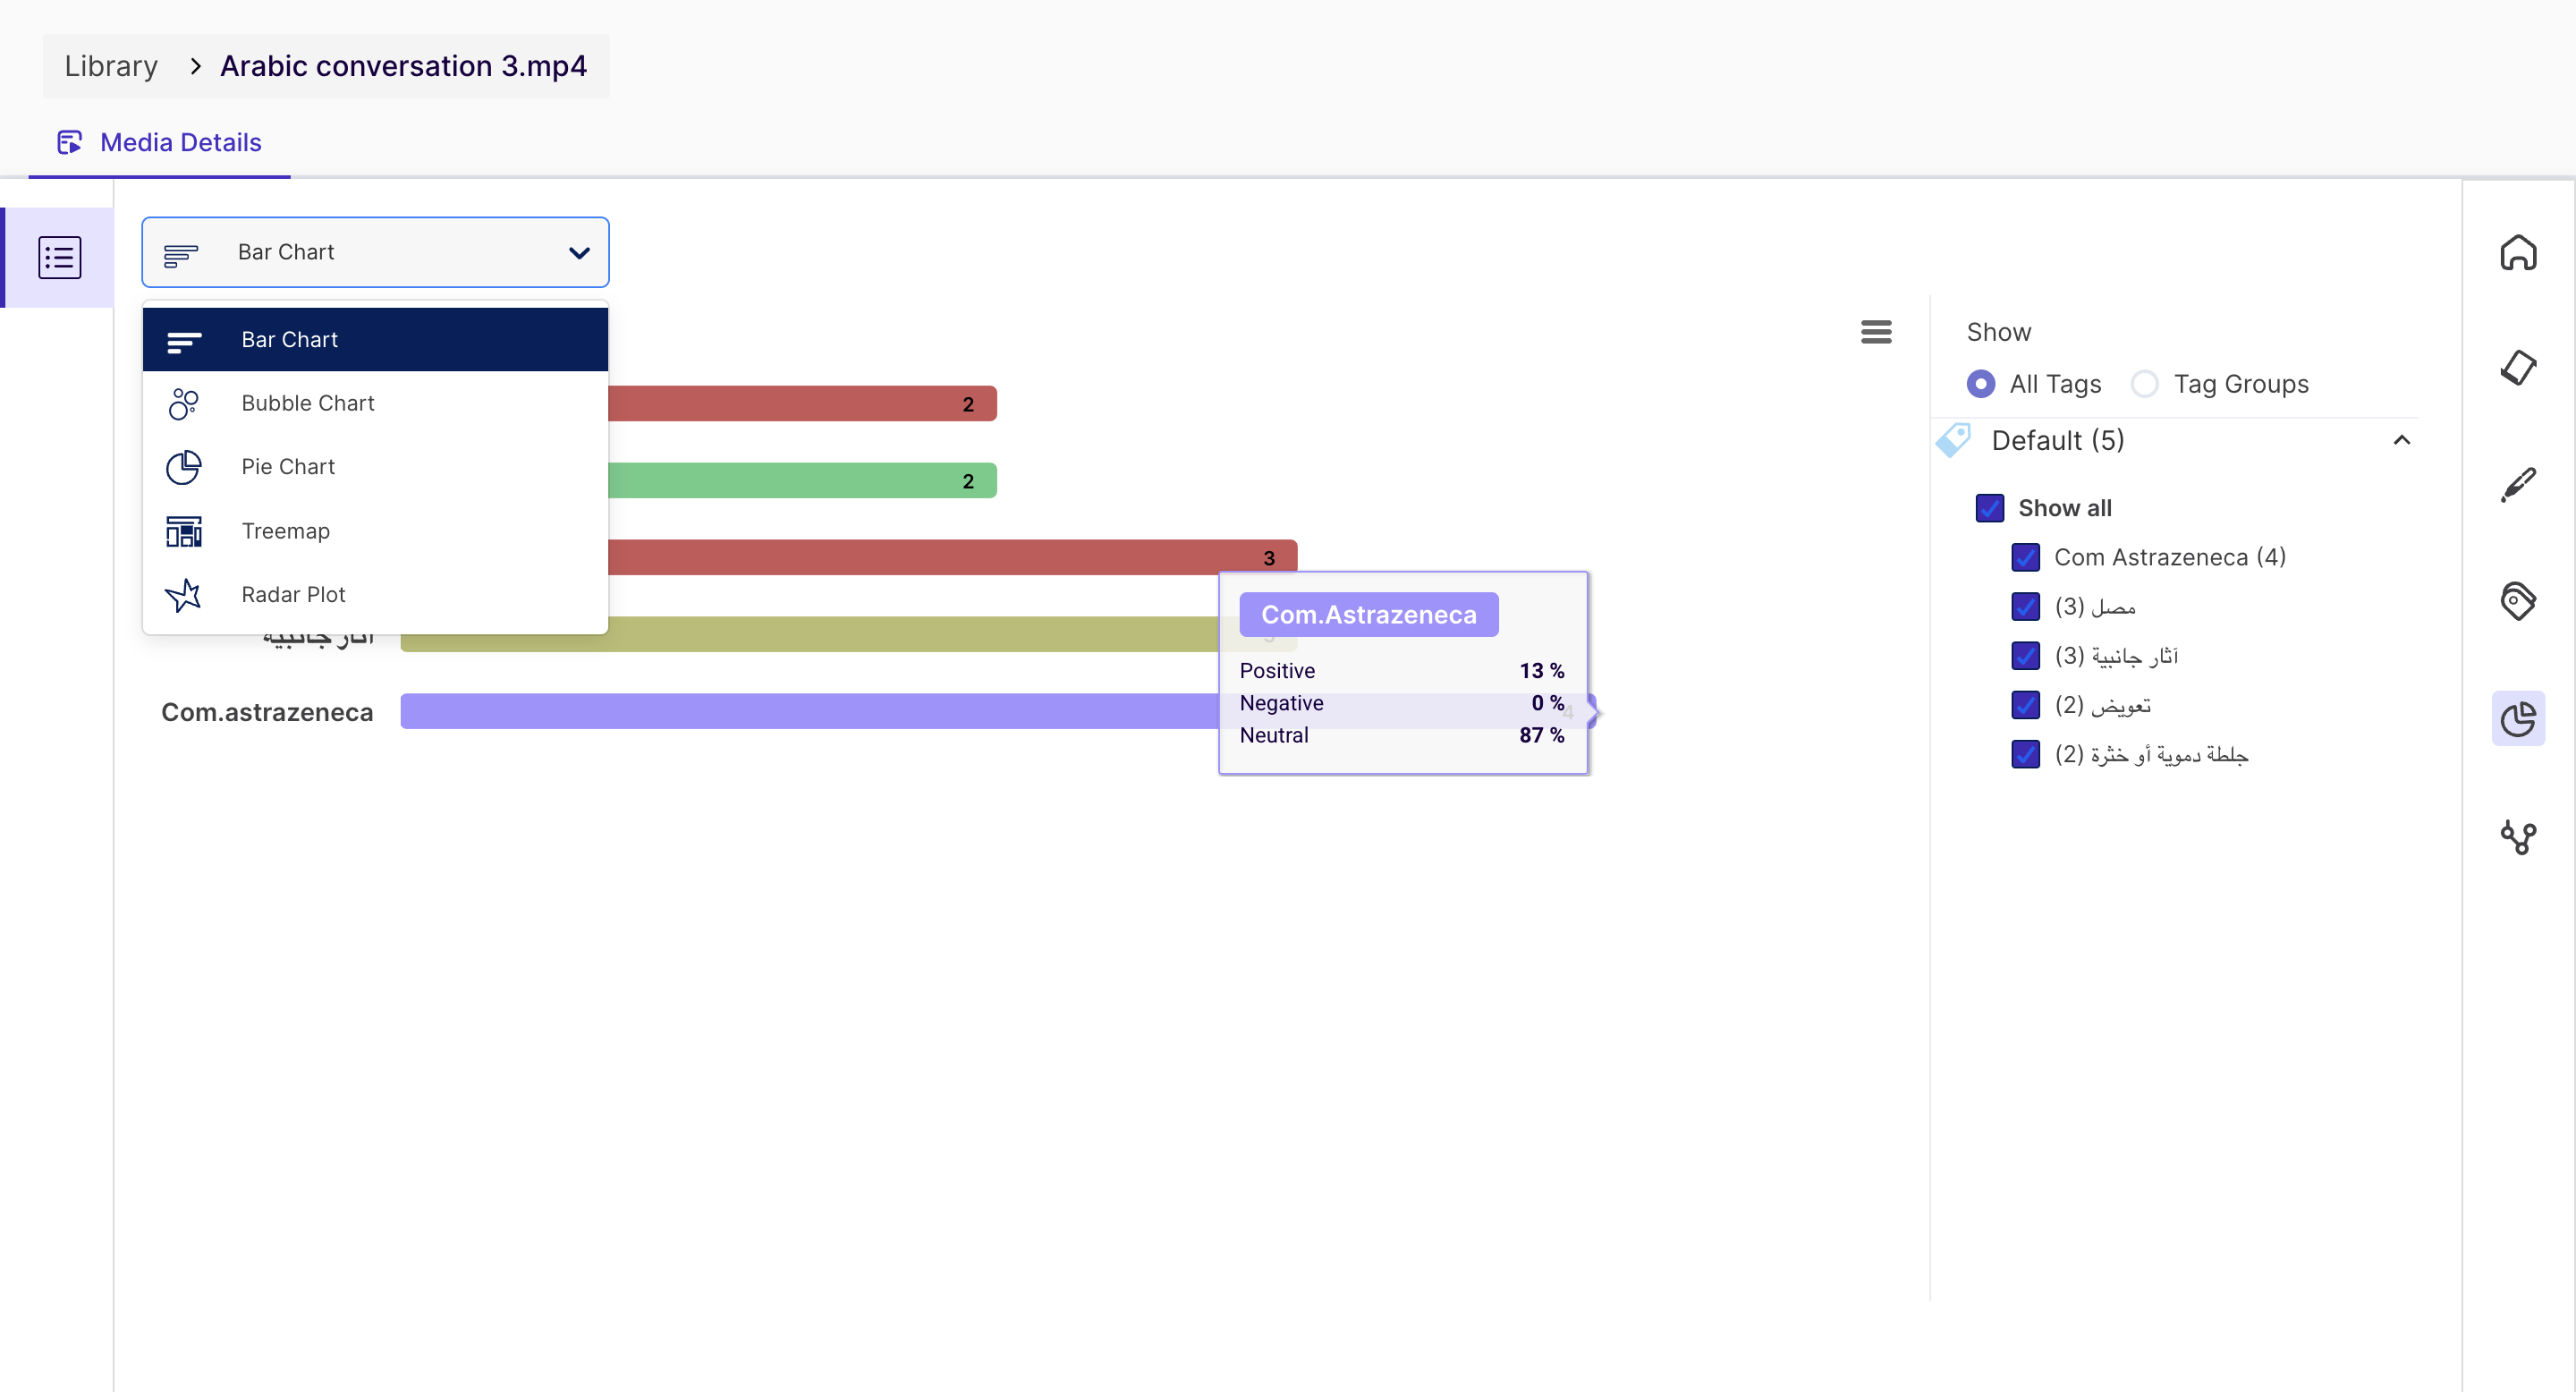
5. Tag Chart
You can visualize the above tags from this page and view the data in the following different charts:
- Bar Chart
- Bubble Chart
- Pie Chart
- Treemap
- Radar Plot
6. Analytics Page
The Analytics page on the Media page provides complete data about the key metrics from the conversation.
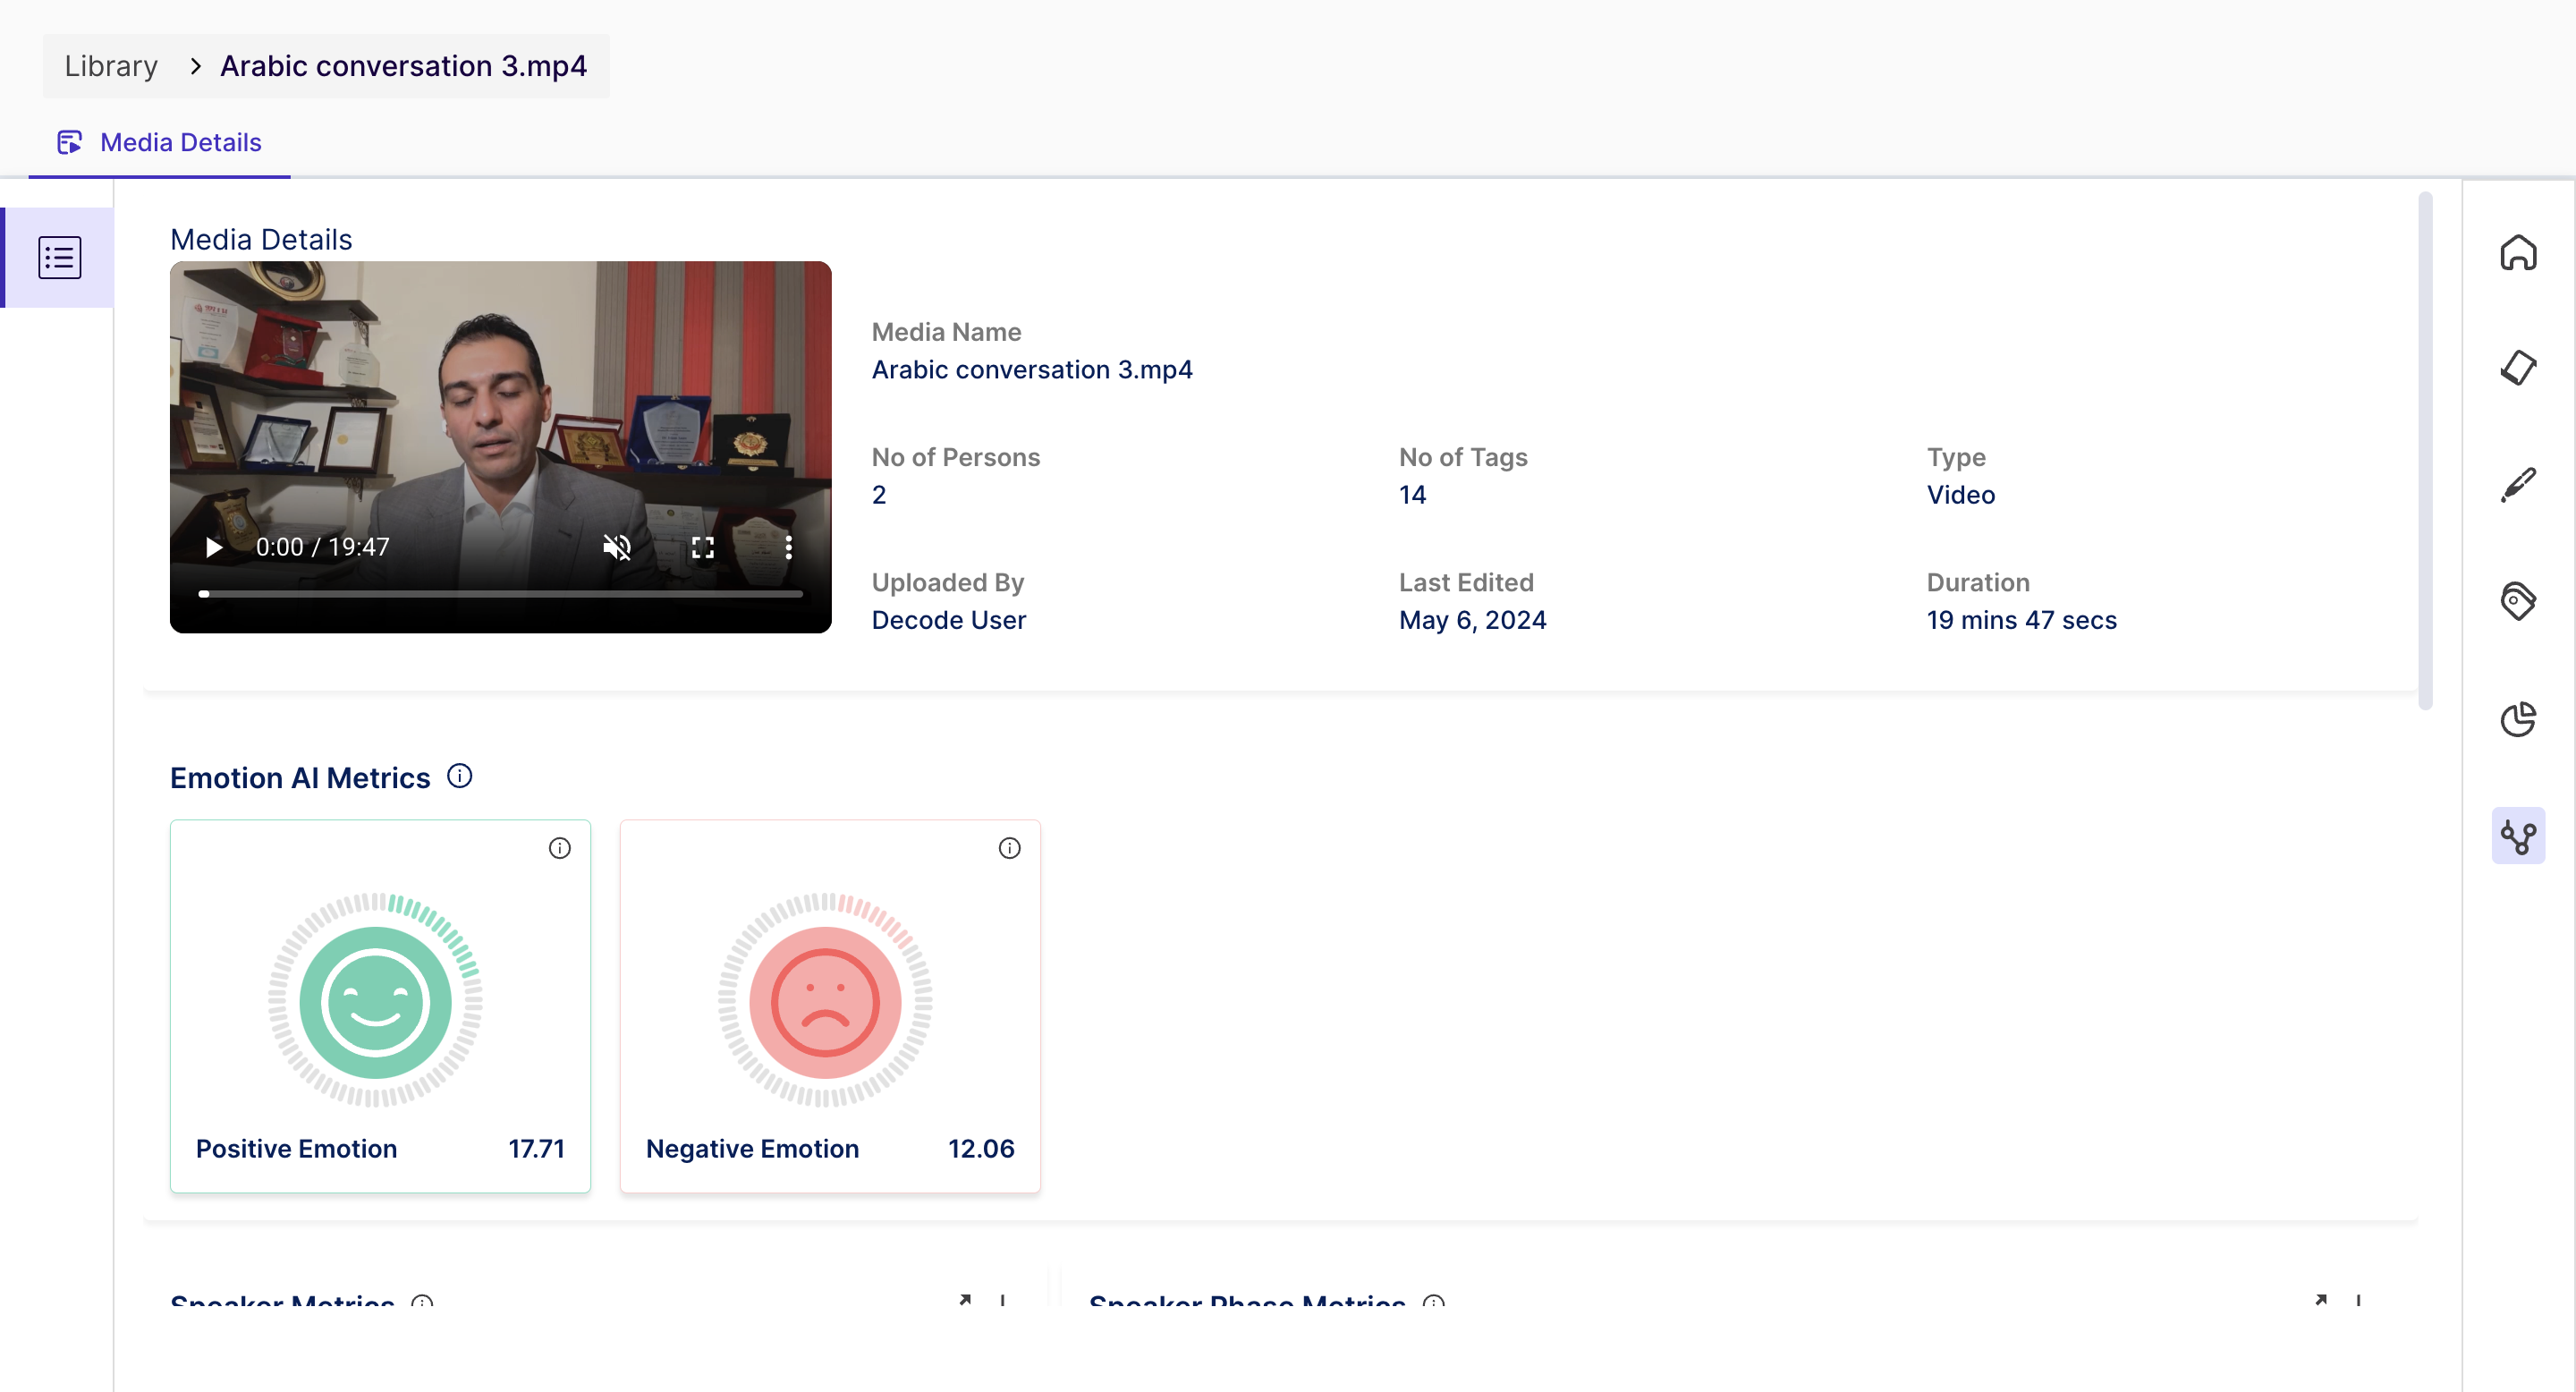
- You can play the uploaded media for quick reference to the discussion. The Media Name and details about the Media are presented in a summary view next to the Media.
Metrics
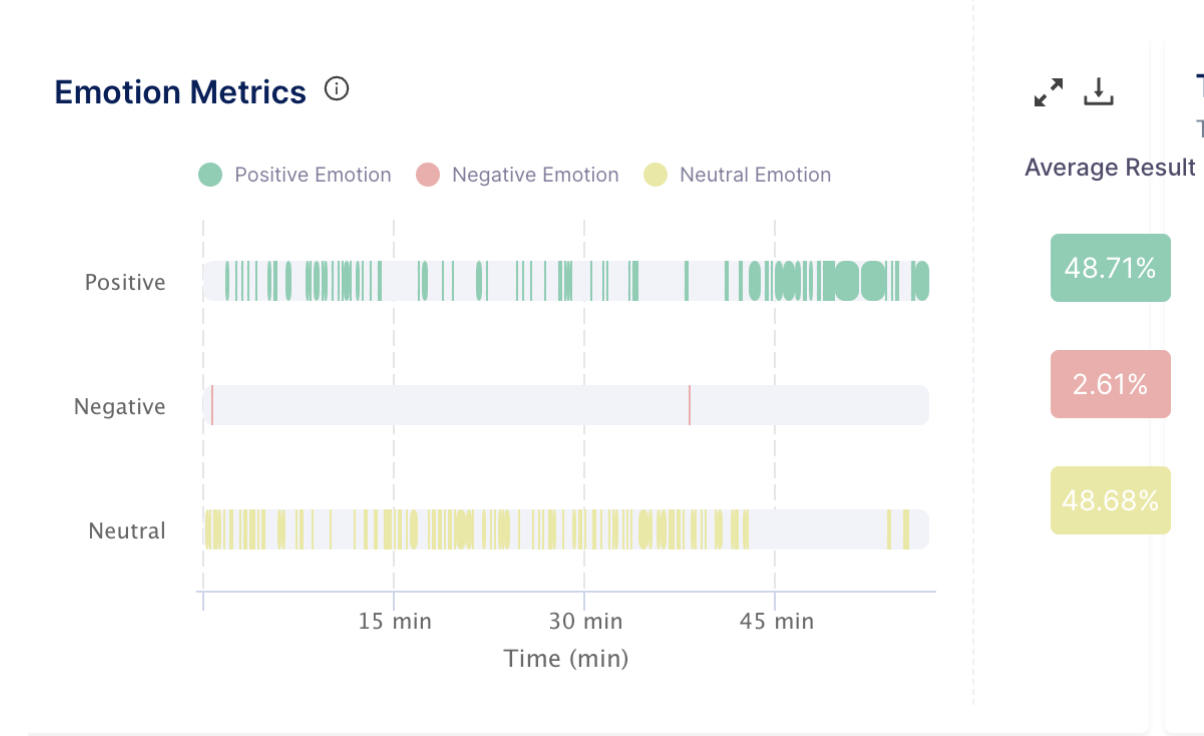
- Emotion AI Metrics: The overall distribution of emotion in the discussion is obtained and presented using easy-to-read charts, as shown above. Below, emotion metrics are identified from the conversation and can be used to discover the participants' emotional states.
- Positive Emotions: the platform uses a combination of two emotions - Happy and Surprise - to determine the positive score of the overall conversation.
- Negative Emotions: the platform is using a combination of three emotions - Anger, Disgust, and Contempt - to determine the negative score of the overall conversation.
Note: Fear and sadness are not included in negative emotions, as these emotions need to be considered in the context of the media and can be shown as standalone emotions.
Followed by the Emotion AI Metrics, Users can find details about the participation of the speakers in the overall discussion.
- Speaker Metrics and Speaker Phase Metrics provide information on the overall percentage of involvement from each participant in the conversation and the sequence of dialogue change between them.
- Emotion Metrics This metric combines voice, facial, and text sentiment analytics to provide positive, negative, and neutral emotions displayed throughout the discussion. This consolidation provides a more comprehensive and simplified view of the overall sentiment expressed in the media content.
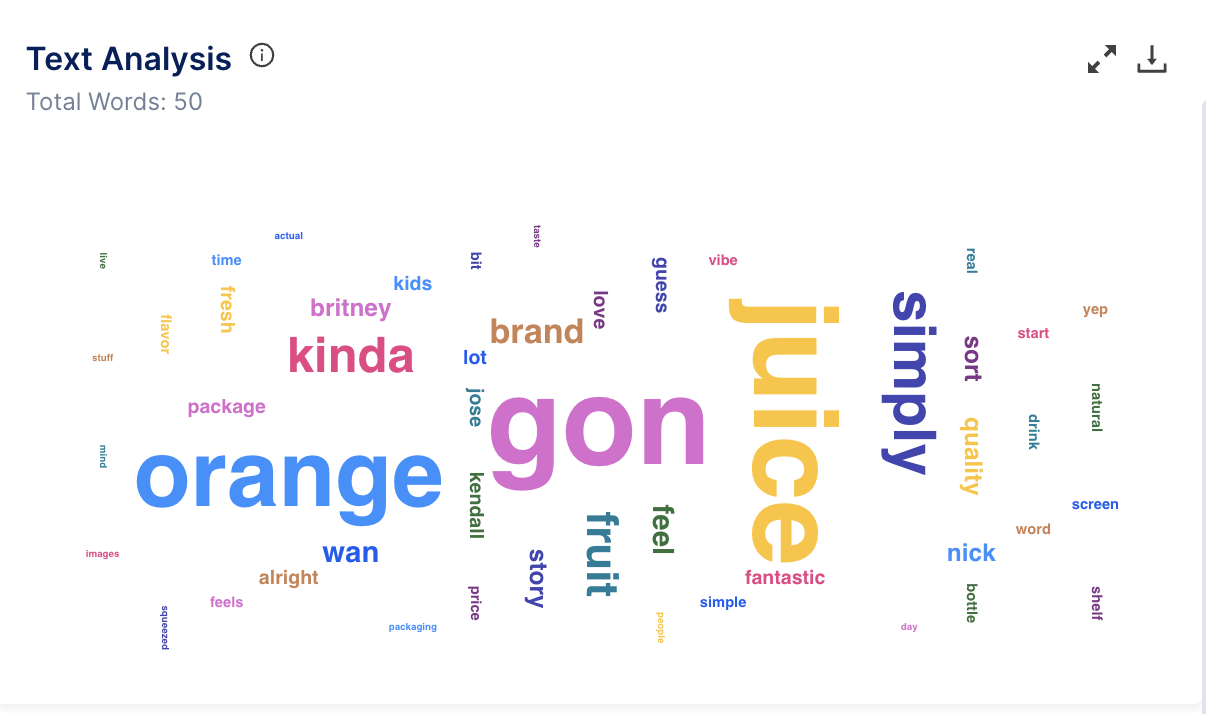
- Text Analysis - A visual representation of text data where words are displayed in varying sizes based on their frequency within the transcript.