
Insights of In-context testing in Decode
In the Results section of context testing, you can analyze their study's performance metrics, including total views, average viewing time, drop-off rates, and emotional responses. Identify the most engaging and positively received media and access detailed analytics for attention, engagement, emotions, and eye-tracking heatmaps at the media level. This section provides valuable insights for optimizing content based on audience interactions.
Overview Summary
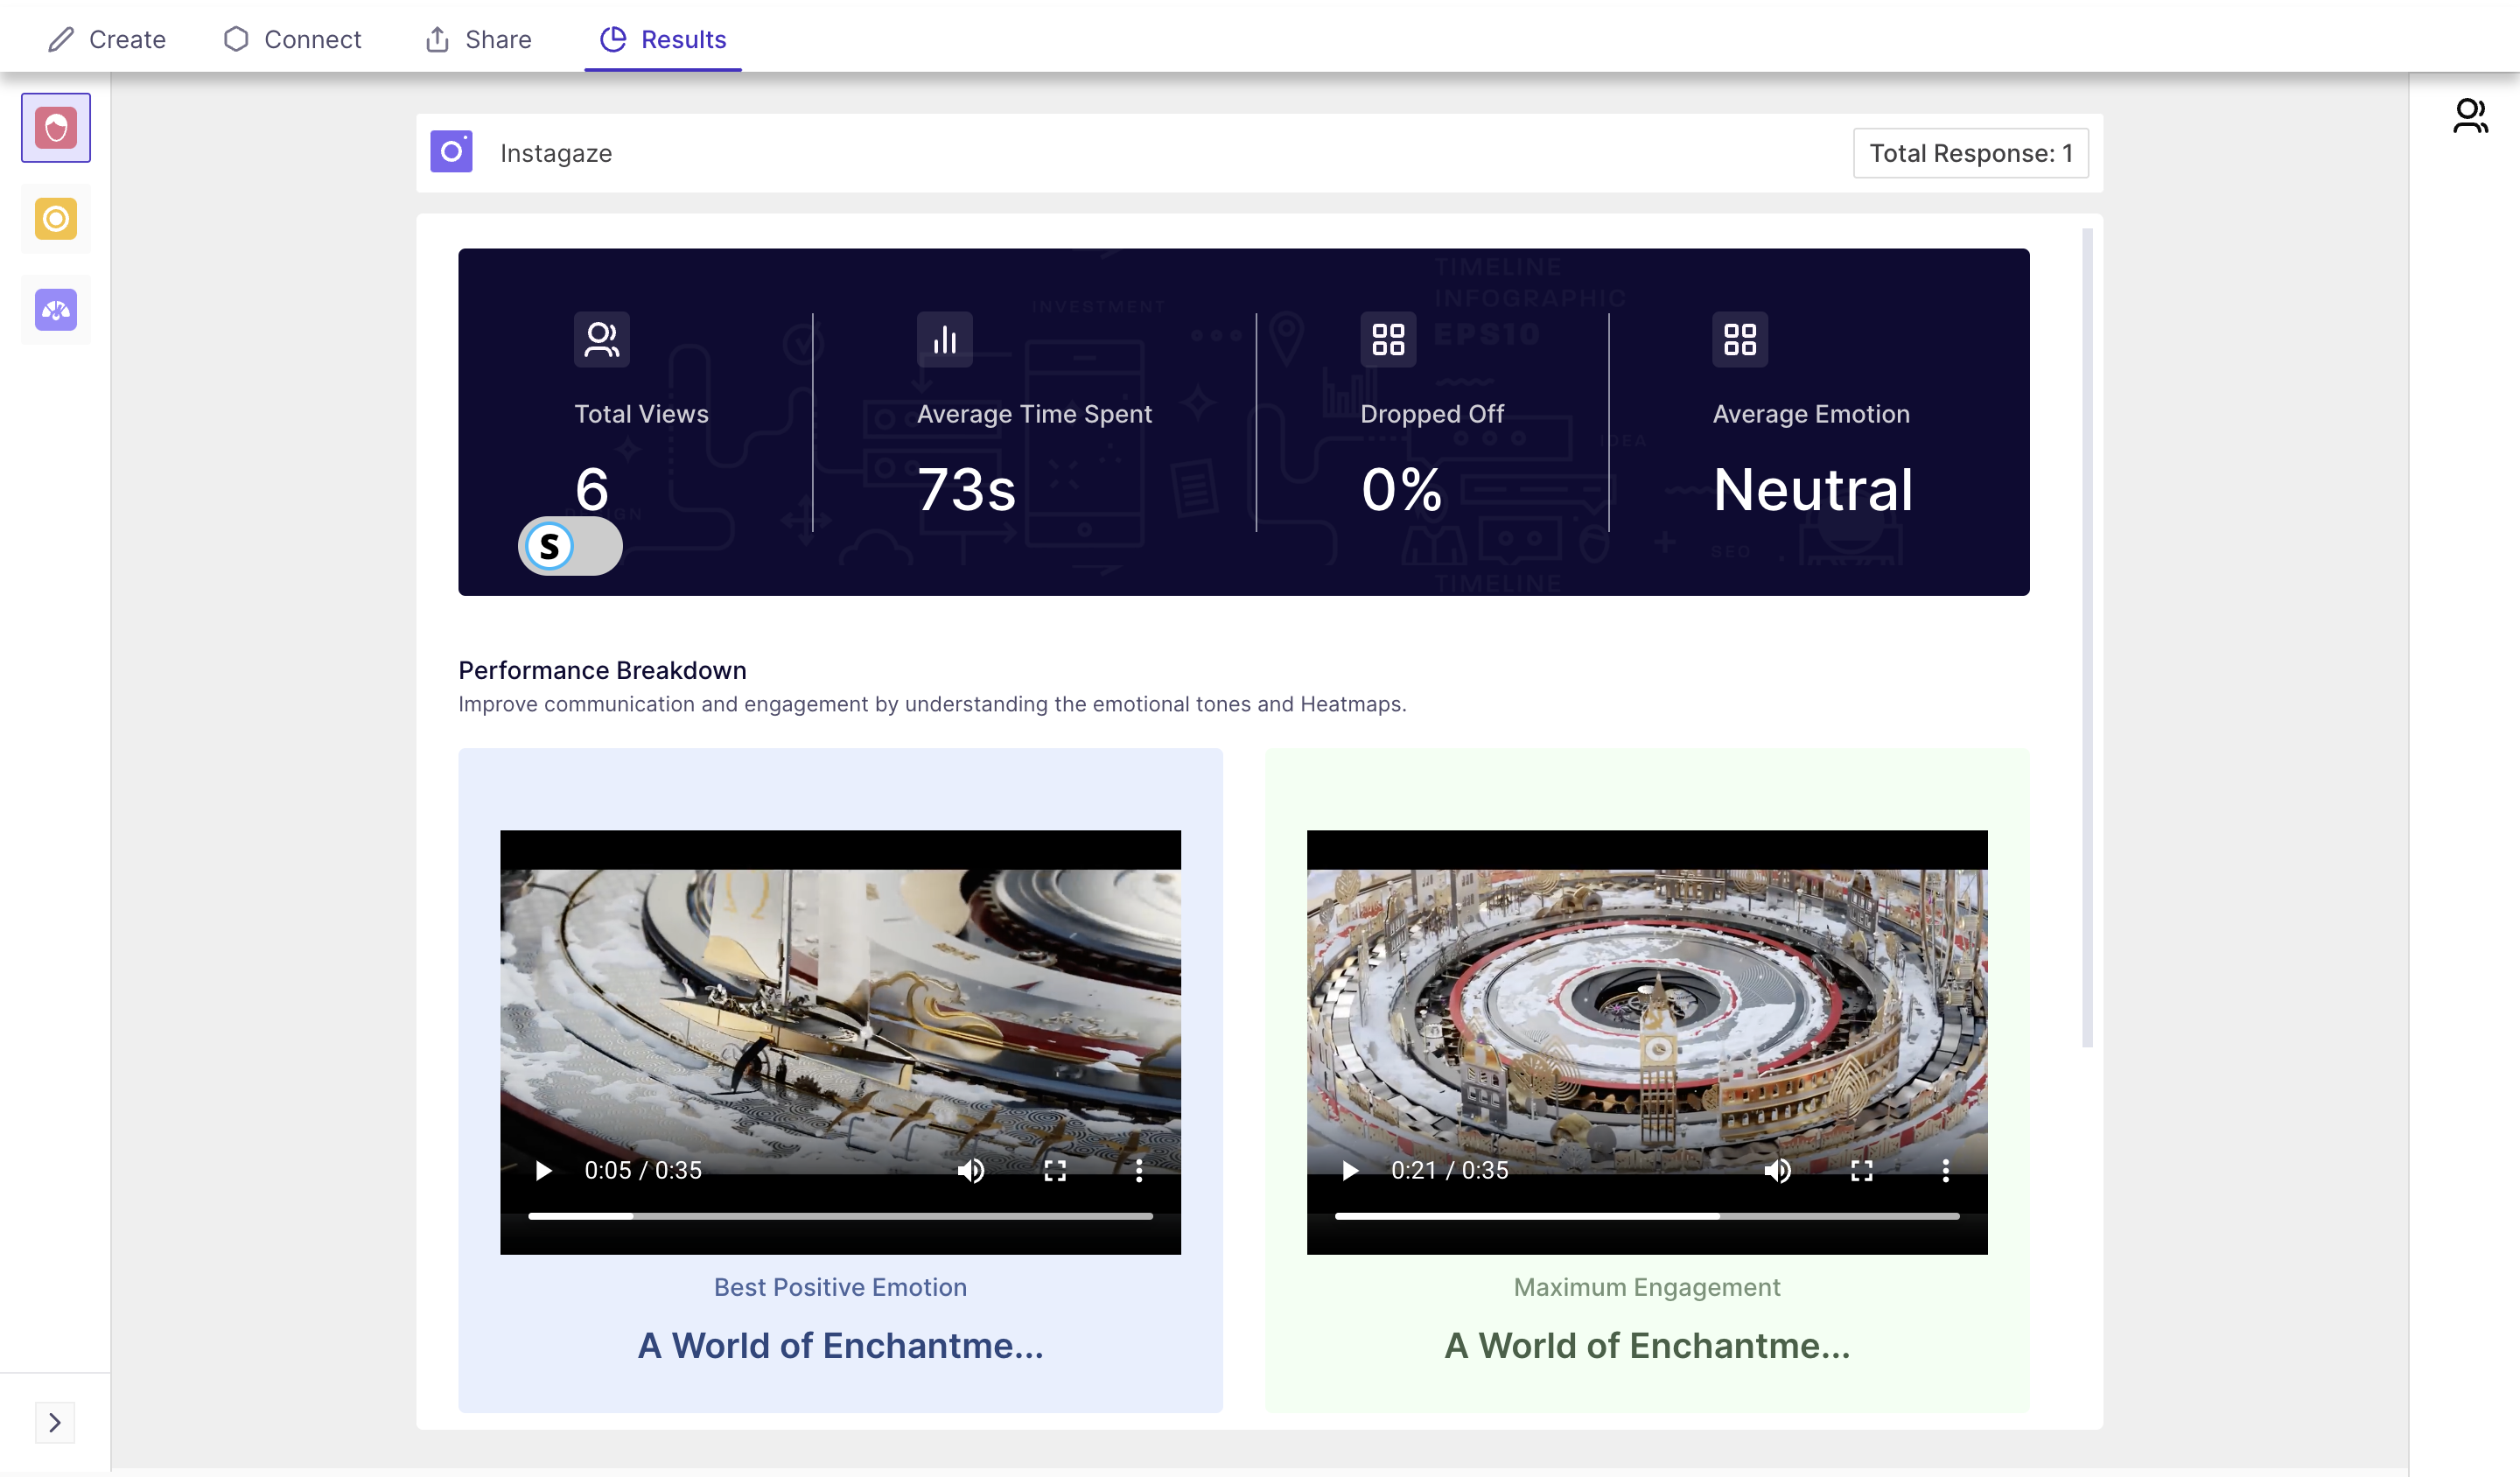
The overview page provides a concise yet comprehensive snapshot of your test's performance, offering the following key details:
- Total Views: The total number of views garnered during the test duration.
- Average Time Spent: The average duration users spent engaging with the content.
- Drop-off Rate: Indicates the percentage of users who disengaged or exited the test.
- Average Emotion Score: An aggregate representation of the emotional response elicited.
Top Performers
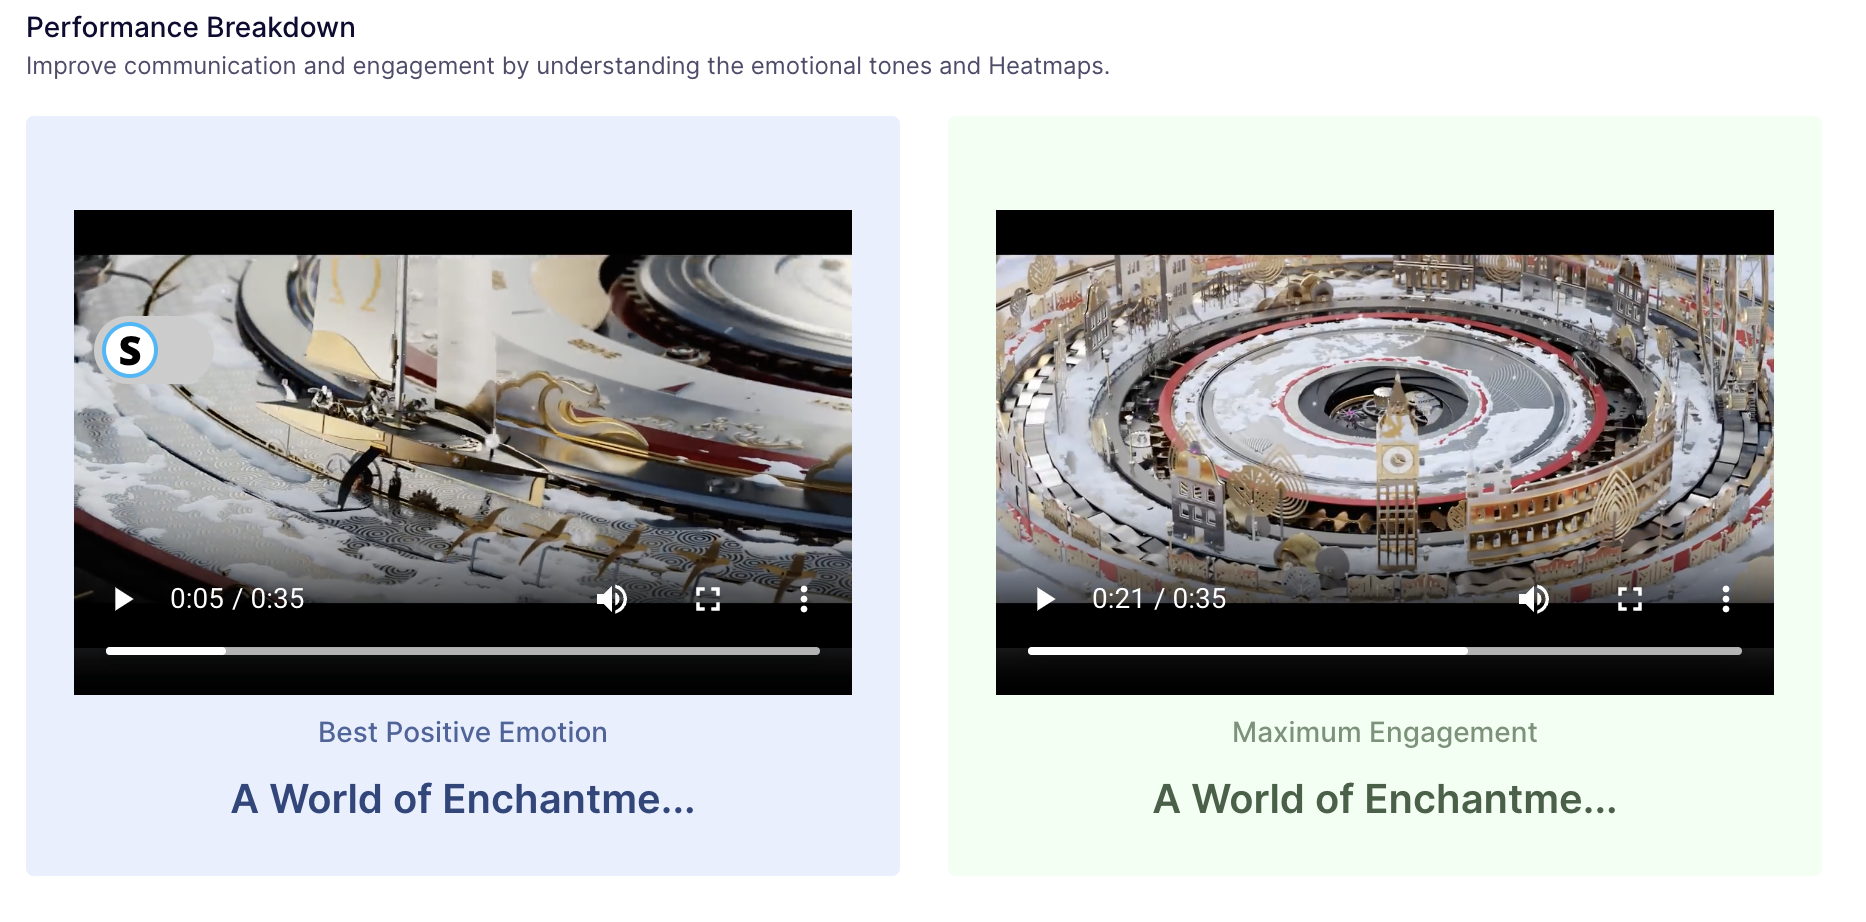
Discover the most impactful aspects of your test through:
- Best Positive Displayed: Identifies the creative that generated the most positive user responses.
- Maximum Engagement: Creative that secured the highest user engagement.
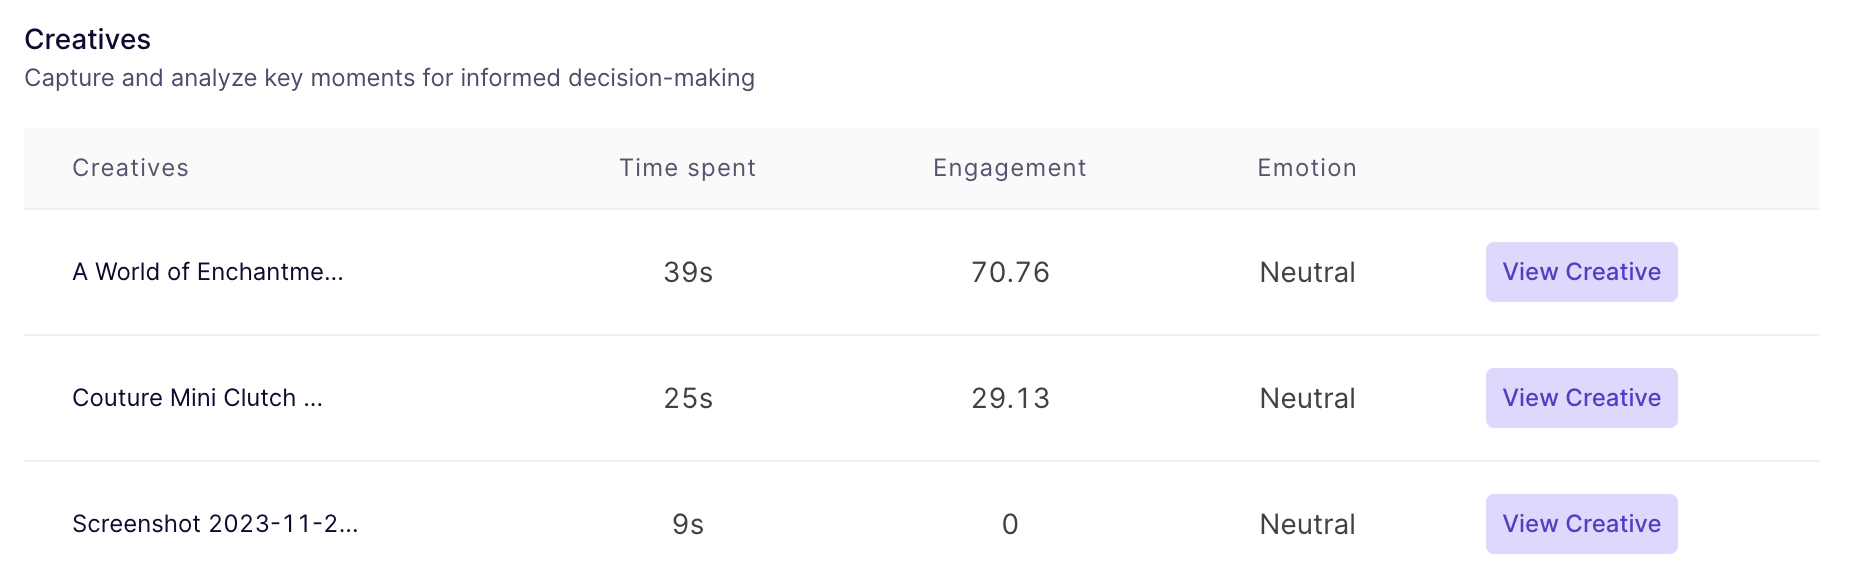
Creative Section
Explore the comprehensive list of all creatives that underwent testing. For detailed analytics at the creative level, simply click on the "View Creative" button corresponding to the desired creative.
Creative Level Analytics
Dive deeper into individual creatives' performance with detailed second-by-second analysis, particularly for video content. The creative level analytics section presents various insightful graphs.
Note: Use the Dropdown to view the particular graph.
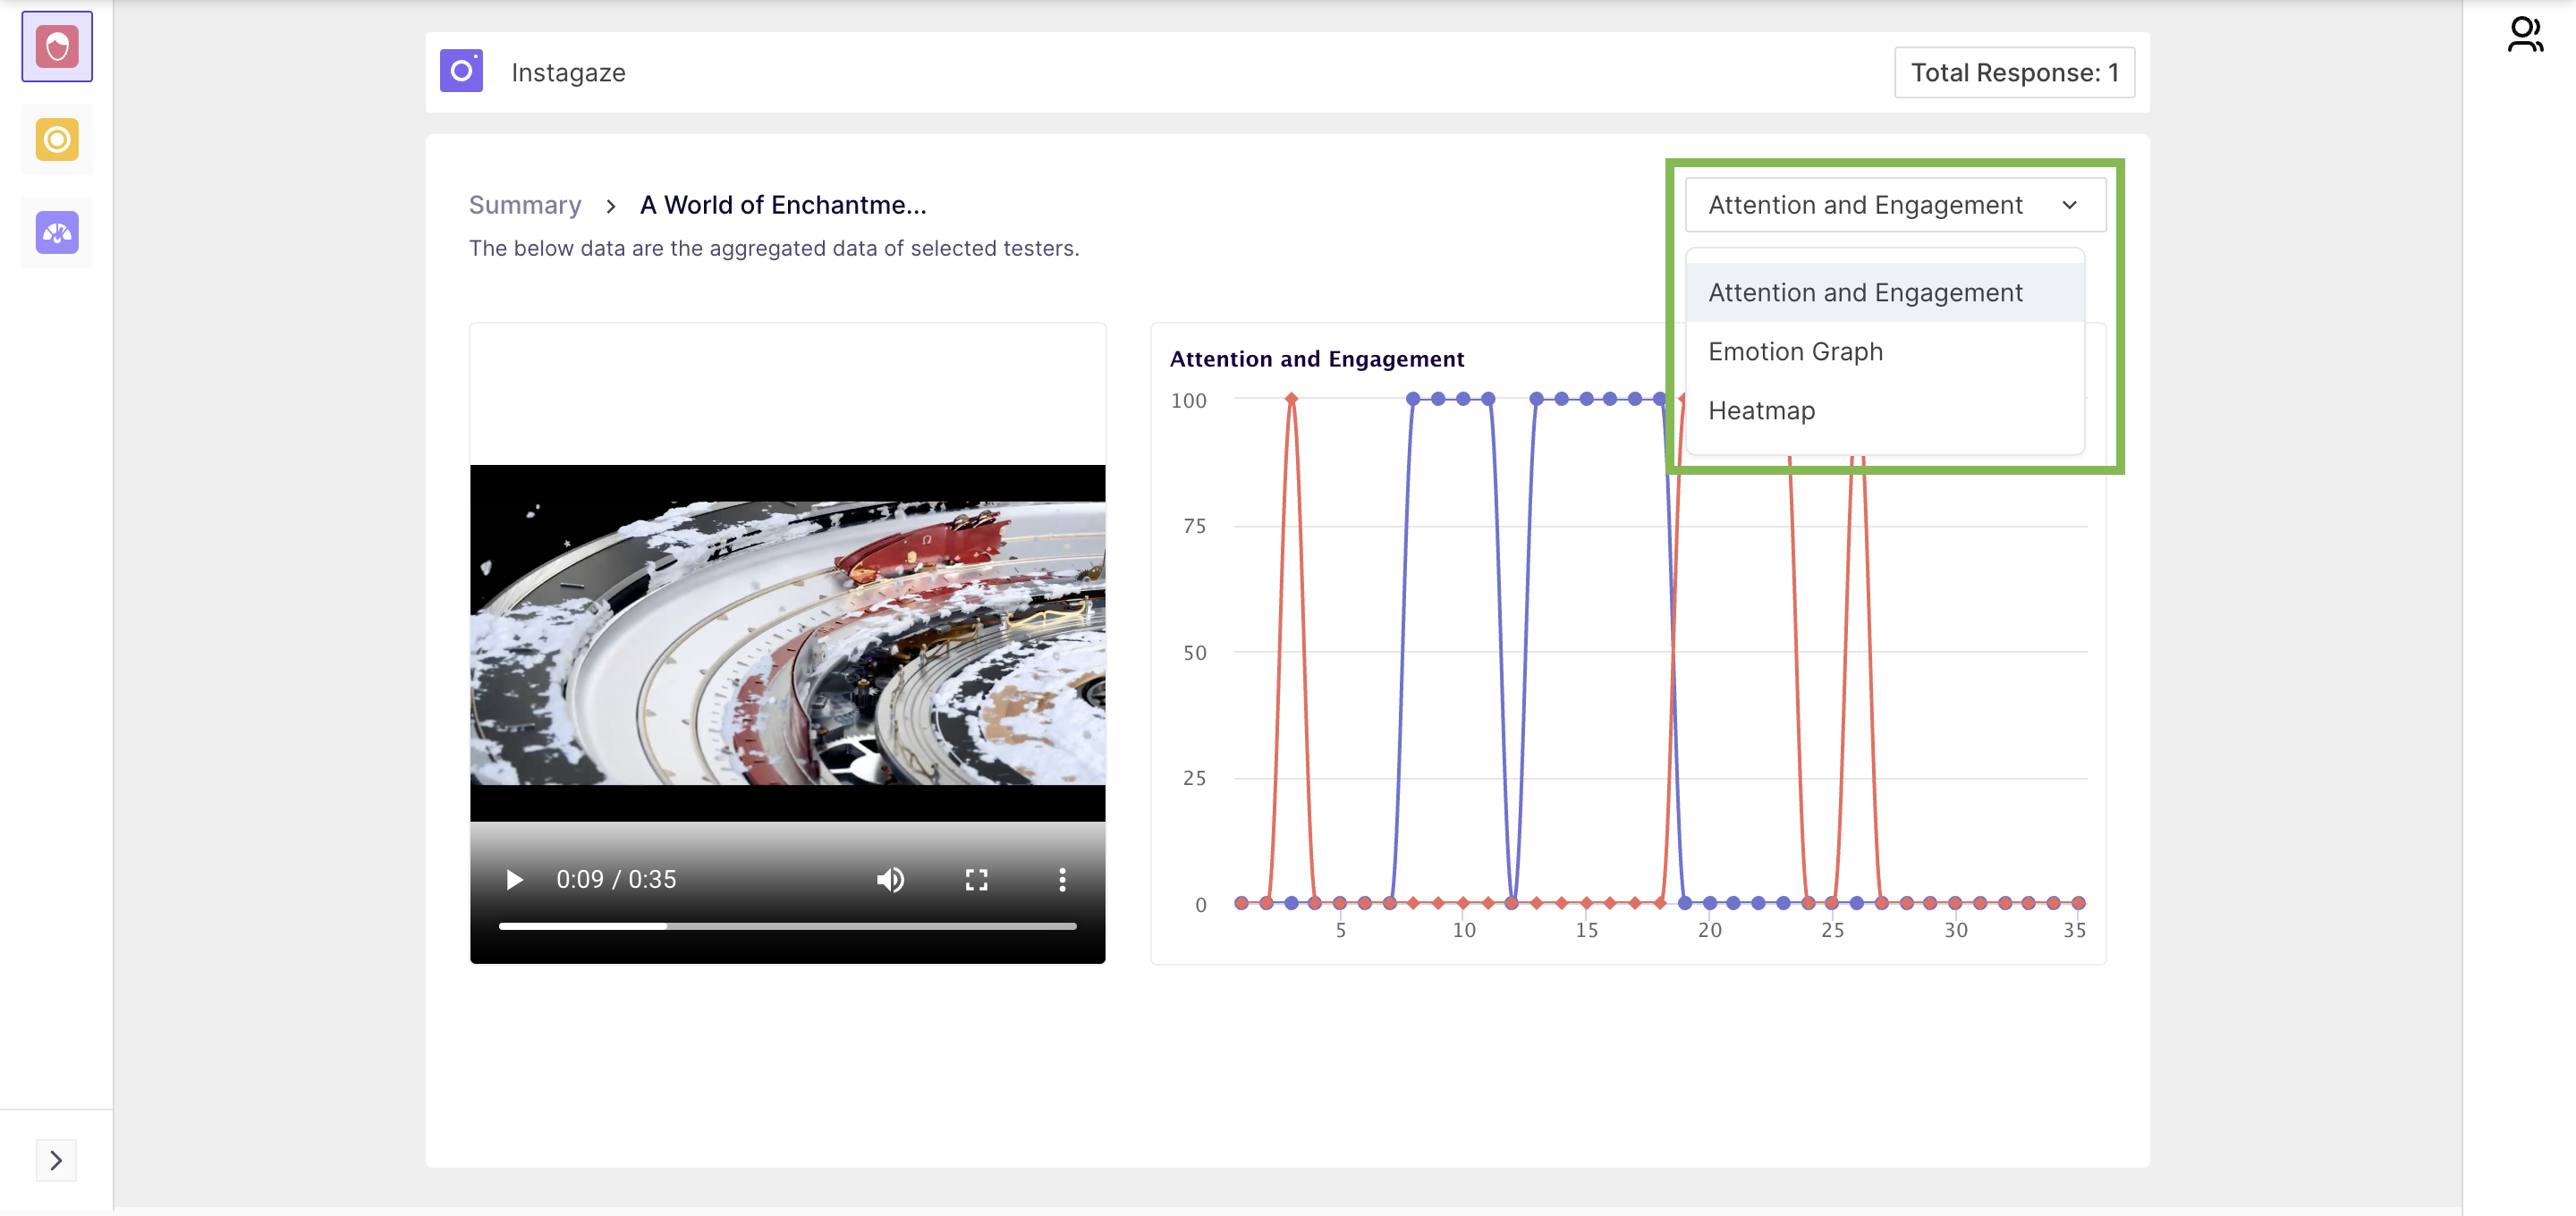
Attention and Engagement Graph: Visualizes user attention and engagement levels throughout the duration of the creative.
Emotion Distribution Graph: Illustrates the emotional responses exhibited by viewers across different sections of the creative.
Eye-Tracking Data Insights: Provides valuable insights derived from eye-tracking technology, including:
- Heatmap: Visual representation showcasing areas of highest visual focus within the creative.
- Transparency Map: Detailed insights into user gaze patterns and attention distribution.