Result of Qualitative Study
Overview
Decode is a powerful tool that helps businesses improve their meetings by unlocking valuable insights and data. With its advanced technology, Decode captures a transcript of the meeting recording and provides features like translation into 100+ languages, splitting, merge edit them. Users can then review the transcript and gain valuable insights into the meeting, such as the most frequently used words, sentiment analysis, and action items. In addition, Decode uses facial coding and eye tracking to capture participants' emotional responses and visual attention, providing users with a detailed analysis of the emotion displayed during the meeting, engagement and attention and other analytics needed to make informed decisions.
In this article, we will walk you through the steps of accessing the insights of the meeting recording.
Steps
Step 1: Once you log in to your Decode account, you will be directed to the dashboard.
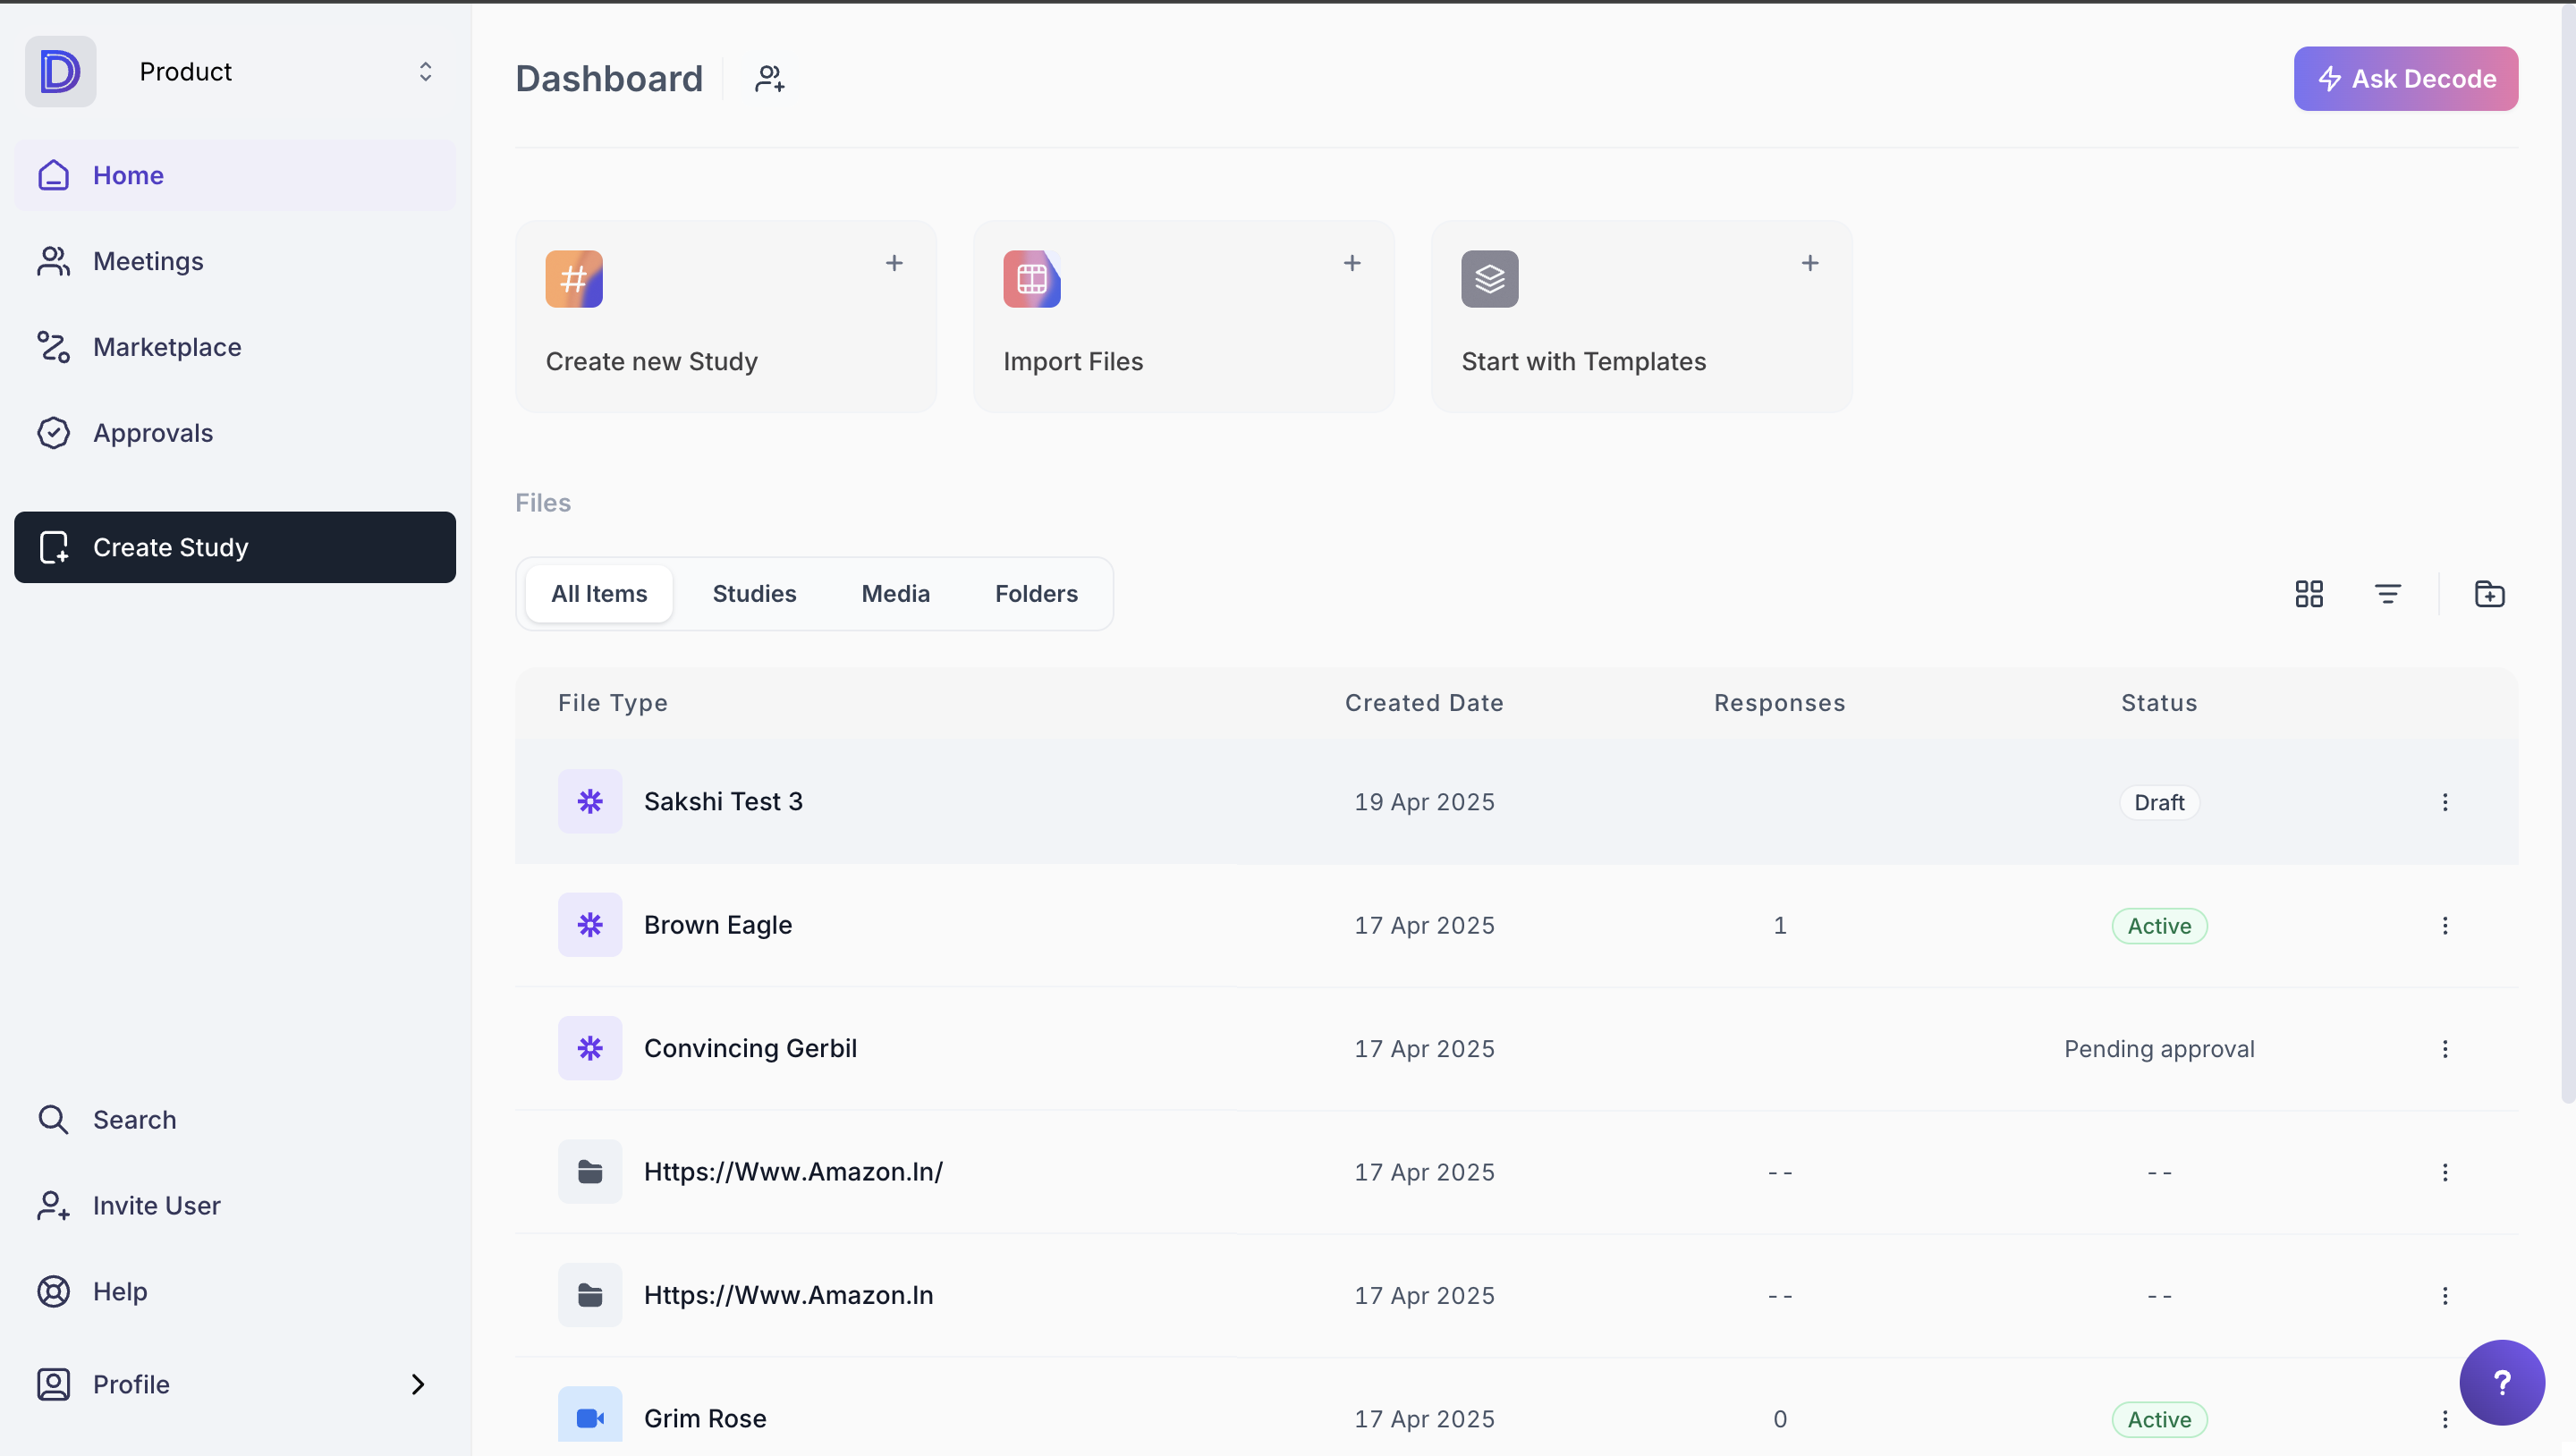
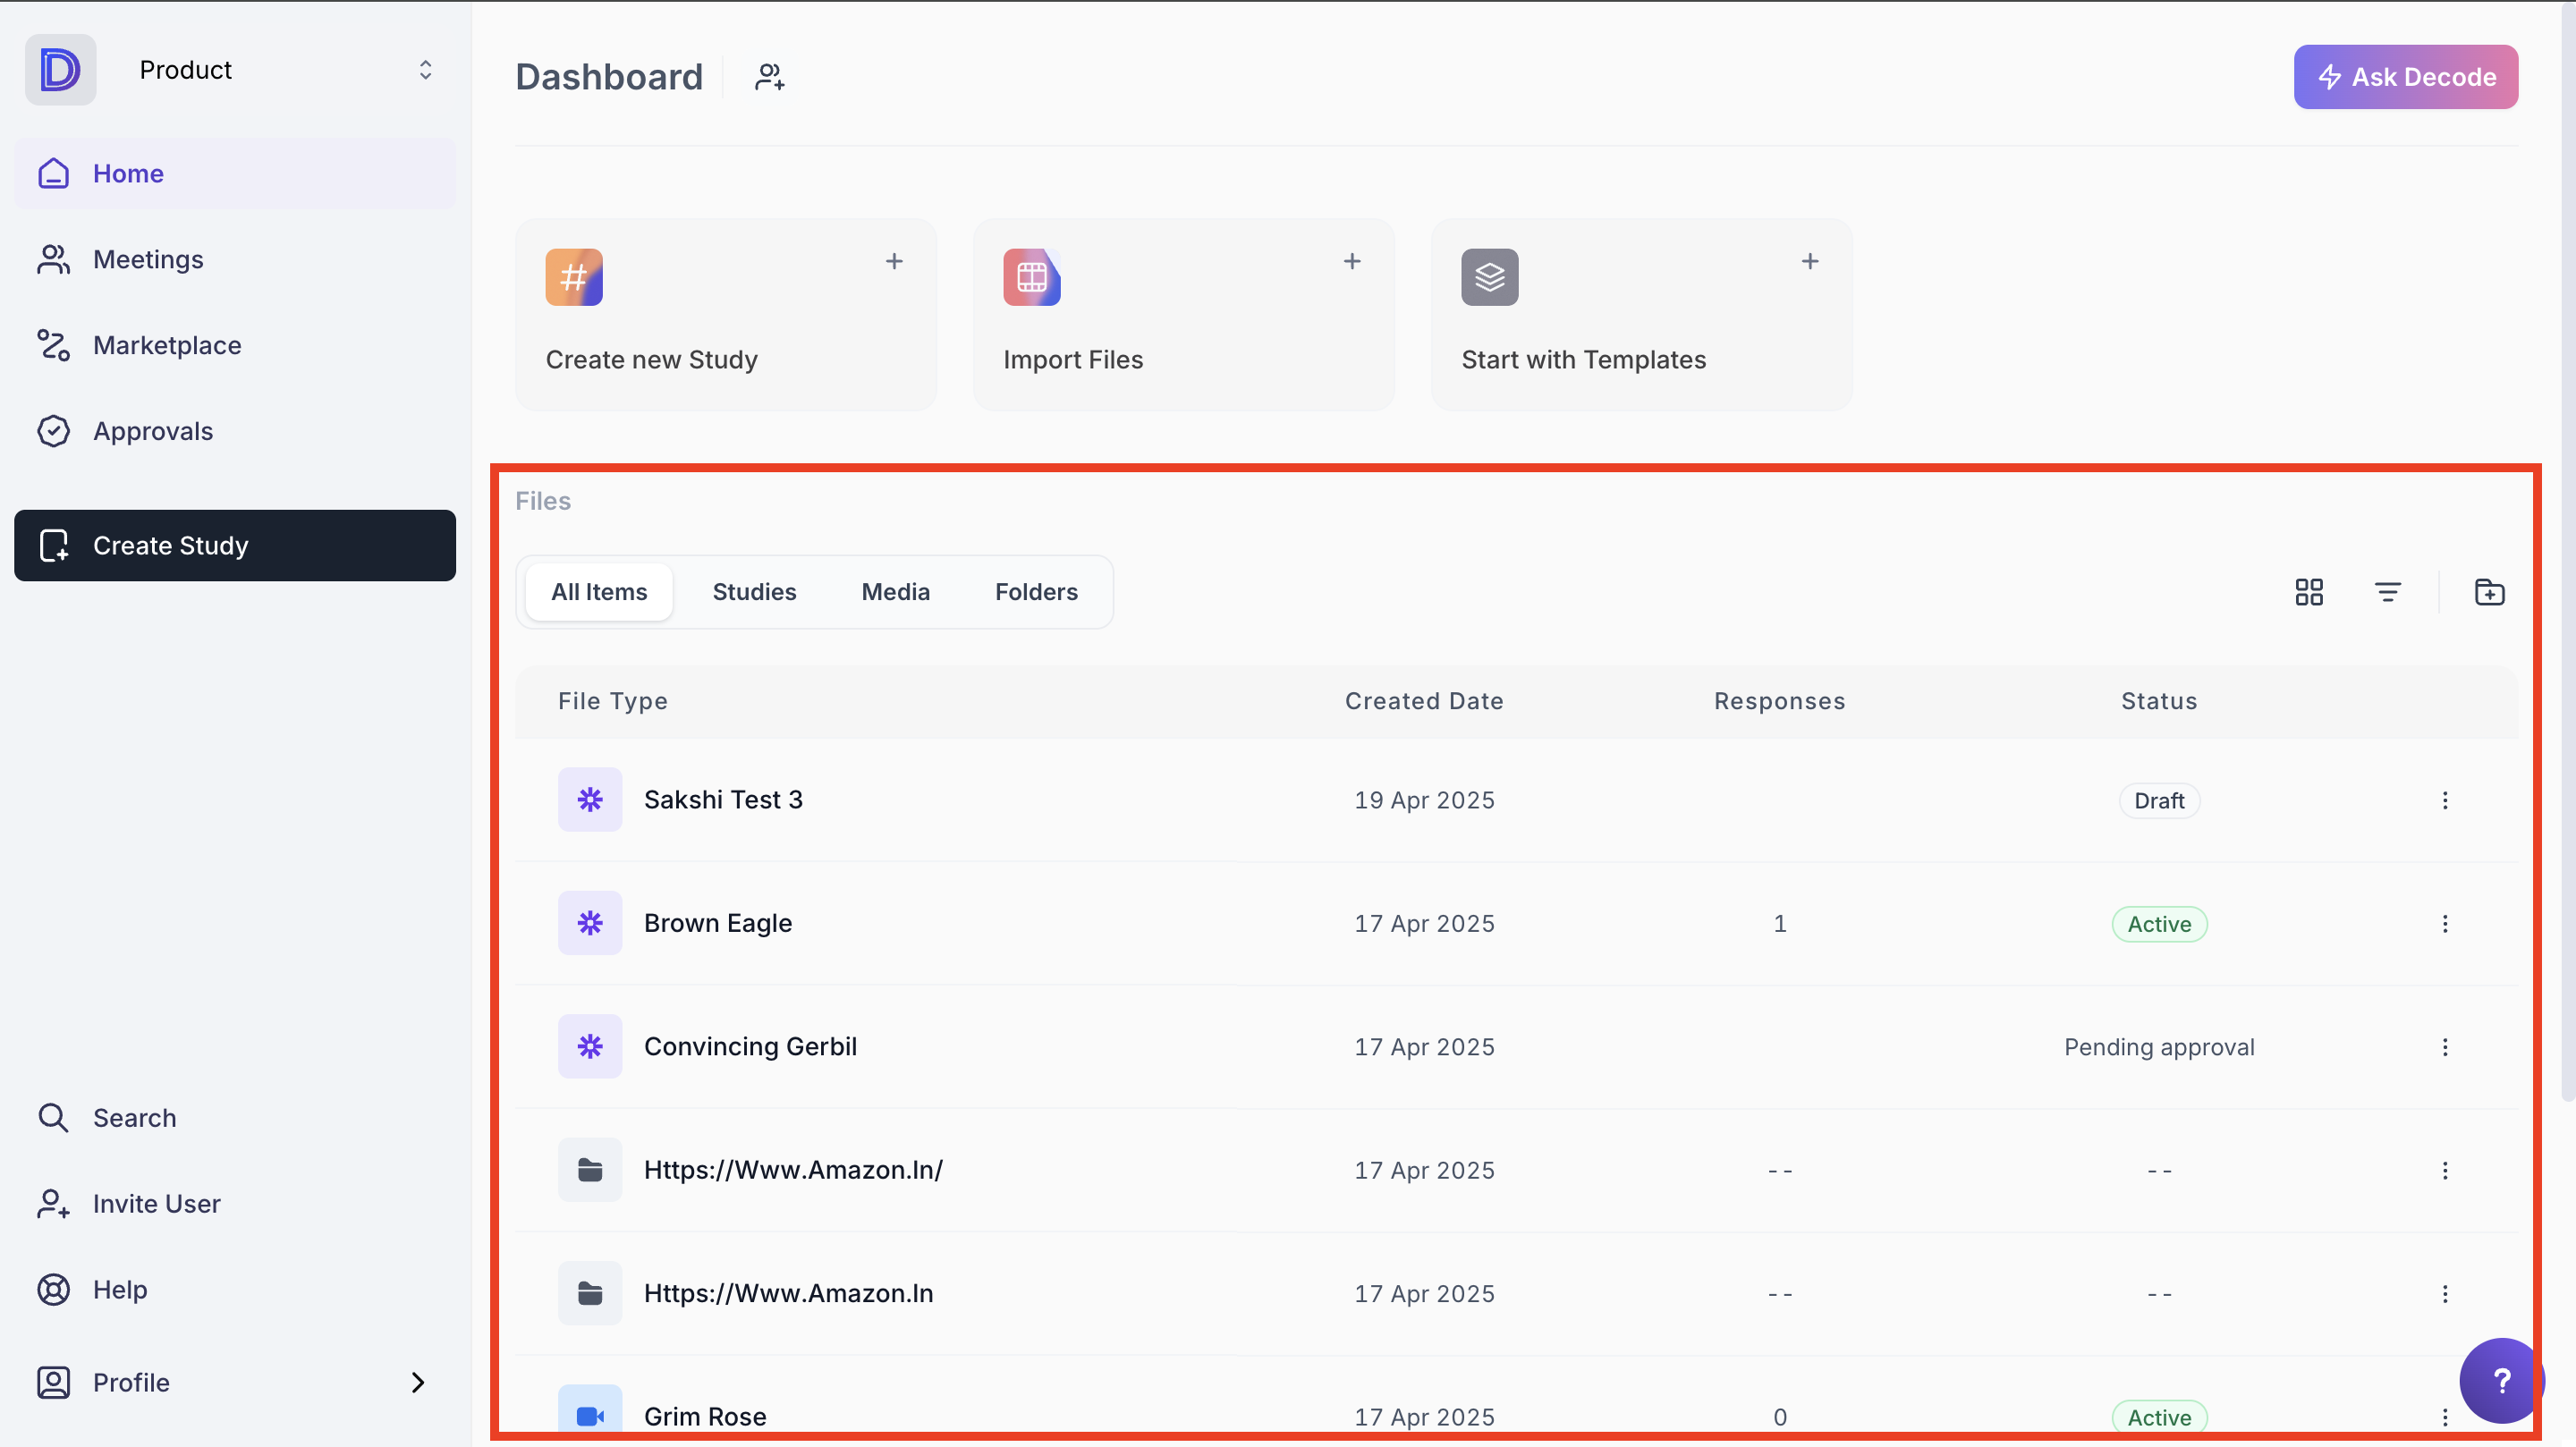
Step 3: You will see all the accessible studies and media in the files section. Click on any active or closed qualitative study to open it.
Step 4: Once you click on the qualitative study, you will arrive at the study creation page.
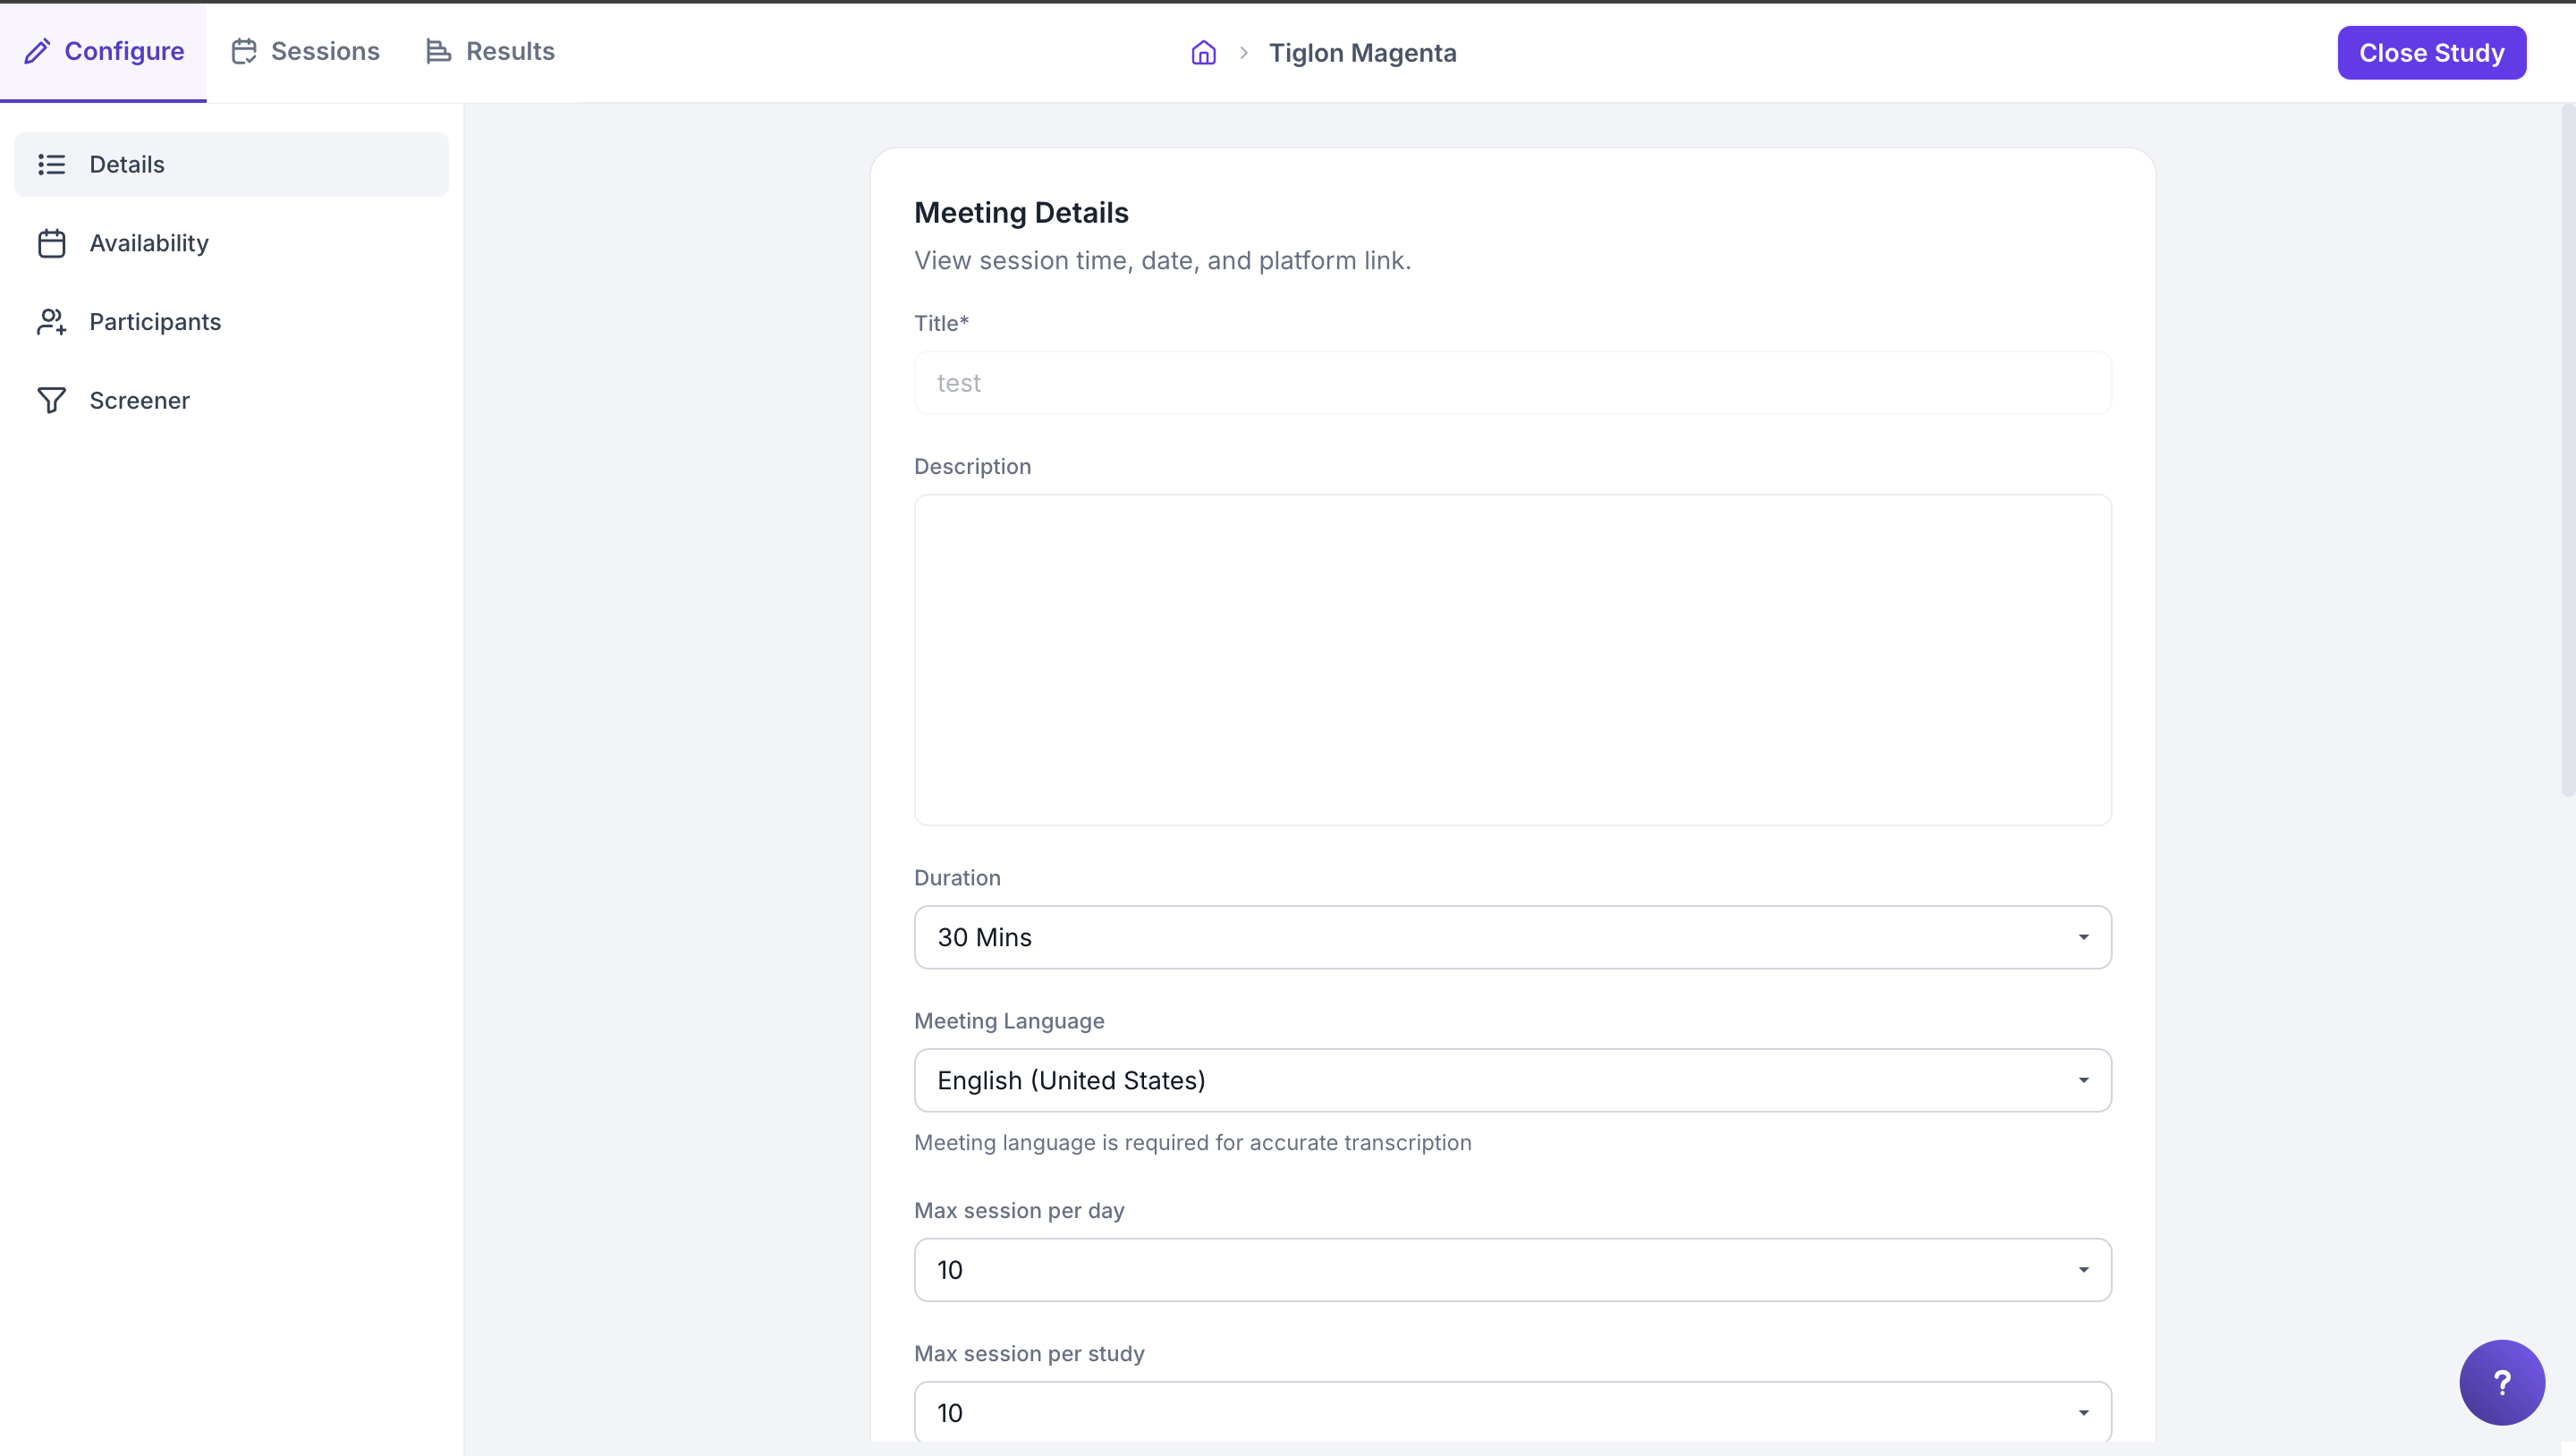
Step 5: Navigate to the "Results" page from the top navigation panel. On this page, you will find the recording of the meeting conducted in the decode platform, as well as the media uploaded in the study from your device or from the decode library.
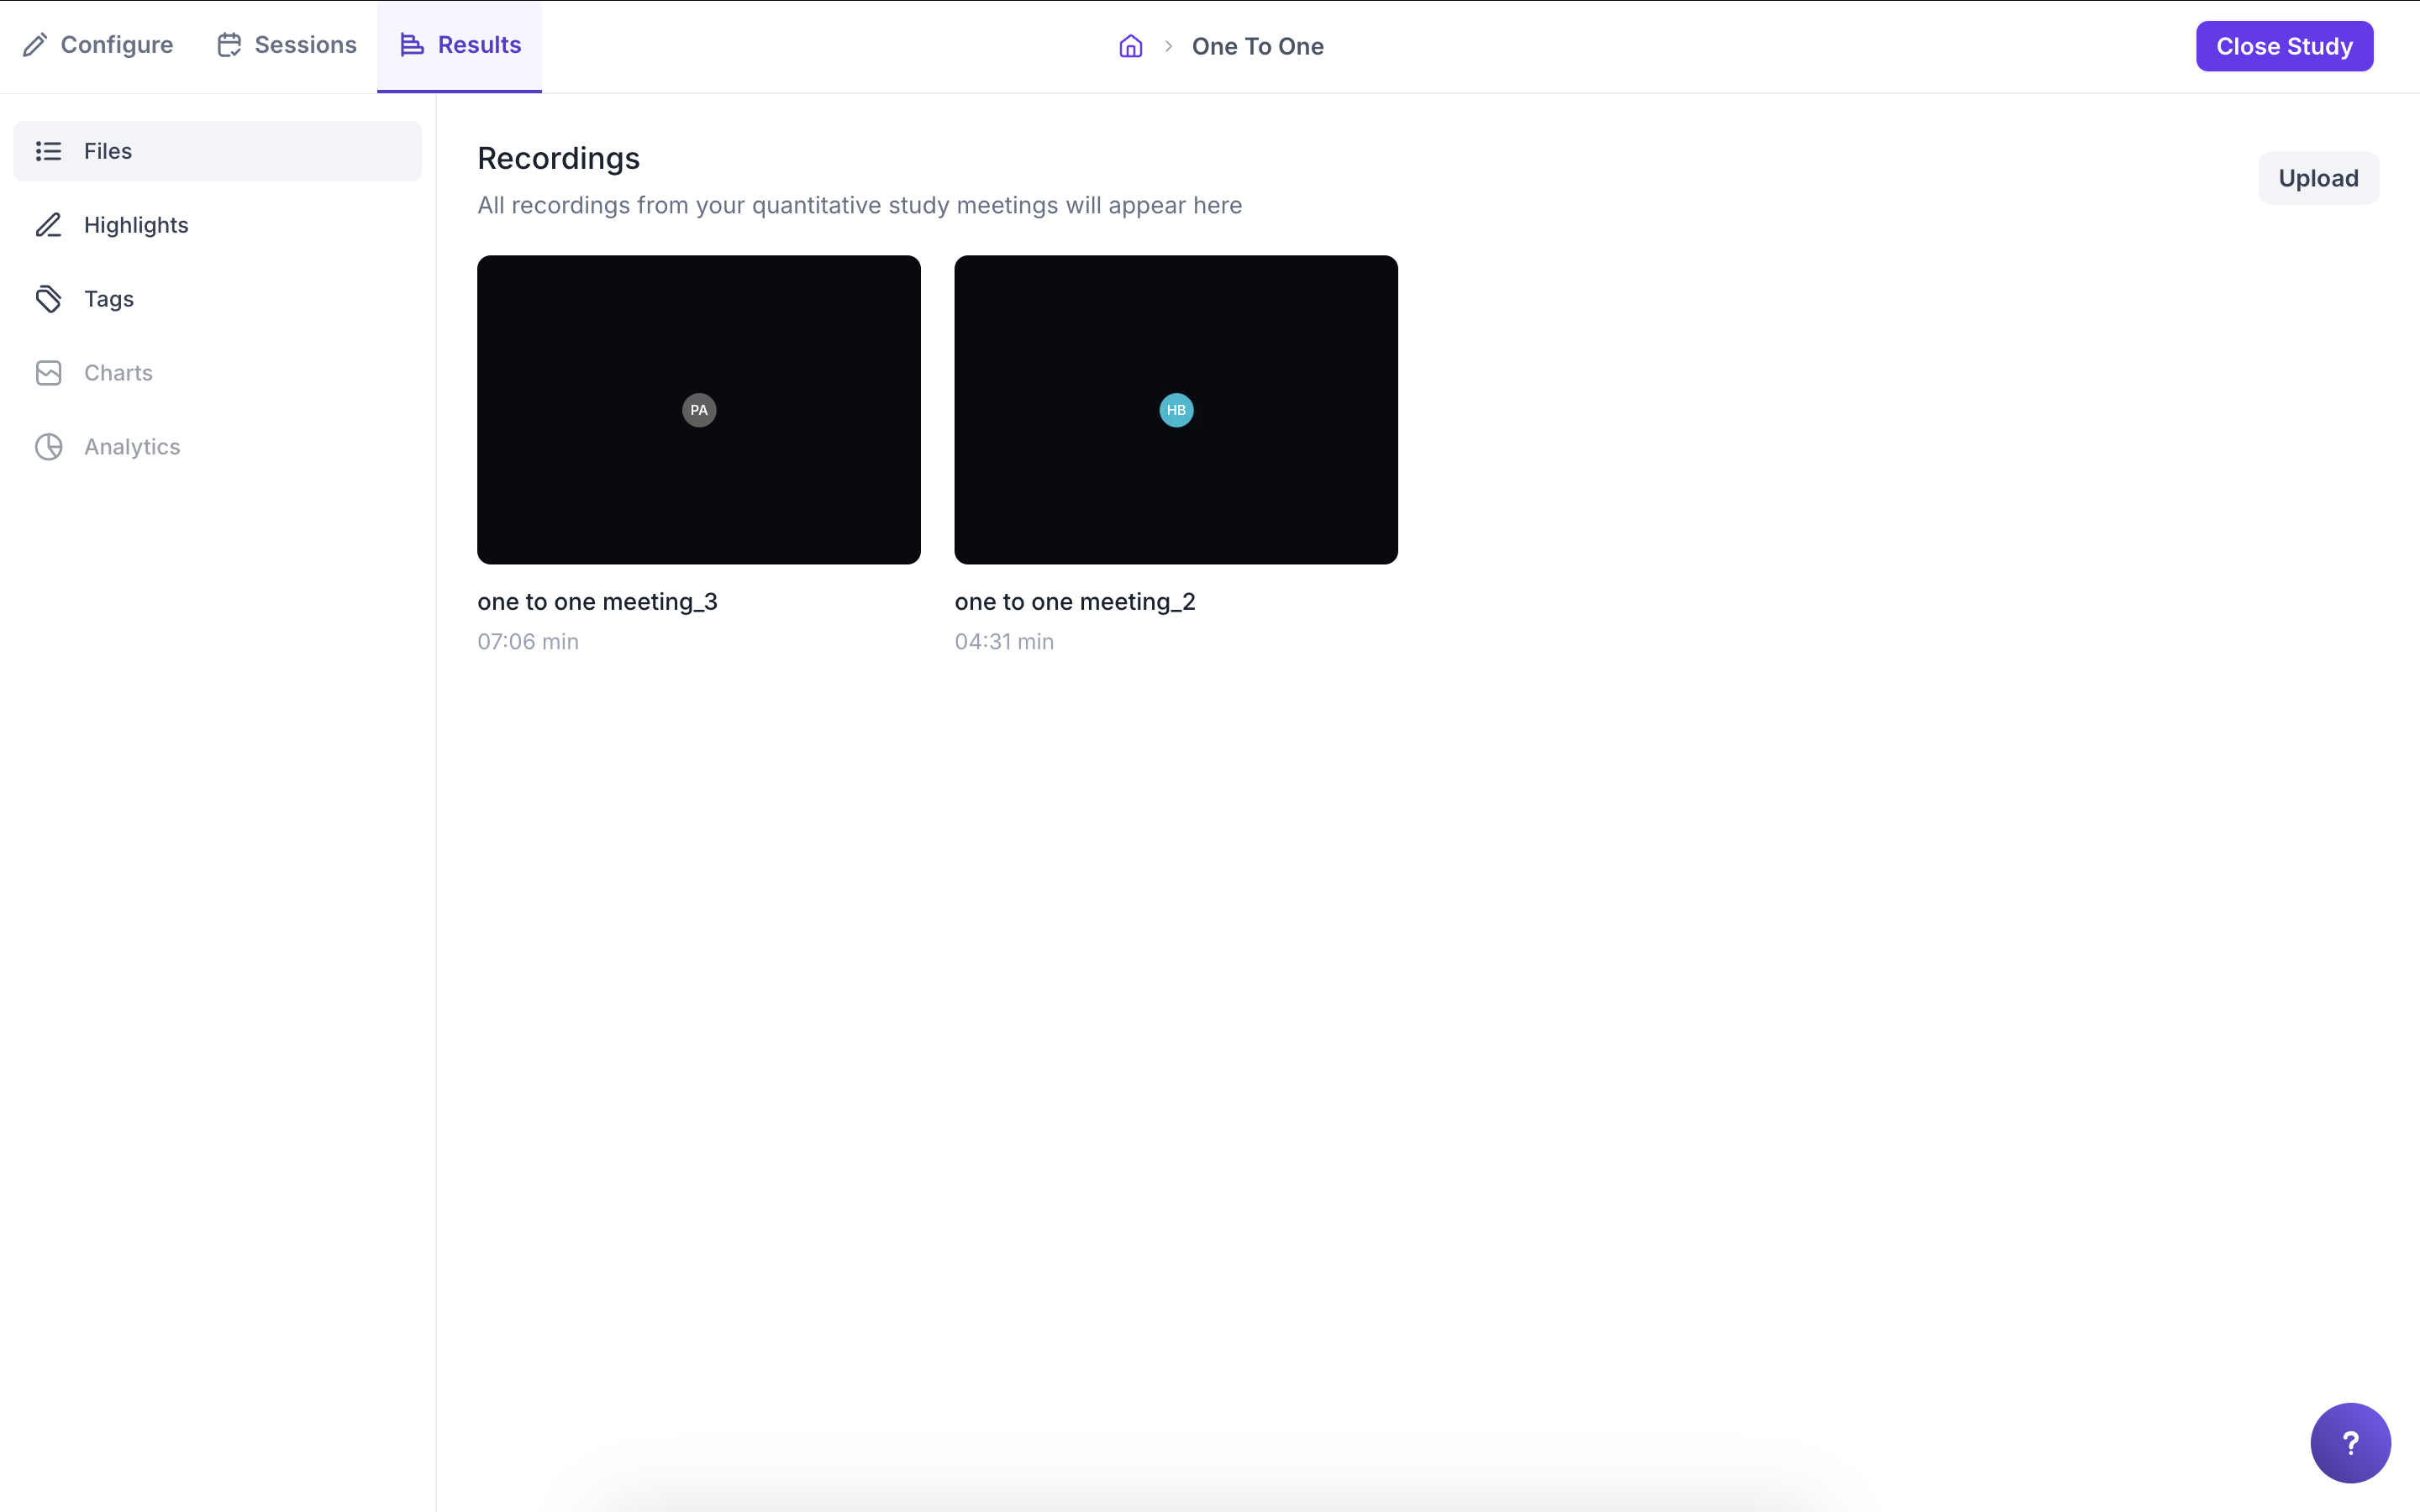
Step 6: To view the analytics of the recording, click on the recording card. This will take you to the recording details page.
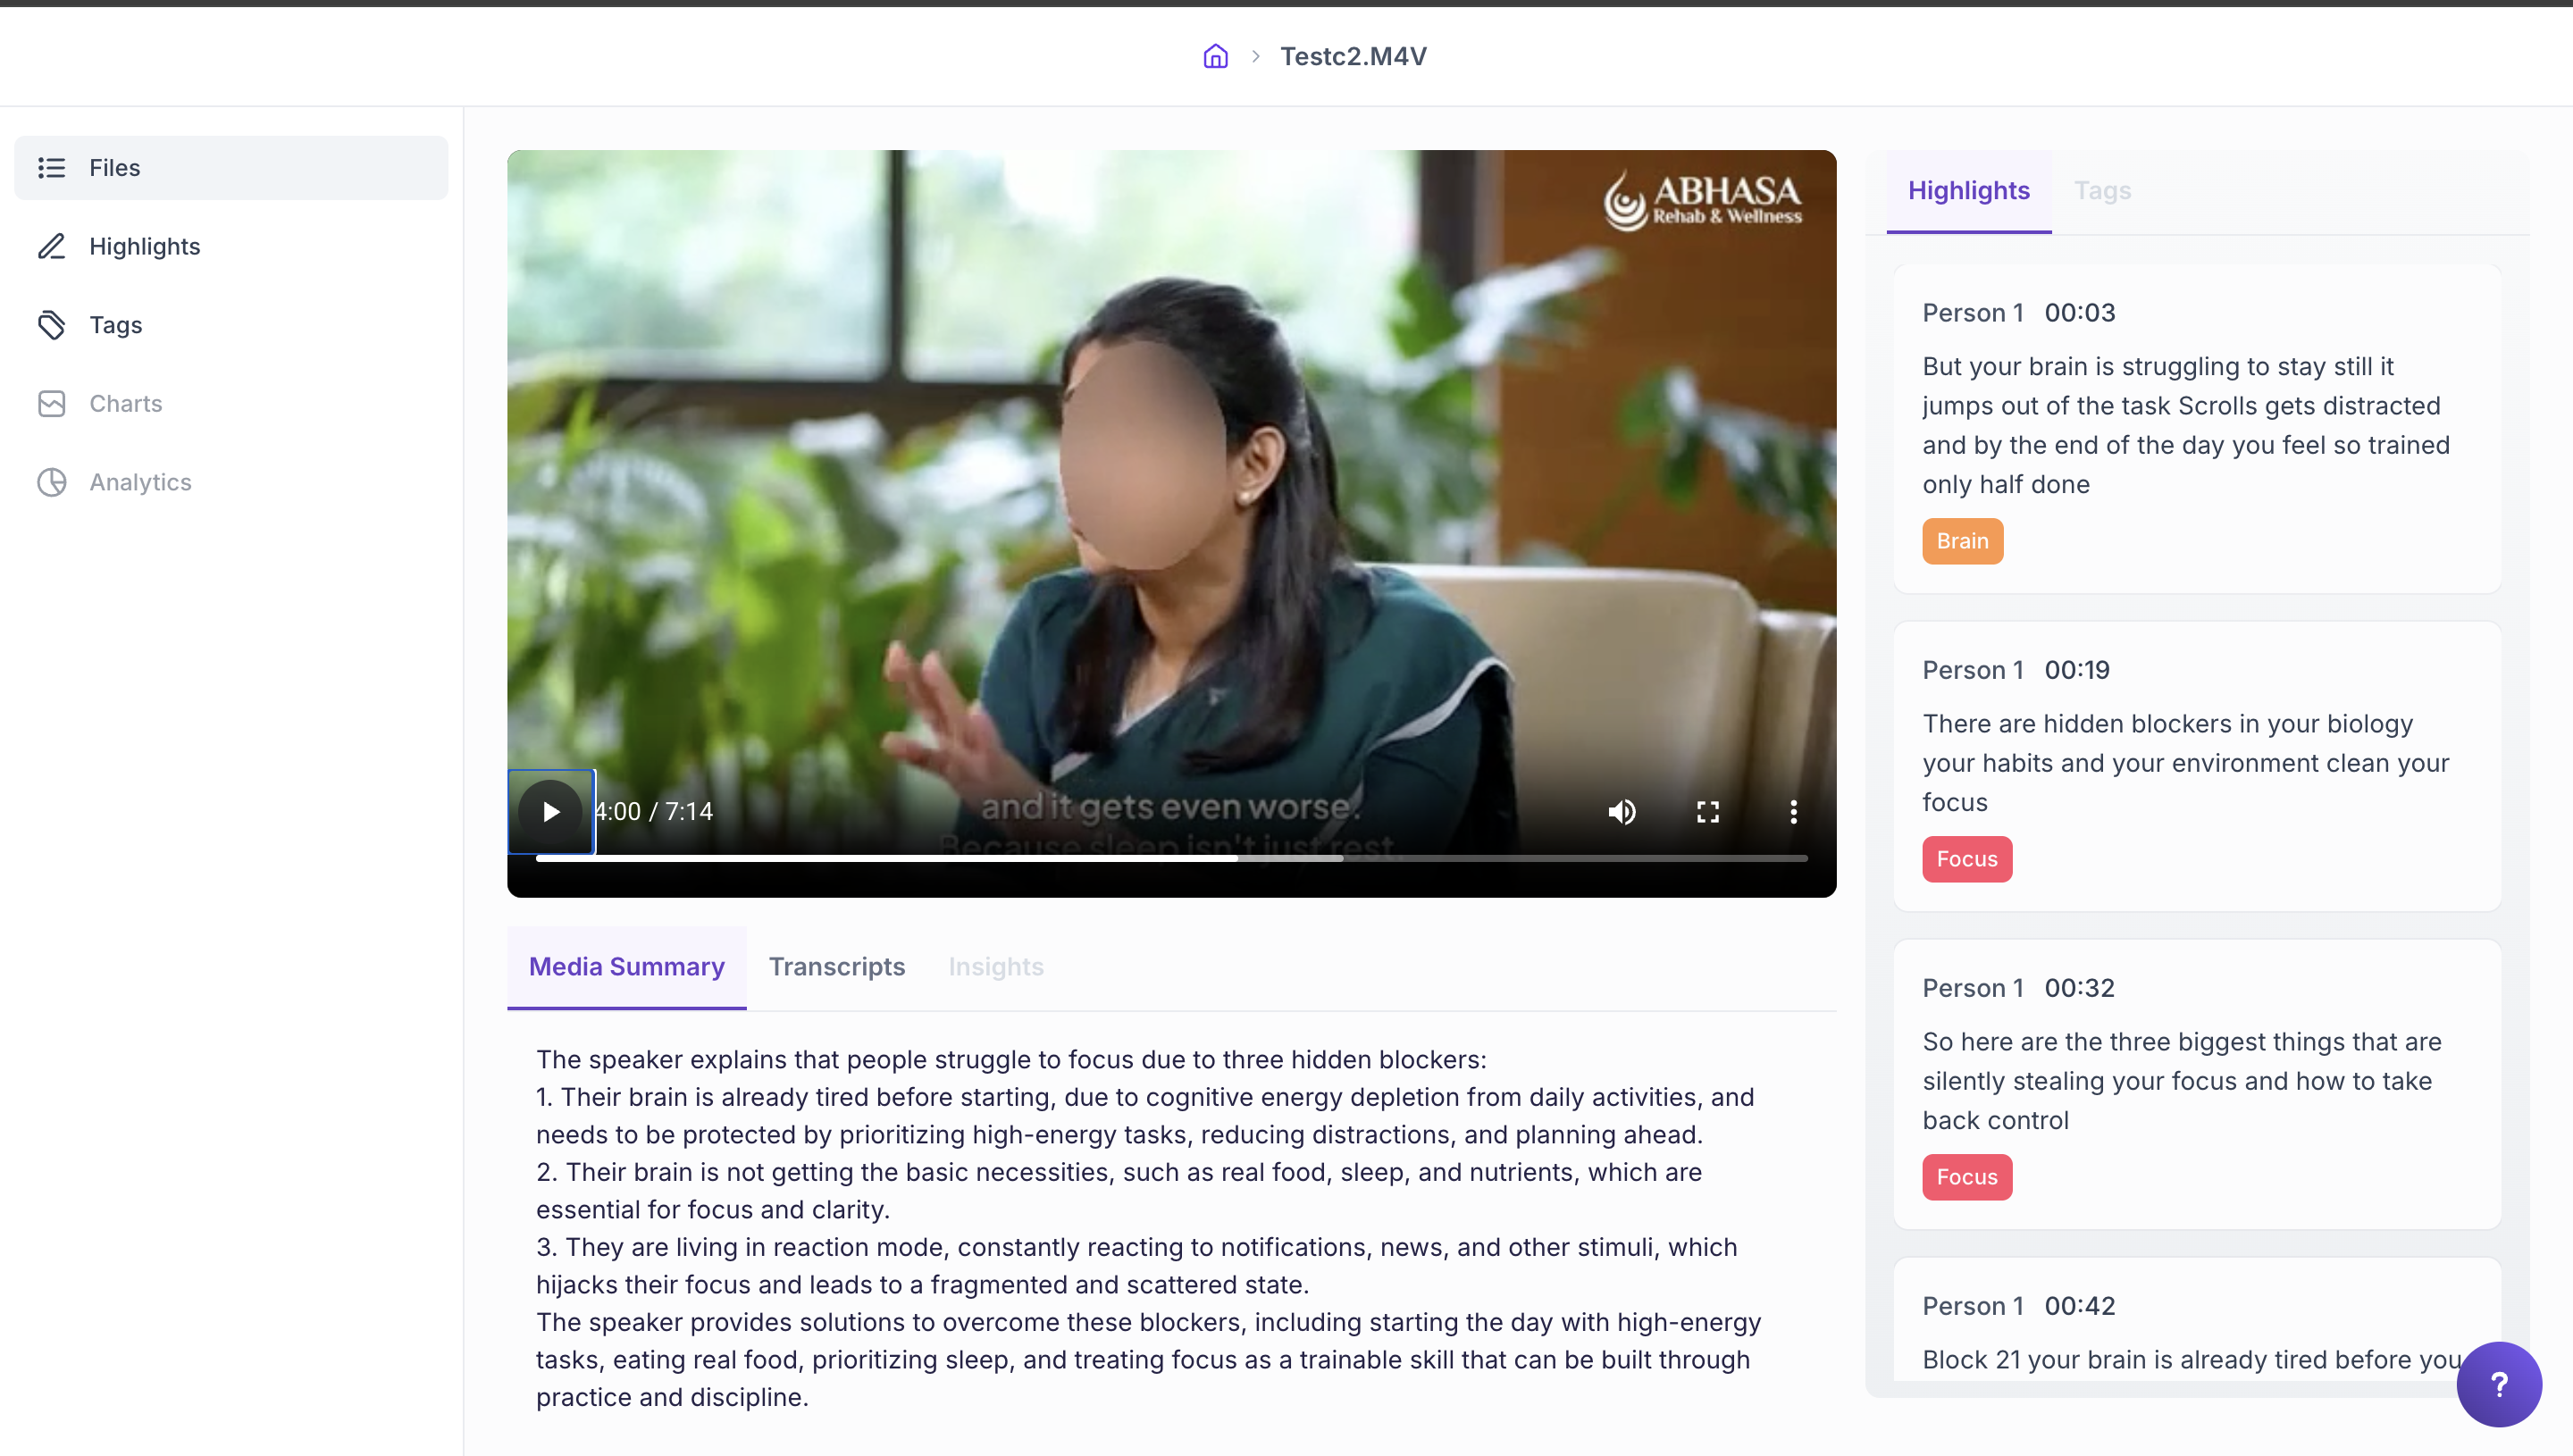
Step 7: On the recording details page, you can view the media details, Media Summary, and any existing highlights.
To view the transcript, select the "Transcripts" option from the bottom bar.
The left navigation panel allows you to access different recordings and media within the study, while the right navigation panel gives you access to the following pages.
- Highlight page - view, download, share highlights and get insights
- Tags - View all the tags created and group them
- Analytics - view the overall analytics from the text, voice and facial data for the recording.
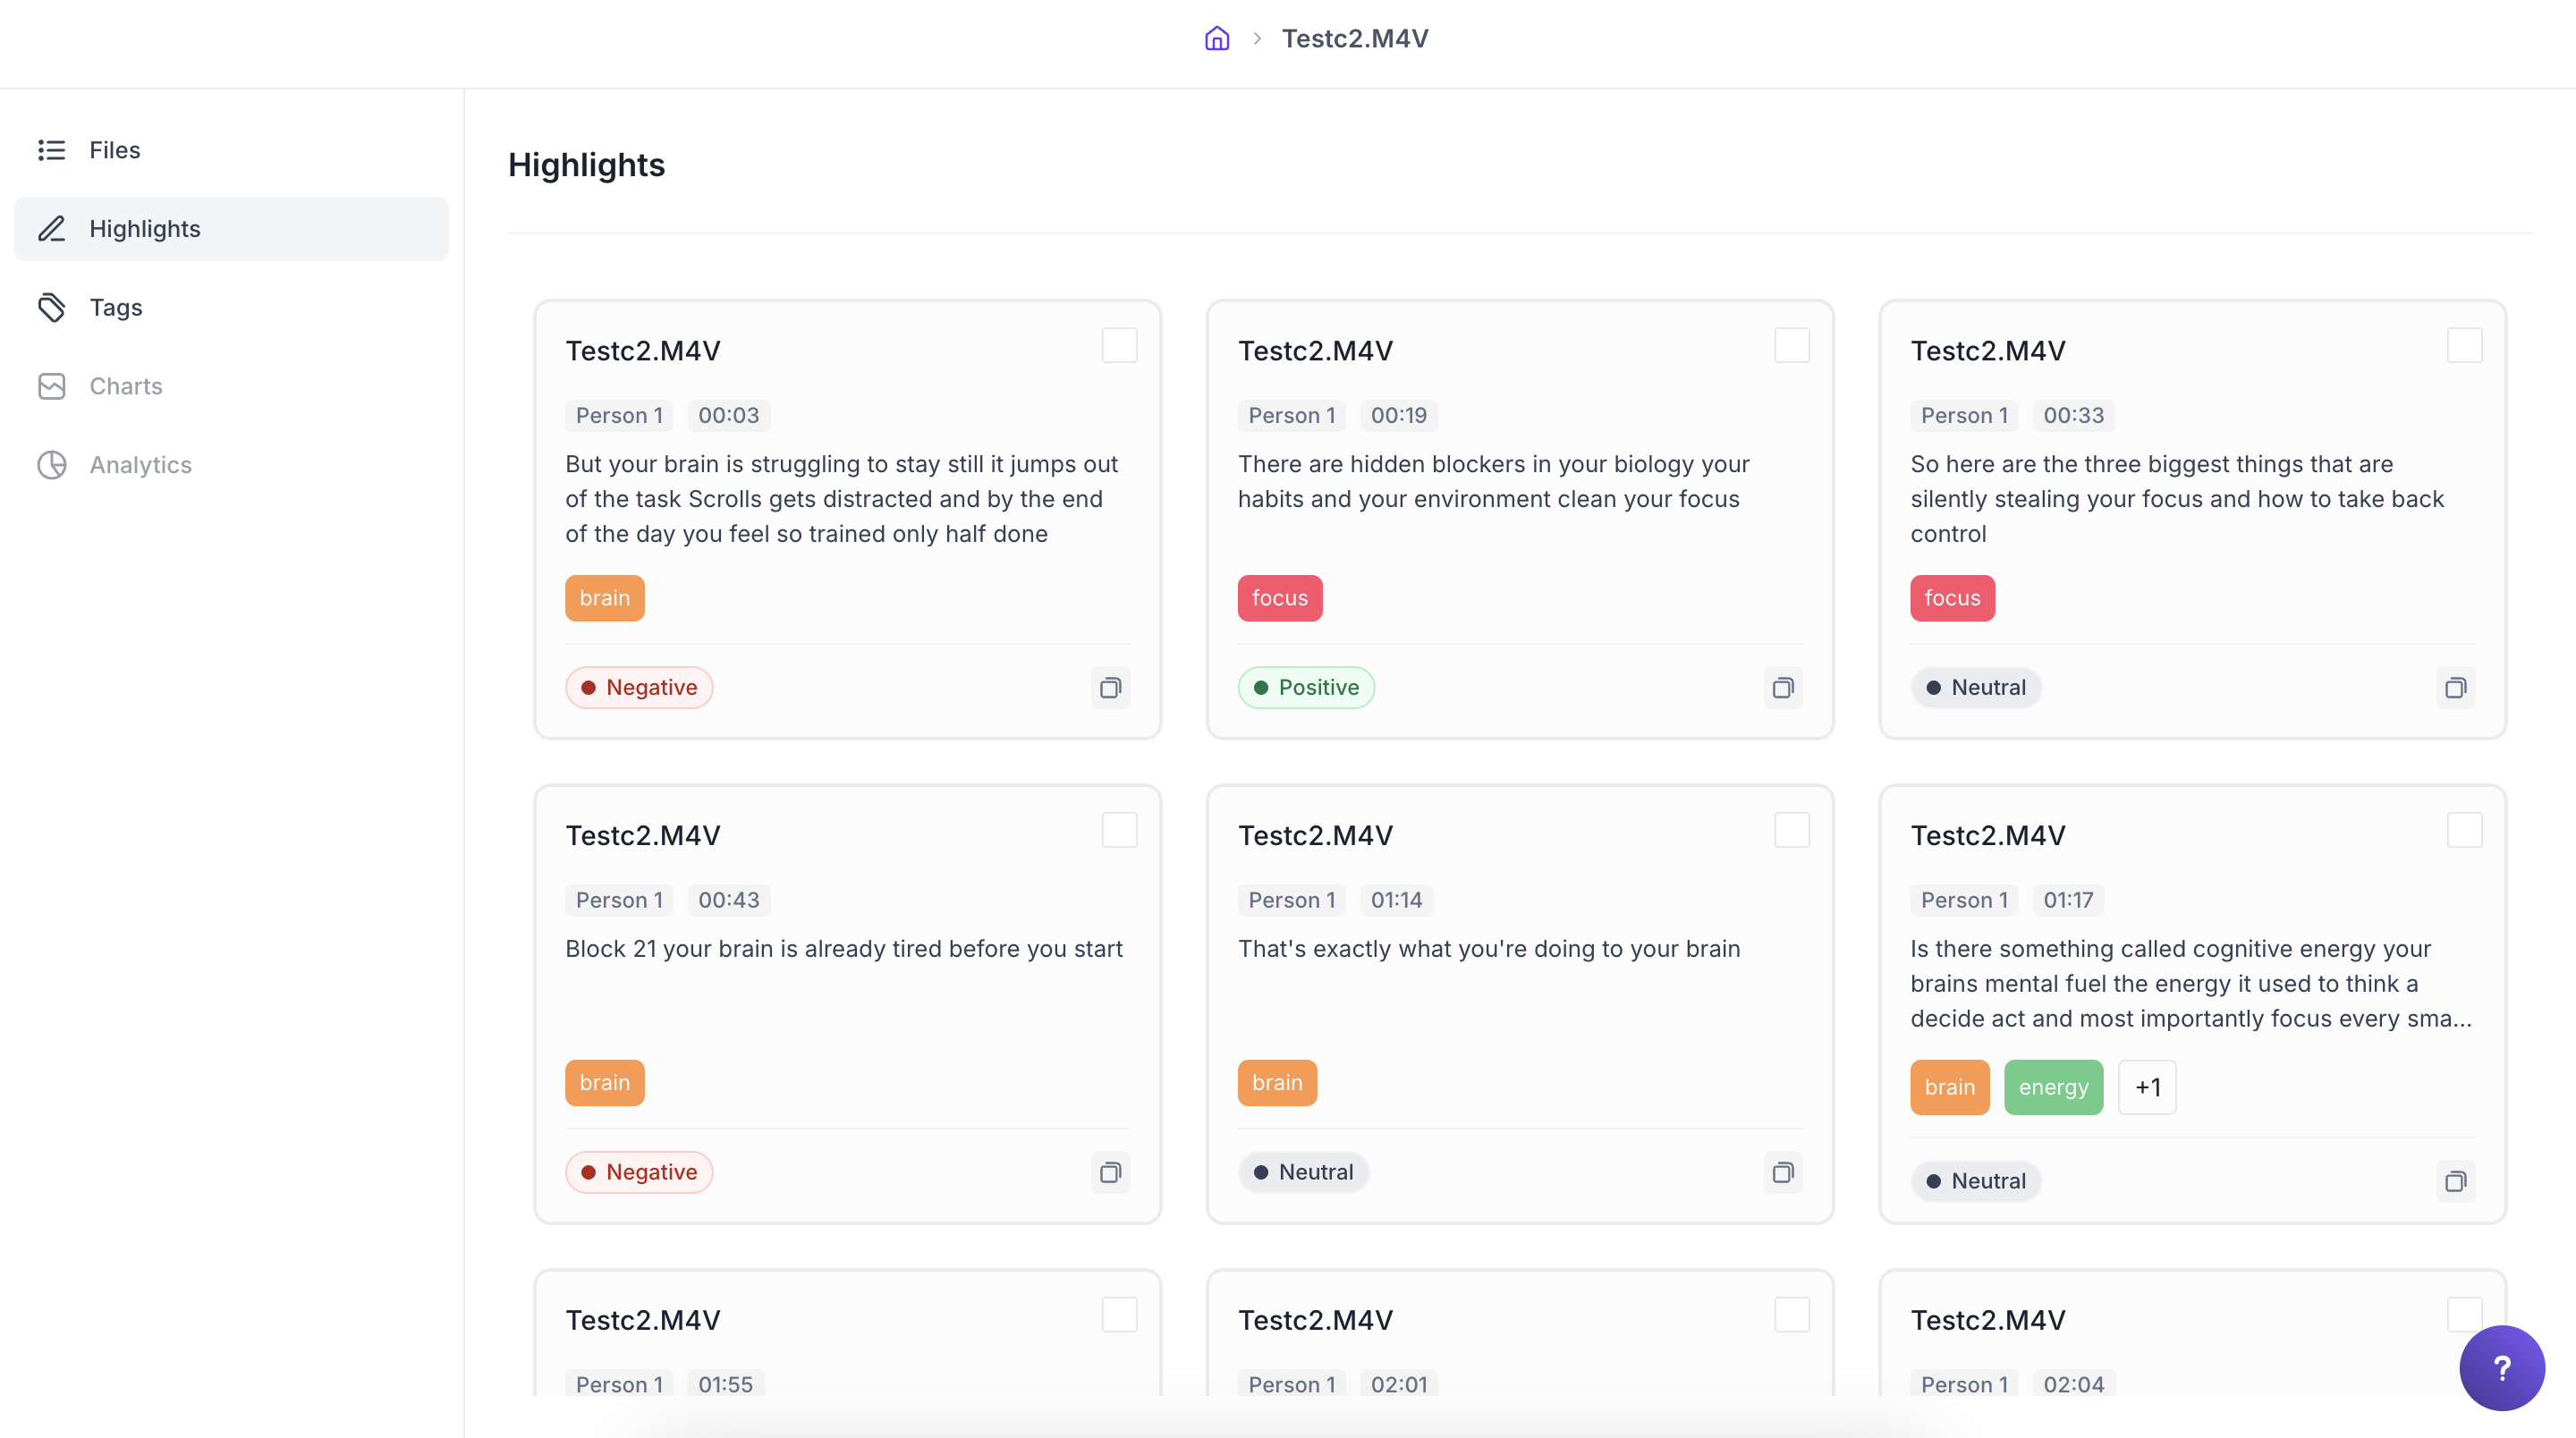
Highlight page
This page displays all AI-generated and manually created highlights from the transcript. You can also view associated tags and the dominant emotion detected in each highlight, providing a quick overview of key moments in the session.
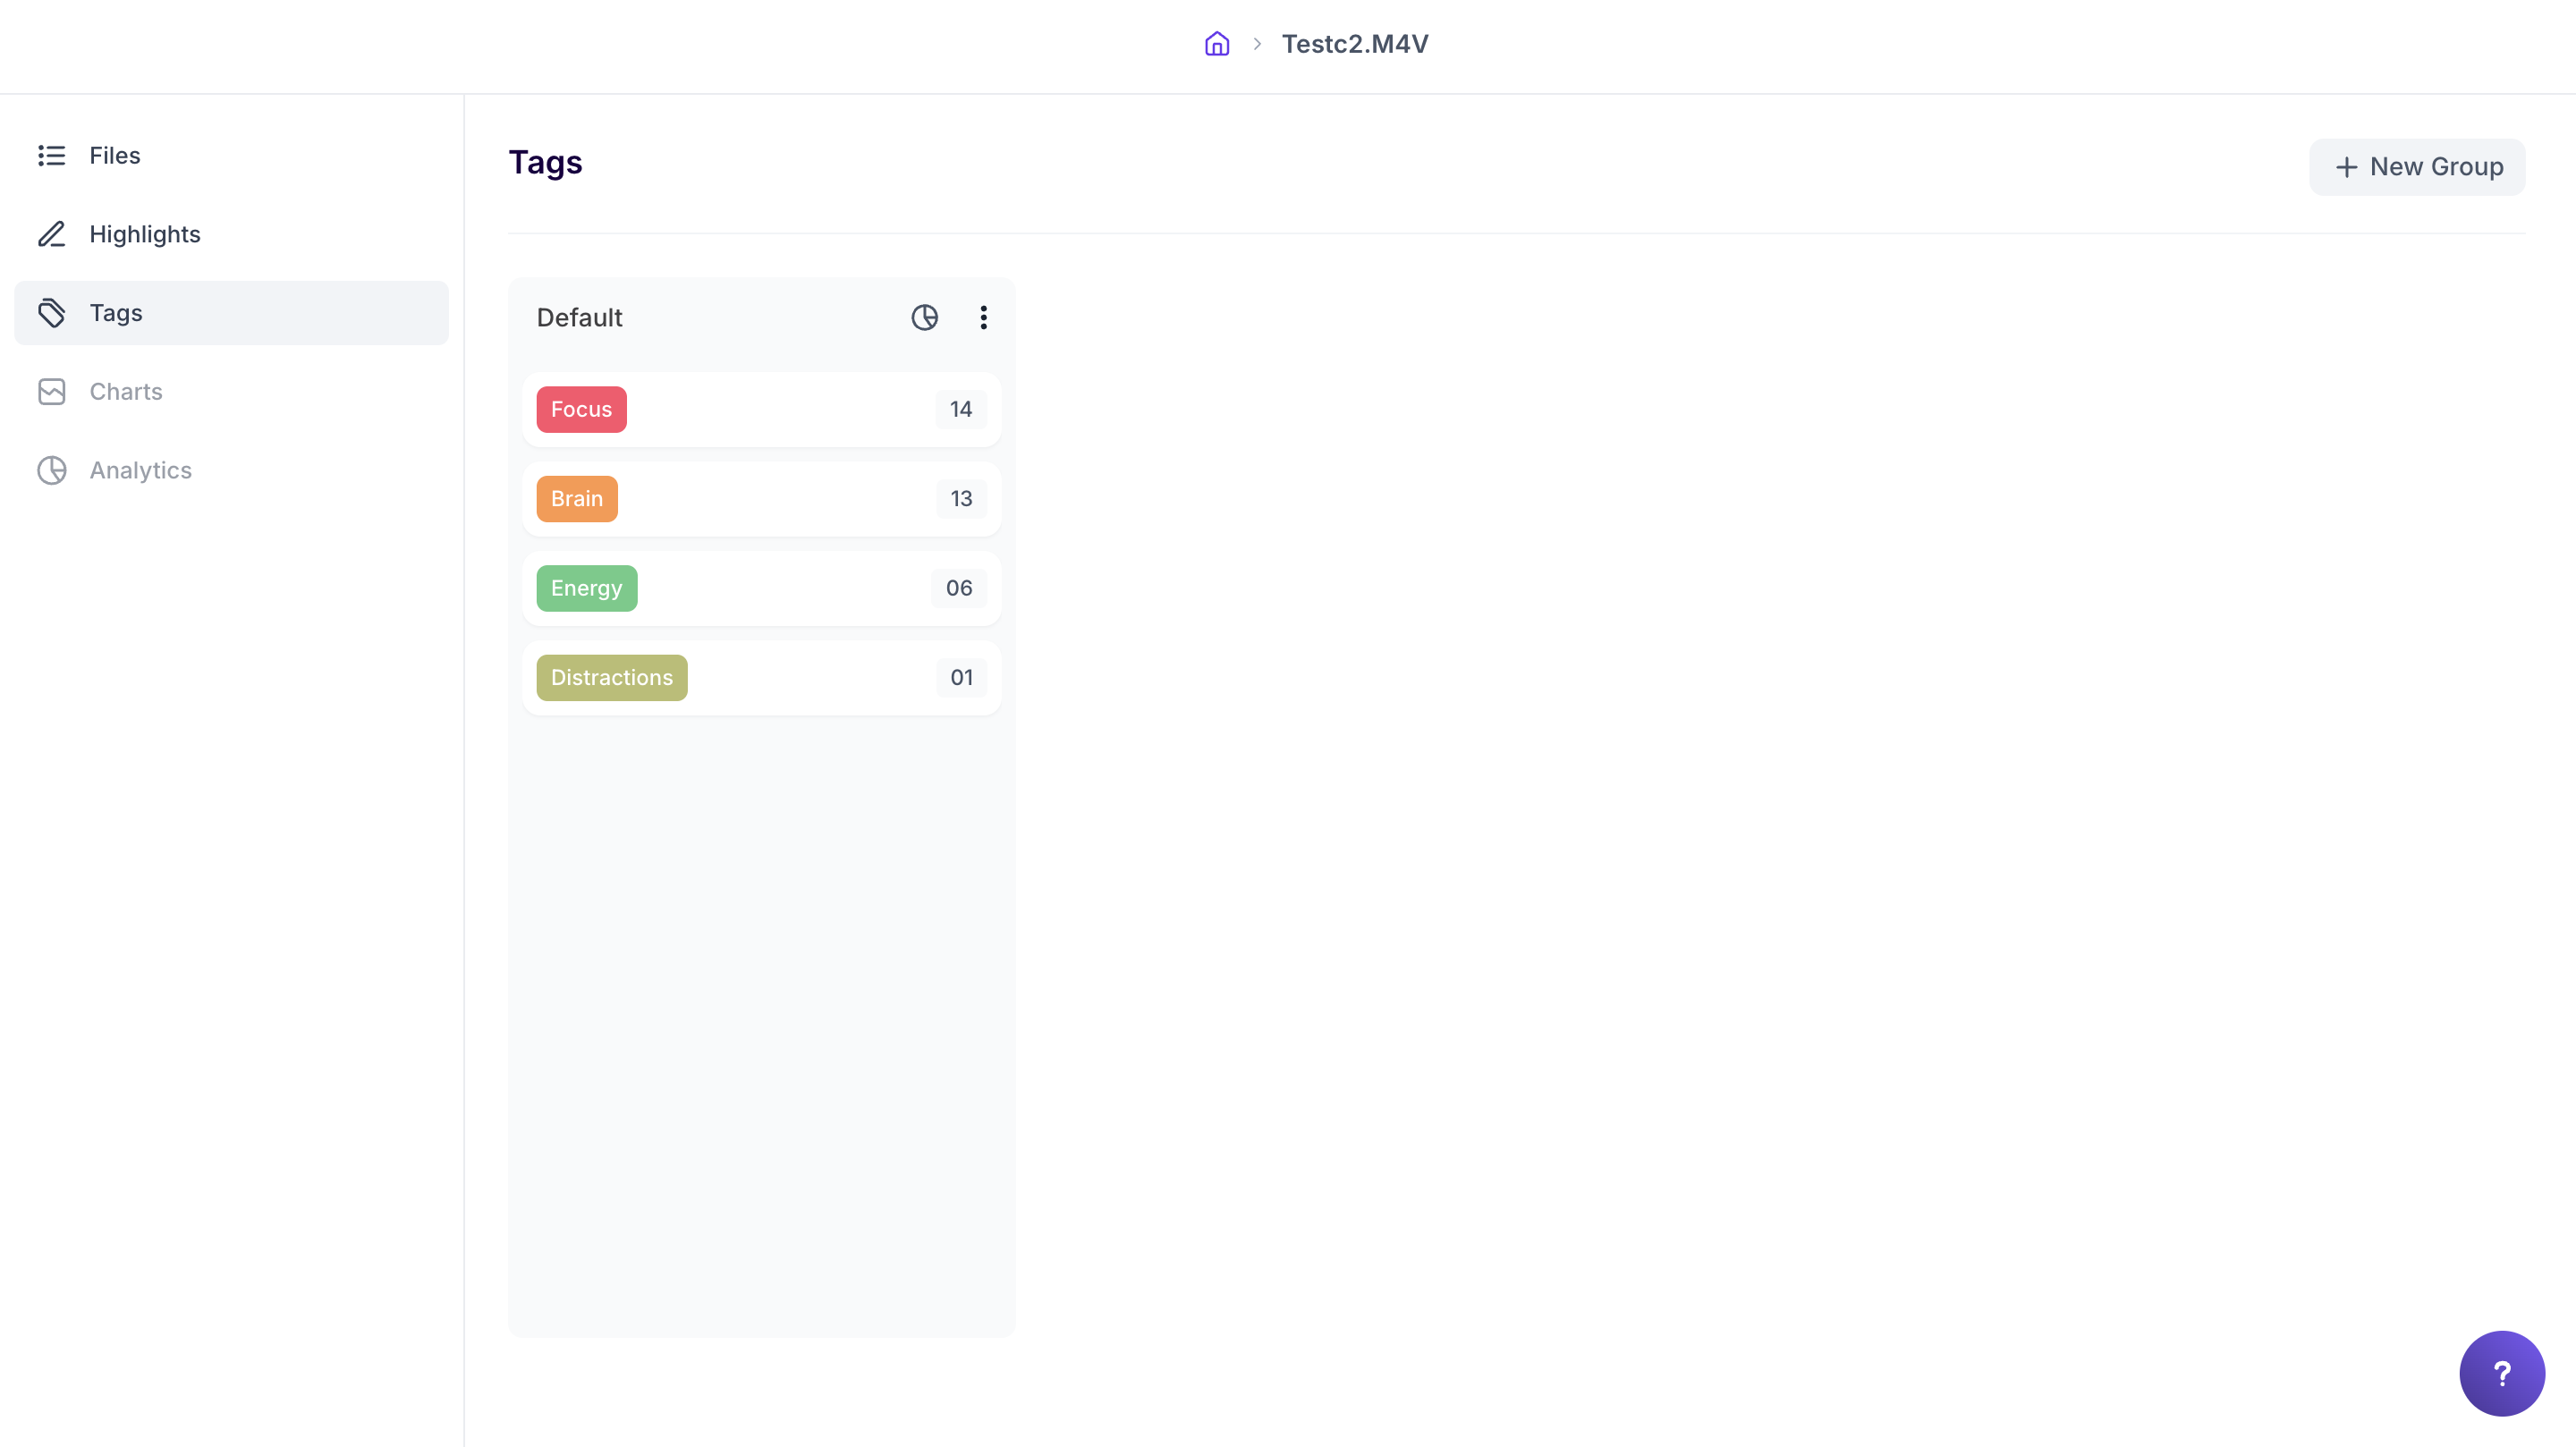
Tag Page
Explore all the tags linked to highlights in one place. You can sort and organize them into multiple buckets to uncover patterns and gain a more comprehensive analysis of participant responses.