
Decode Focus - Metrics and Definitions
In Decode Focus, four distinct metrics are calculated: Attention, Focus Score, Clarity Score, and Percentage Seen. Each metric is defined as follows:
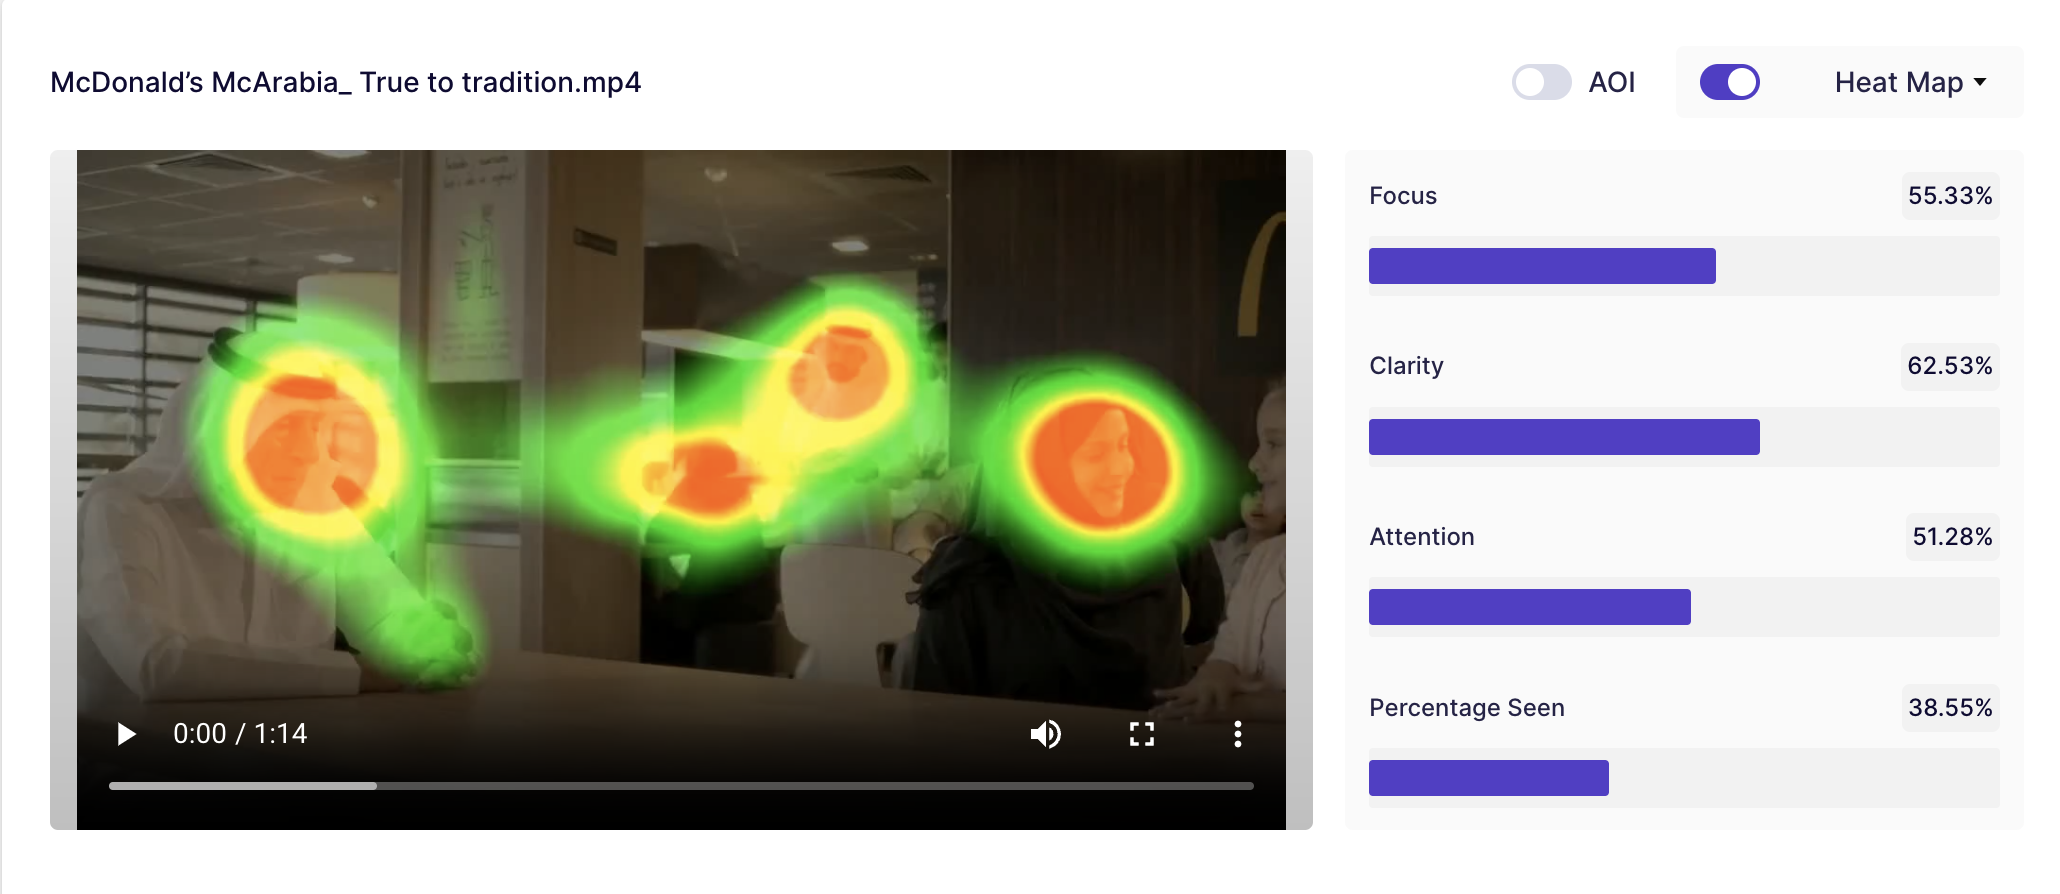
- Attention quantifies the overall interest the stimuli has received. It is calculated based on the intensity of heat maps. If there are more intense regions, the attention value will be higher.
- Focus Score quantifies the level of attention drawn by an image or video, indicating the consensus on its most captivating elements. Images/videos with numerous intriguing components tend to score lower, as attention disperses. Conversely, assets with fewer focal points garner higher scores, as viewer gazes converge on specific areas.
- Clarity Score tells you if your customers will easily understand your stuff or not. It helps you see how clear your message or visuals are, so you can make them better for your audience.
- Percentage Seen metric indicates the portion of an image that has been viewed, regardless of intensity values. It focuses on the percentage of the total area that a viewer would have observed.