
Upload Media Block
Overview
In Decode, you can also upload videos from your computer to your surveys seamlessly. With this video uploading feature, you can rest assured that your videos are securely stored and ready for use in your surveys. Once uploaded, record respondents' facial expressions and eye movements, giving you valuable insights into their reactions and preferences.
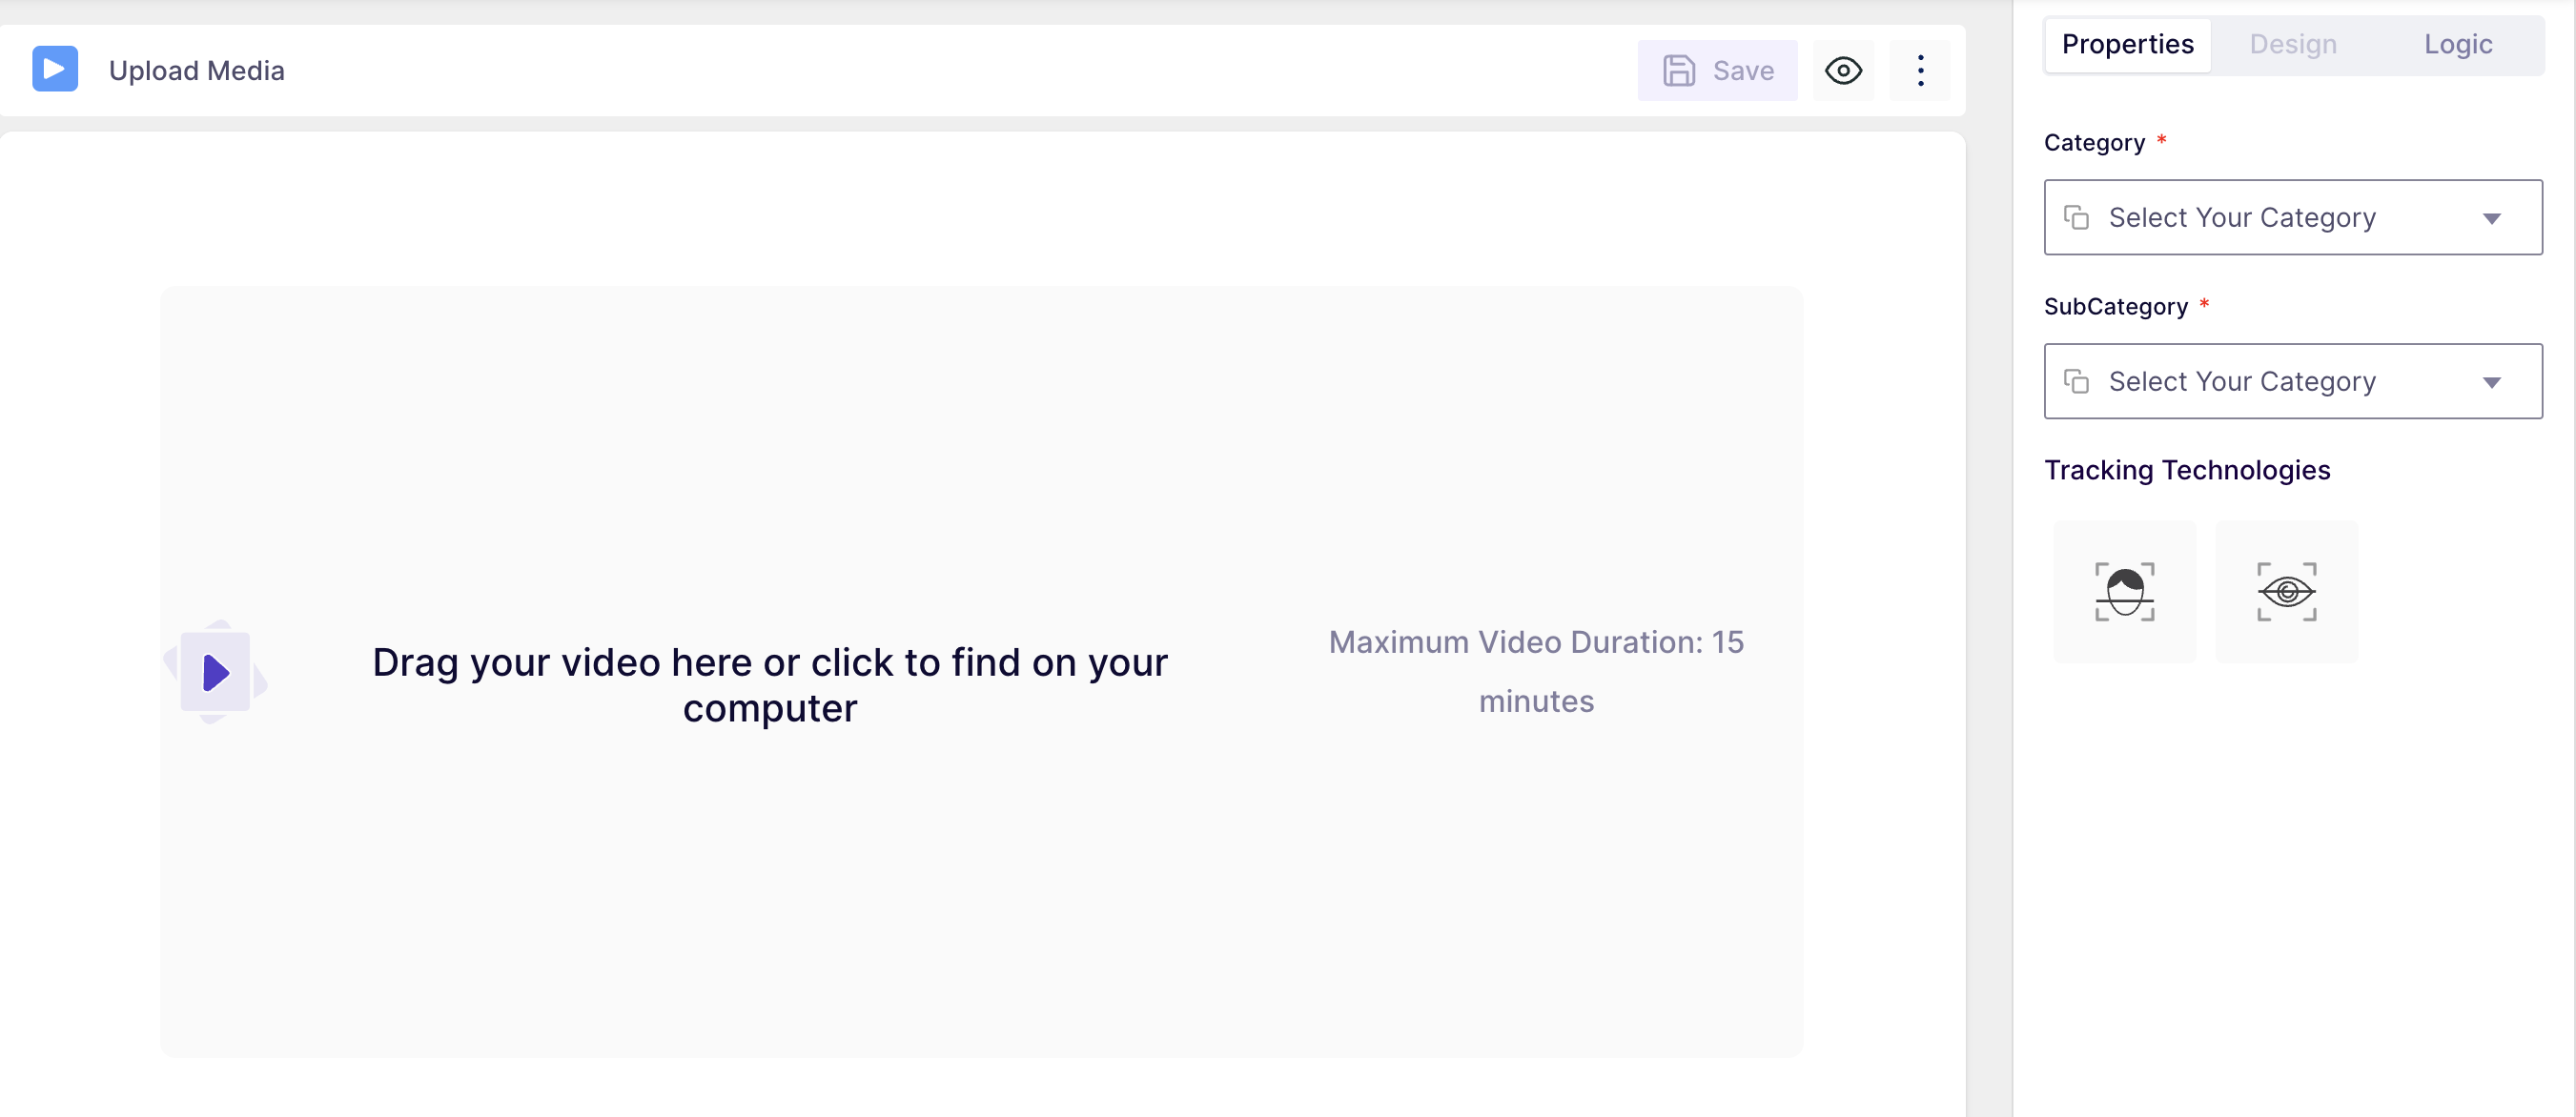
In this block, you can either drag and drop the video file or choose from your library to gather responses from the respondents.
Properties
- Category: You can specify the group where your media belongs. This will help in comparing the overall score of your media with the other media in the same category.
- To select the category, click on the field name and select it from the dropdown.
- Subcategory: This is the subordinate of the main category. Use this option to specify the exact group your media belongs to.
- Tracking Technology: This feature allows you to choose how you want to track the respondents' behaviour. You can select the following technology:
- Facial coding: This can be used to analyse the facial emotions of the respondents while watching the media. For this tracking type, the camera needs to be enabled all the time.
- Eye tracking: By selecting eye tracking, you will be able to capture the eye movement and eye gaze of the respondent while watching the media.
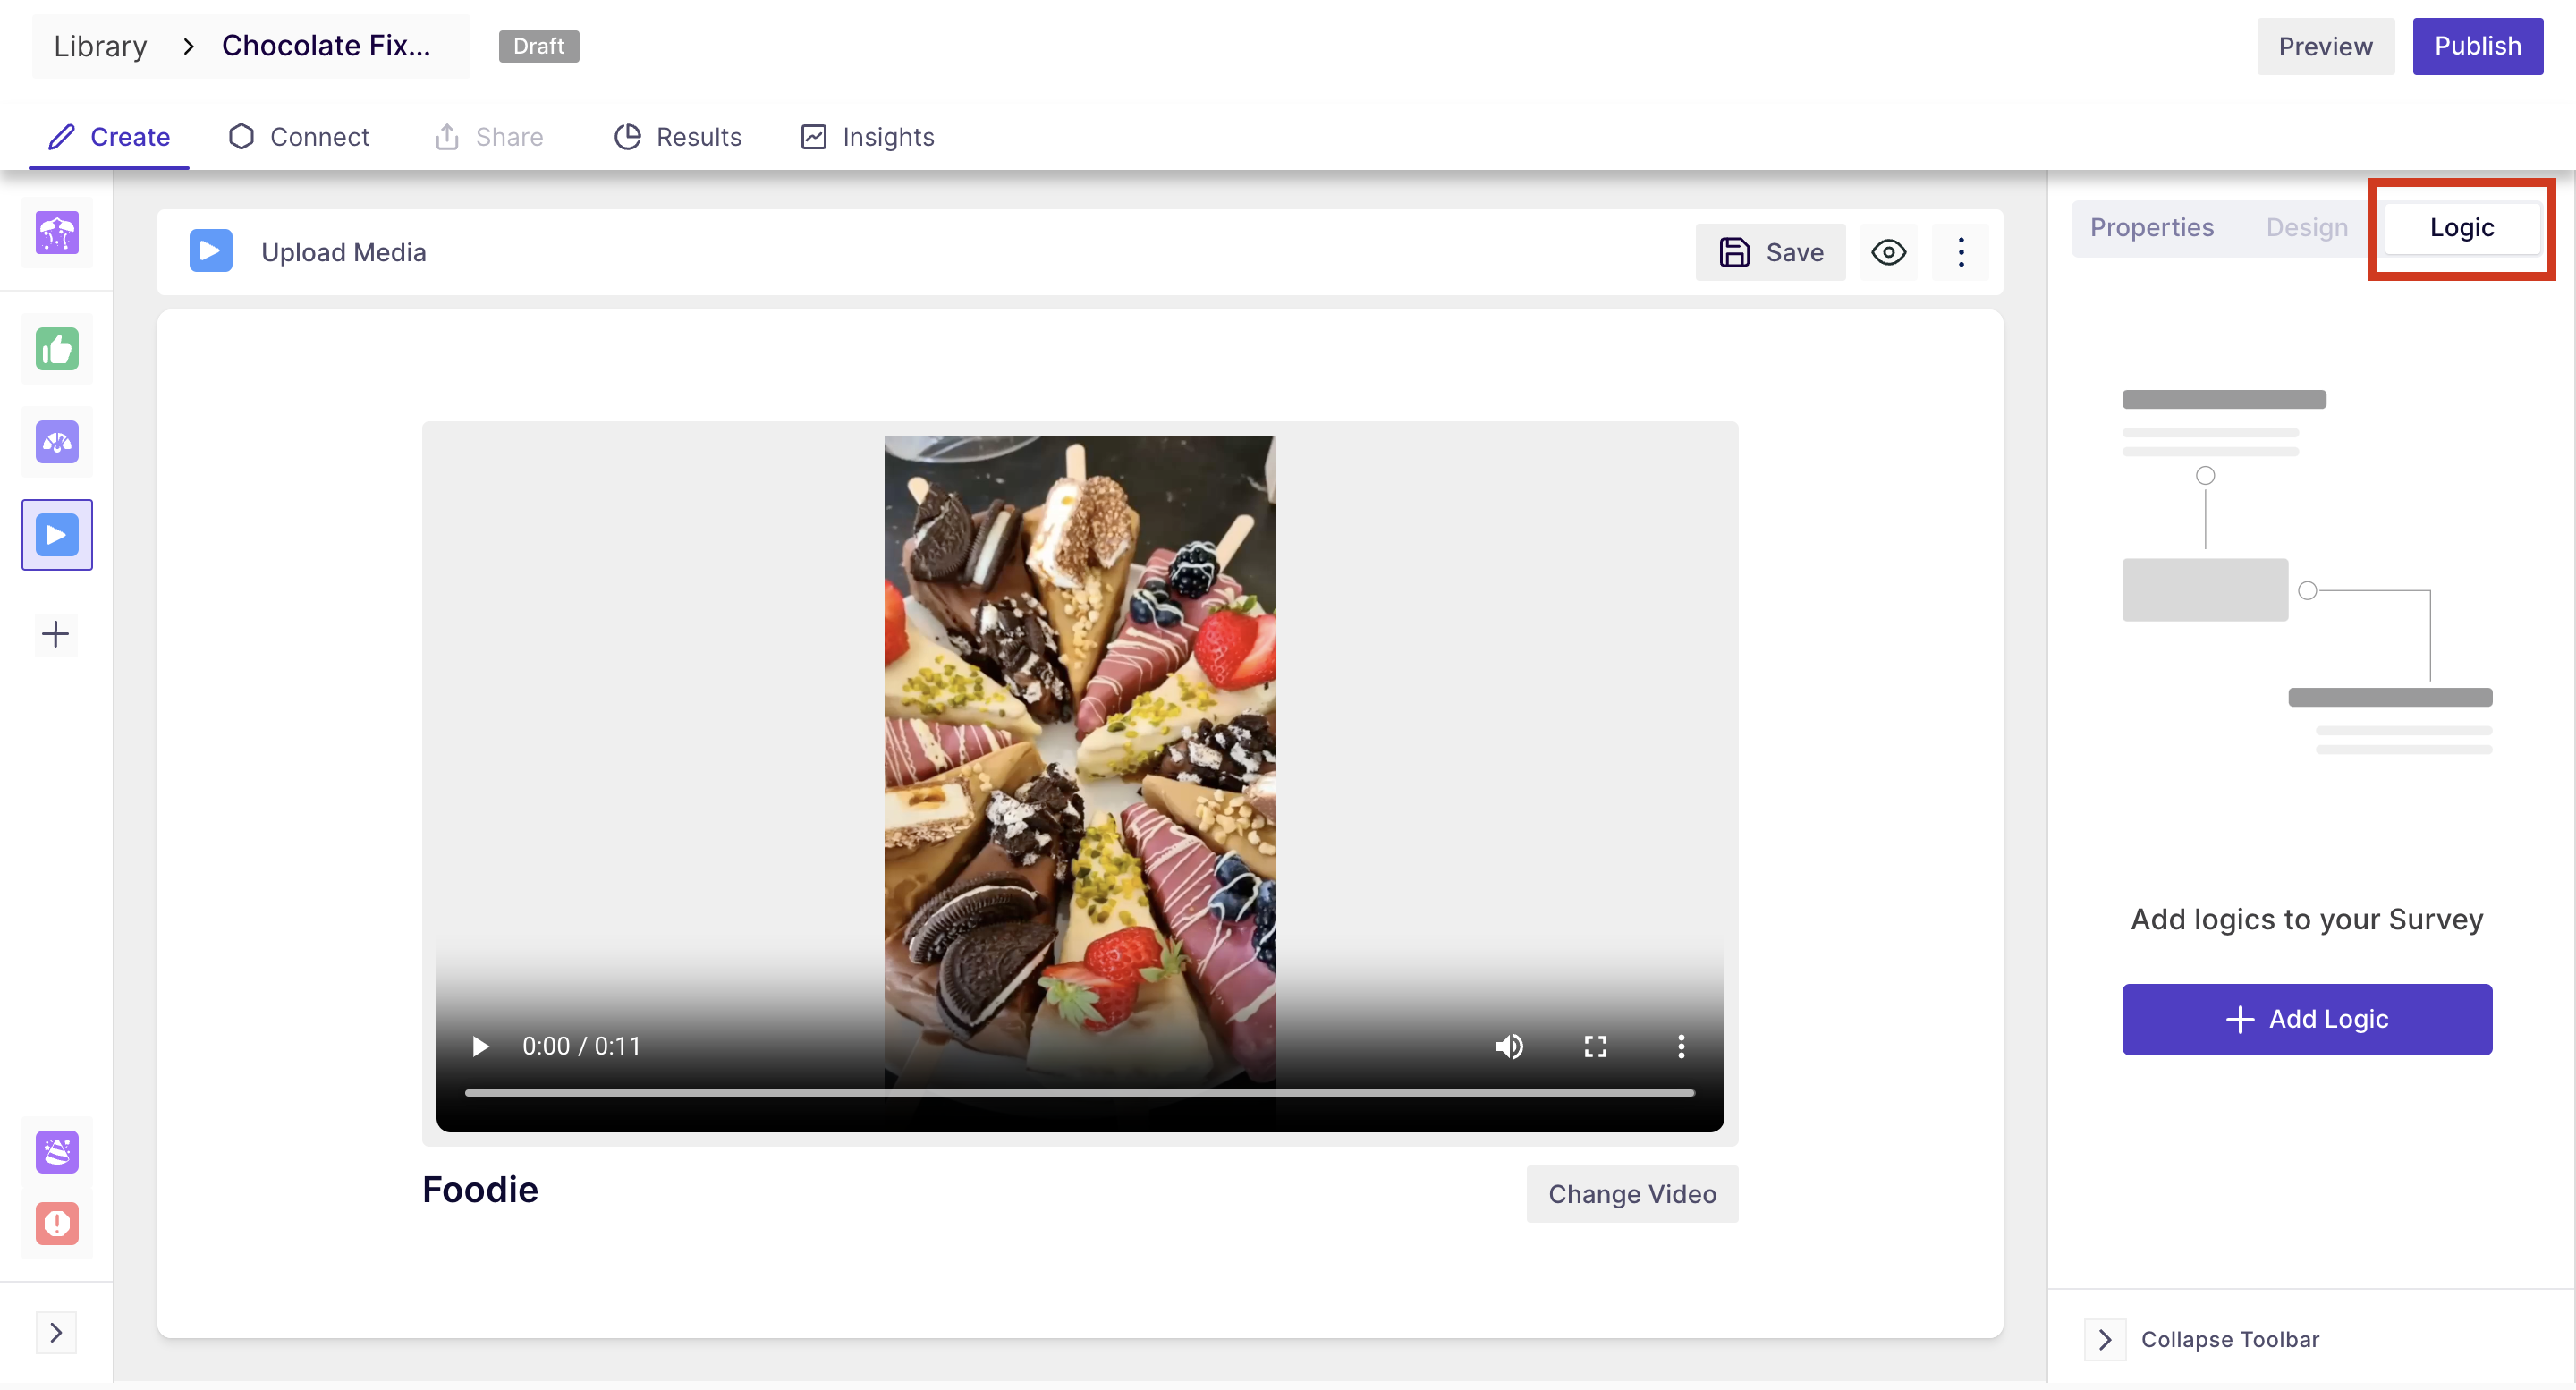
Logic
- In the logic section, you can define the branching logic for the block to customize the survey flow for different responses. So after defining the logic, the respondents will be directed to the block as per the configuration in the branching logic.
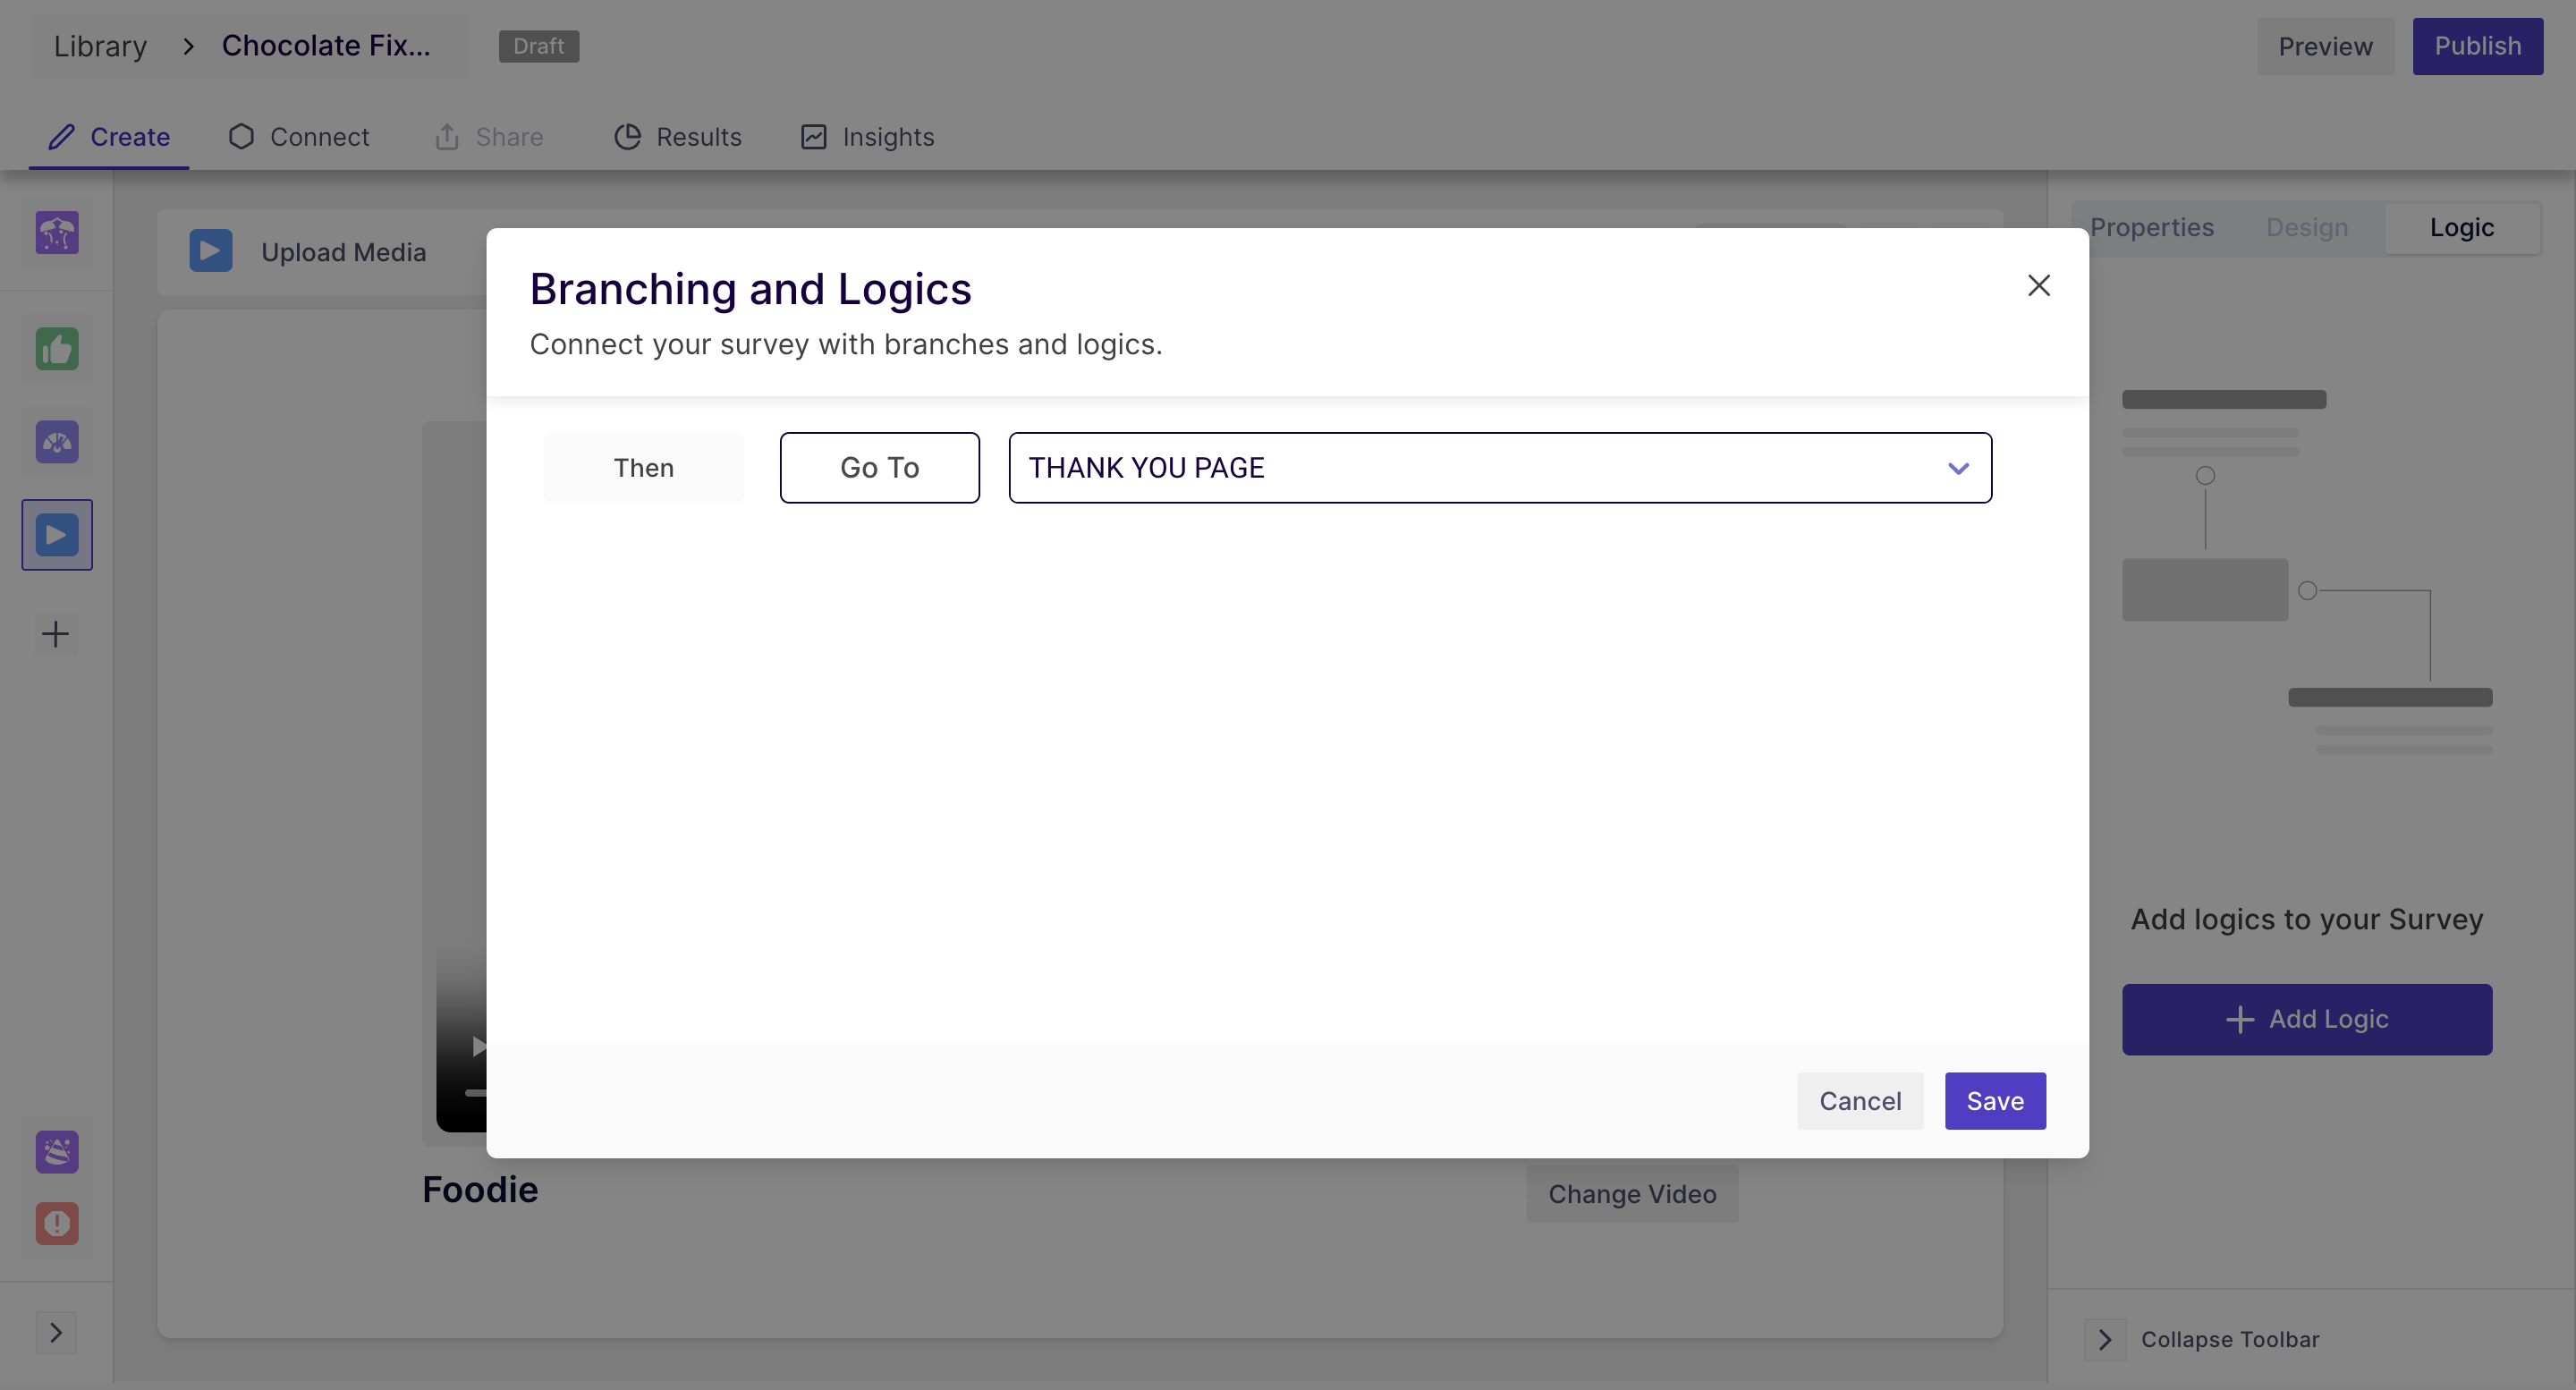
In the above screenshot, we have added a logic to direct the respondent to the "Thank you" page after watching the video. Like this, you can redirect them to any block in the survey.
Result
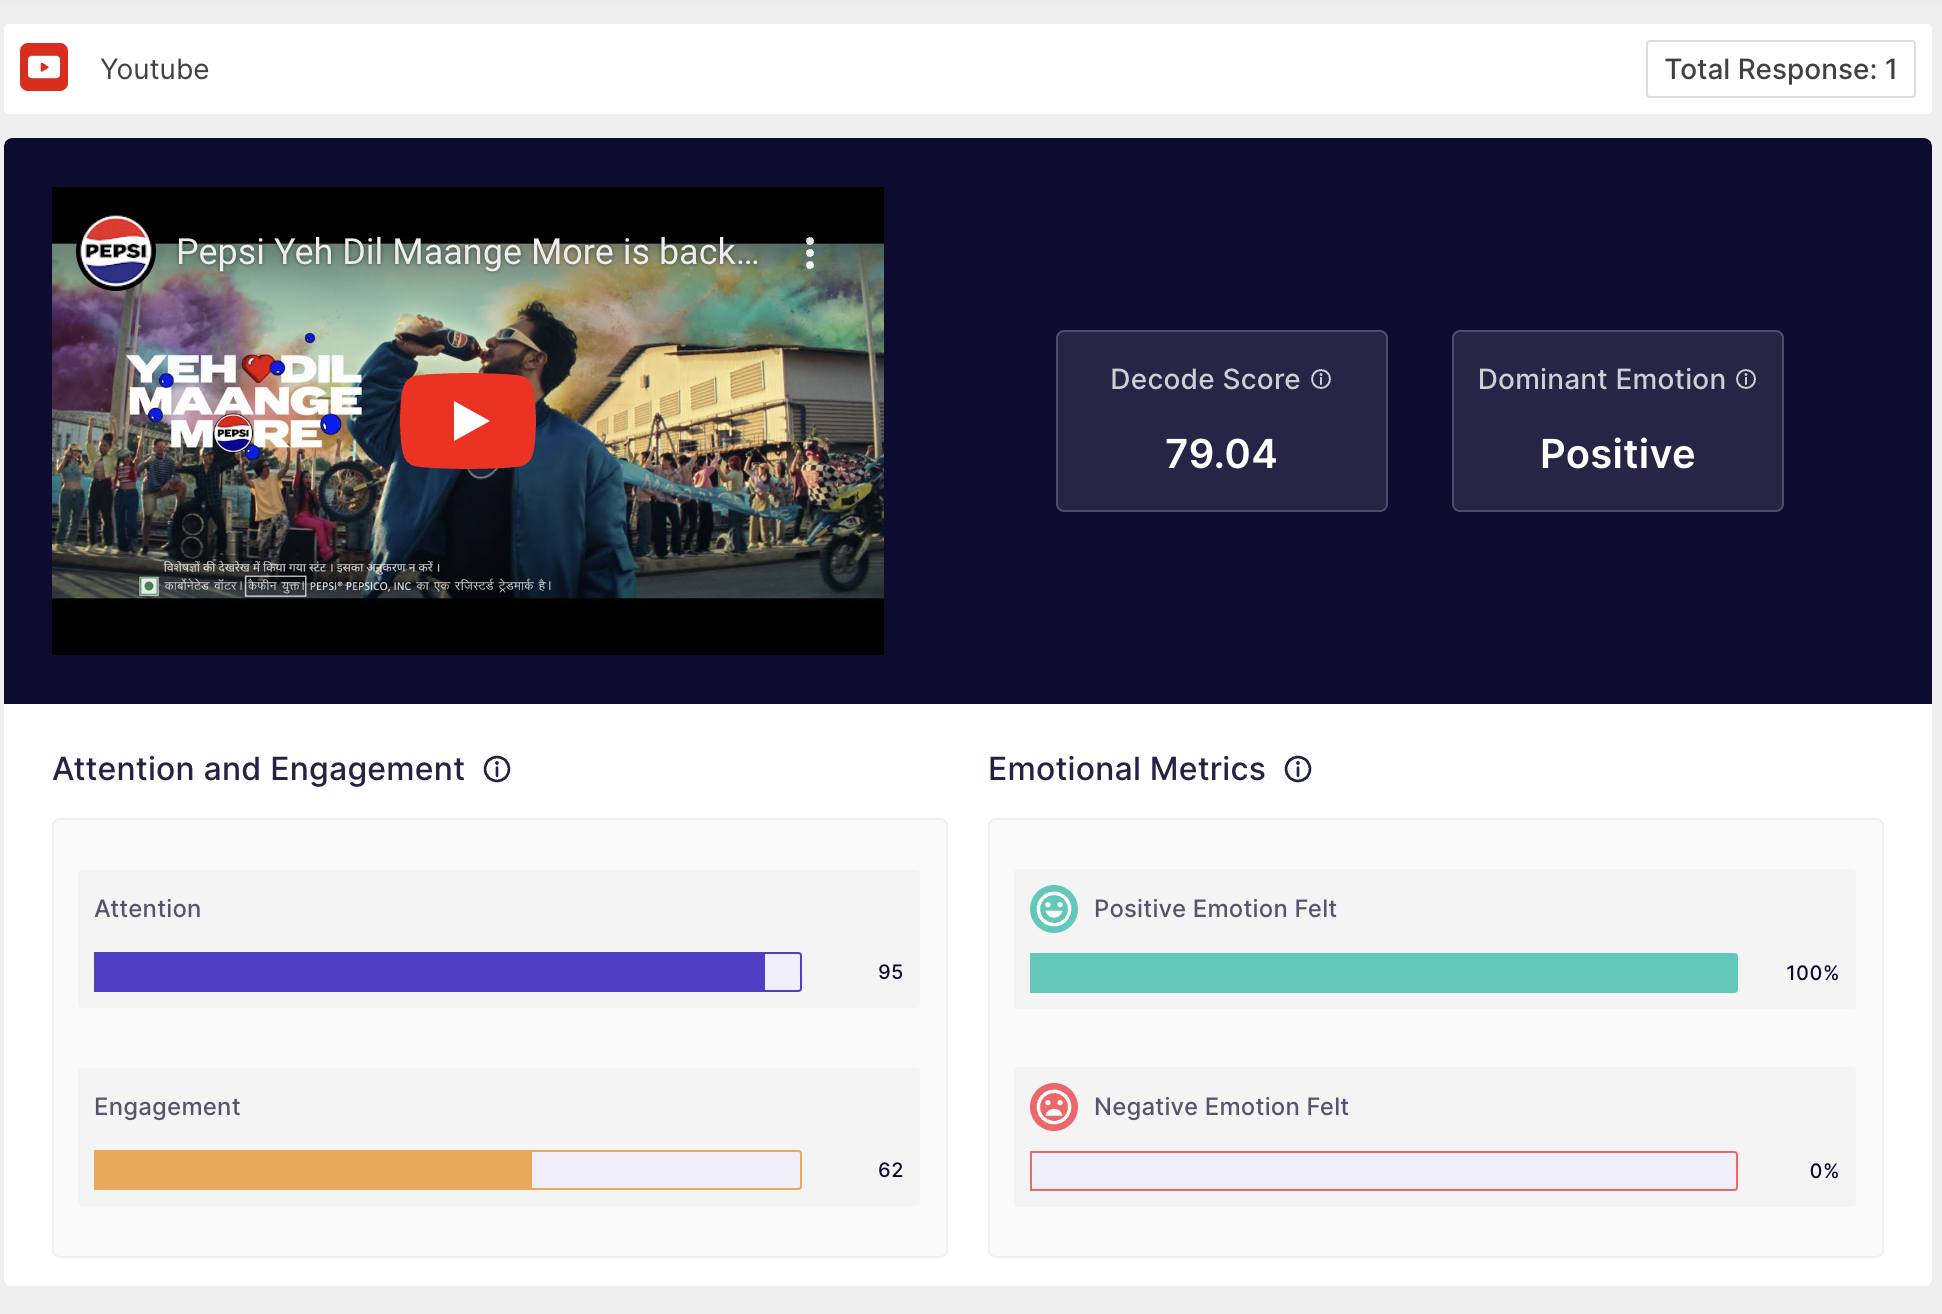
Once your study is published and respondents have taken the test, you can analyse the block-wise result of the questions blocks. For a media insights block, you will find analytics for facial tracking and eye tracking based on the tracking technology selected while creating the study.
The results dashboard provides a comprehensive view of your respondents response and presents a detailed breakdown of the different metric scores such as attention and engagement, along with the emotion scores. It also features graphs that display the attention, engagement, and emotion scores on a second-by-second basis, offering valuable insights into how your respondents responds to your content.The heatmap and the transparency map along AOI's can also be viewed. This dashboard offers a complete picture of your respondent's emotional and psychological reactions, enabling you to make data-driven decisions to improve your content and better serve their needs.
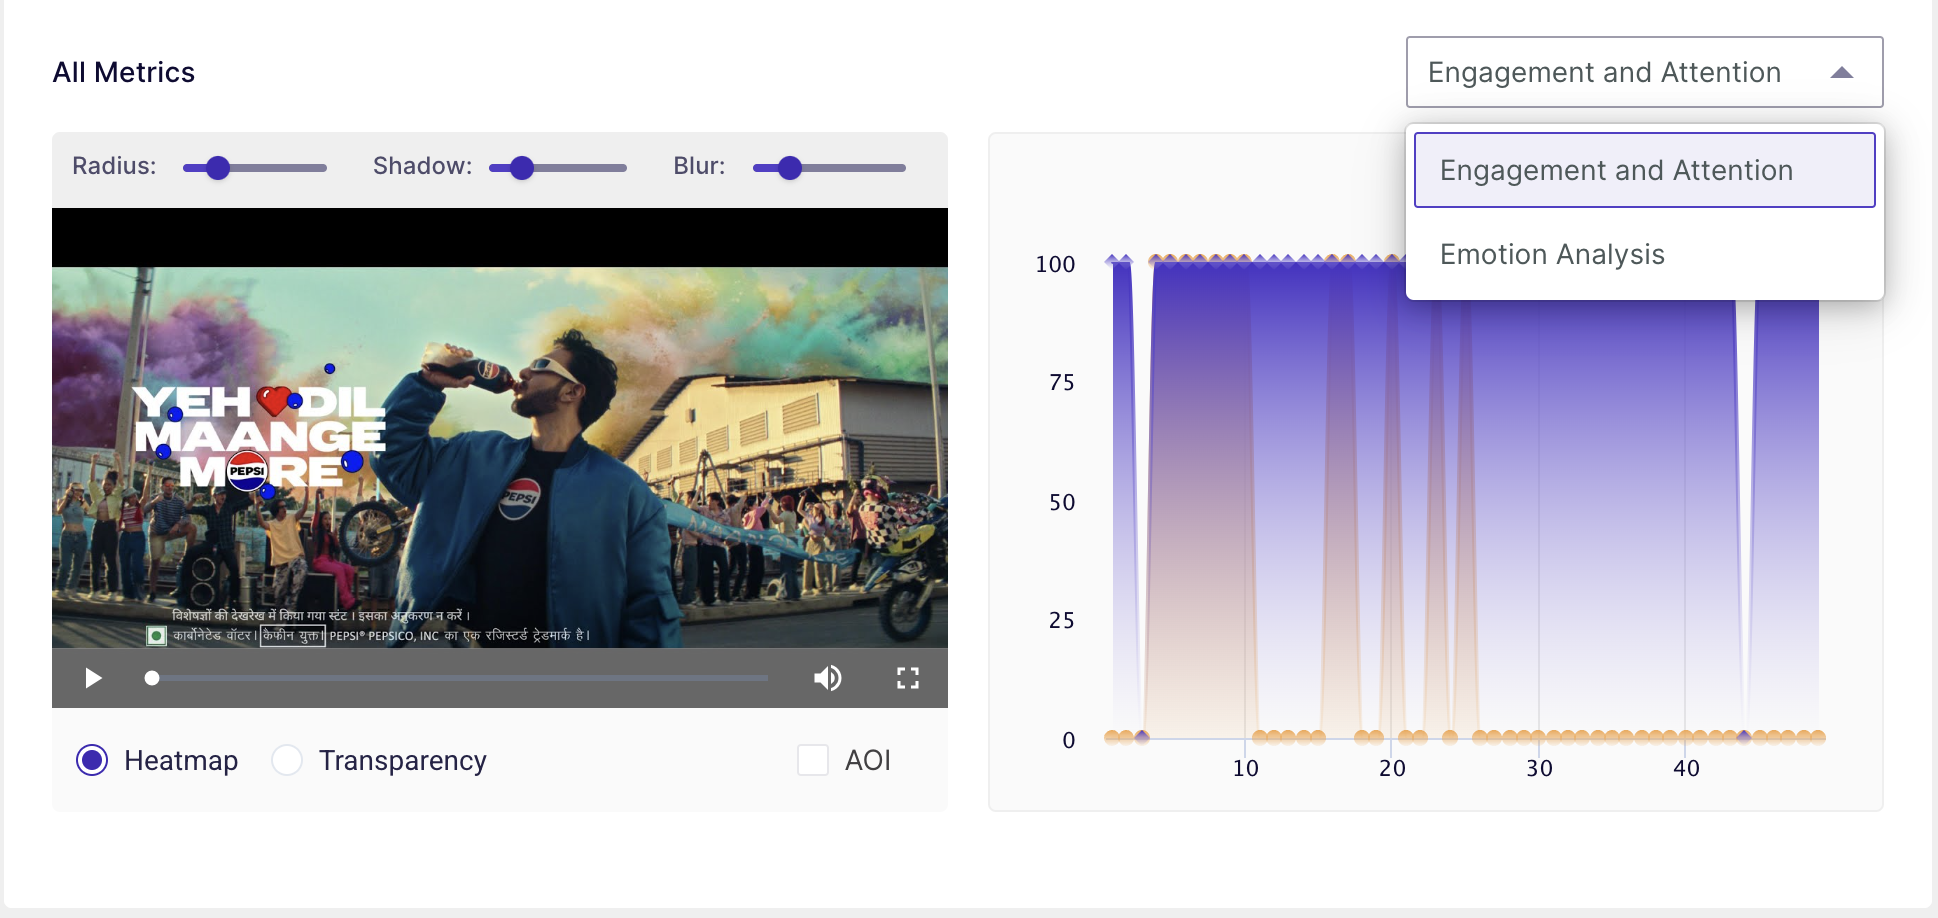
To understand the meaning of different graphs this these dashboard Click Here