Insights of Website Incontext testing in Decode
In the Results section of context testing, you can analyze their study's performance metrics, including total Complete and partial views, total interactions with the ads, and the average time spent data. Identify the most engaging and positively received ads and access detailed analytics for attention, engagement, emotions, and eye-tracking heatmaps at the ad level. This section provides valuable insights for optimizing content based on audience interactions.
Overview Summary
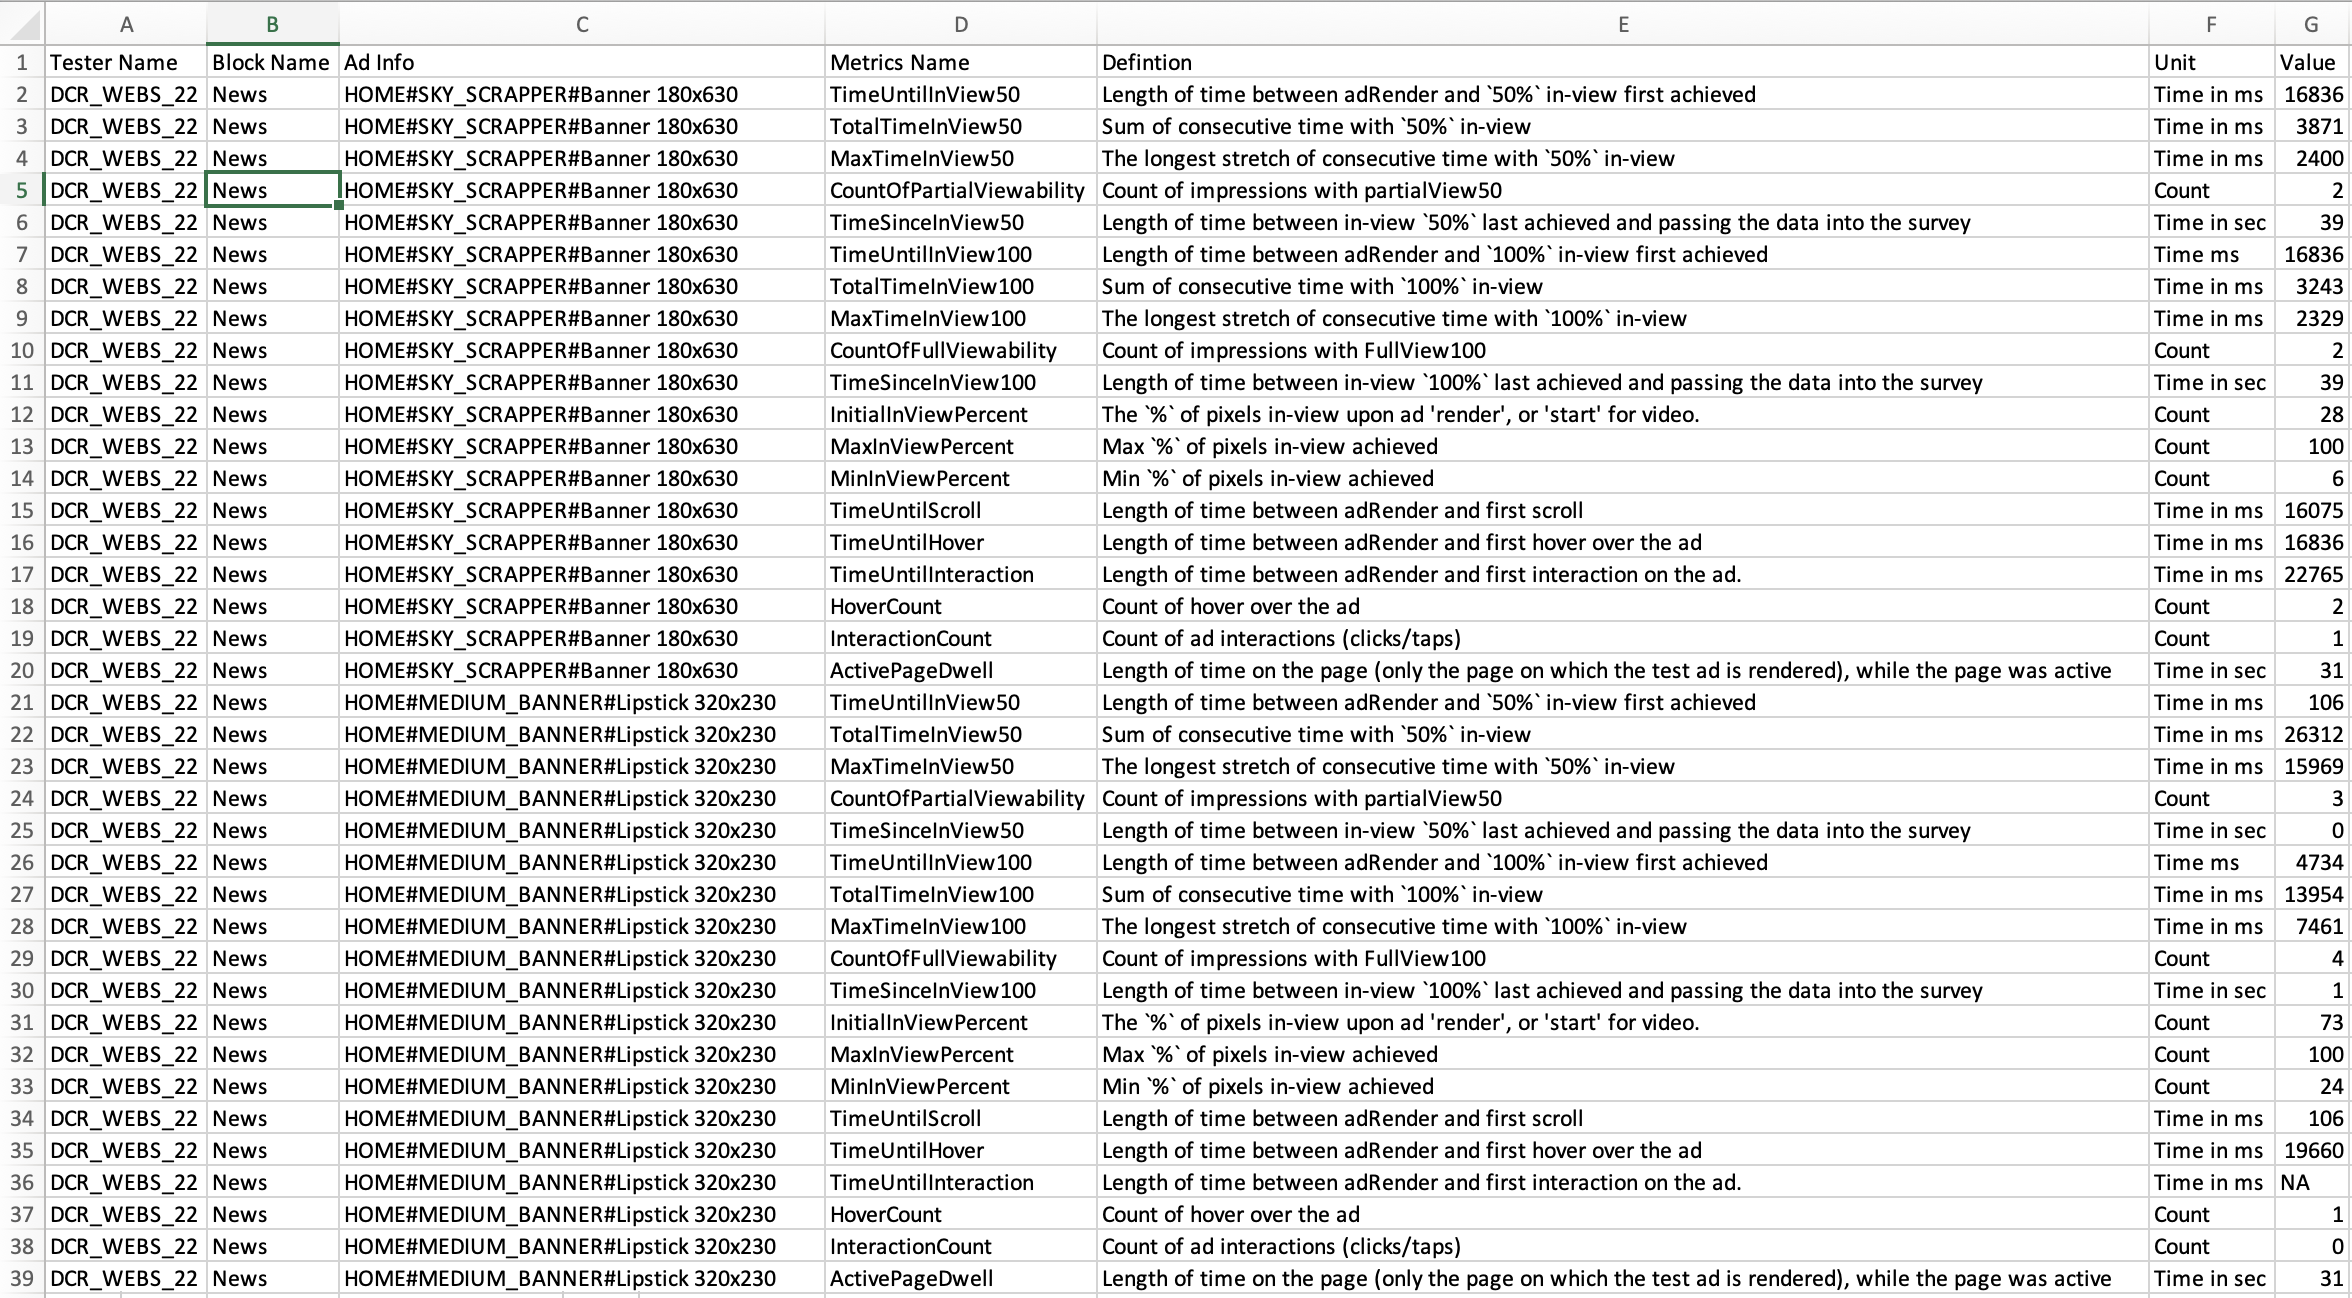
The overview page provides a concise yet comprehensive snapshot of your test's performance, offering the following key details:
- Total Views in 100: Total Views in 100 refers to the cumulative count of instances where an advertisement was entirely visible and thoroughly examined by viewers. This metric encompasses the number of times the audience engaged with the ad in its entirety, indicating full visibility and complete visits.
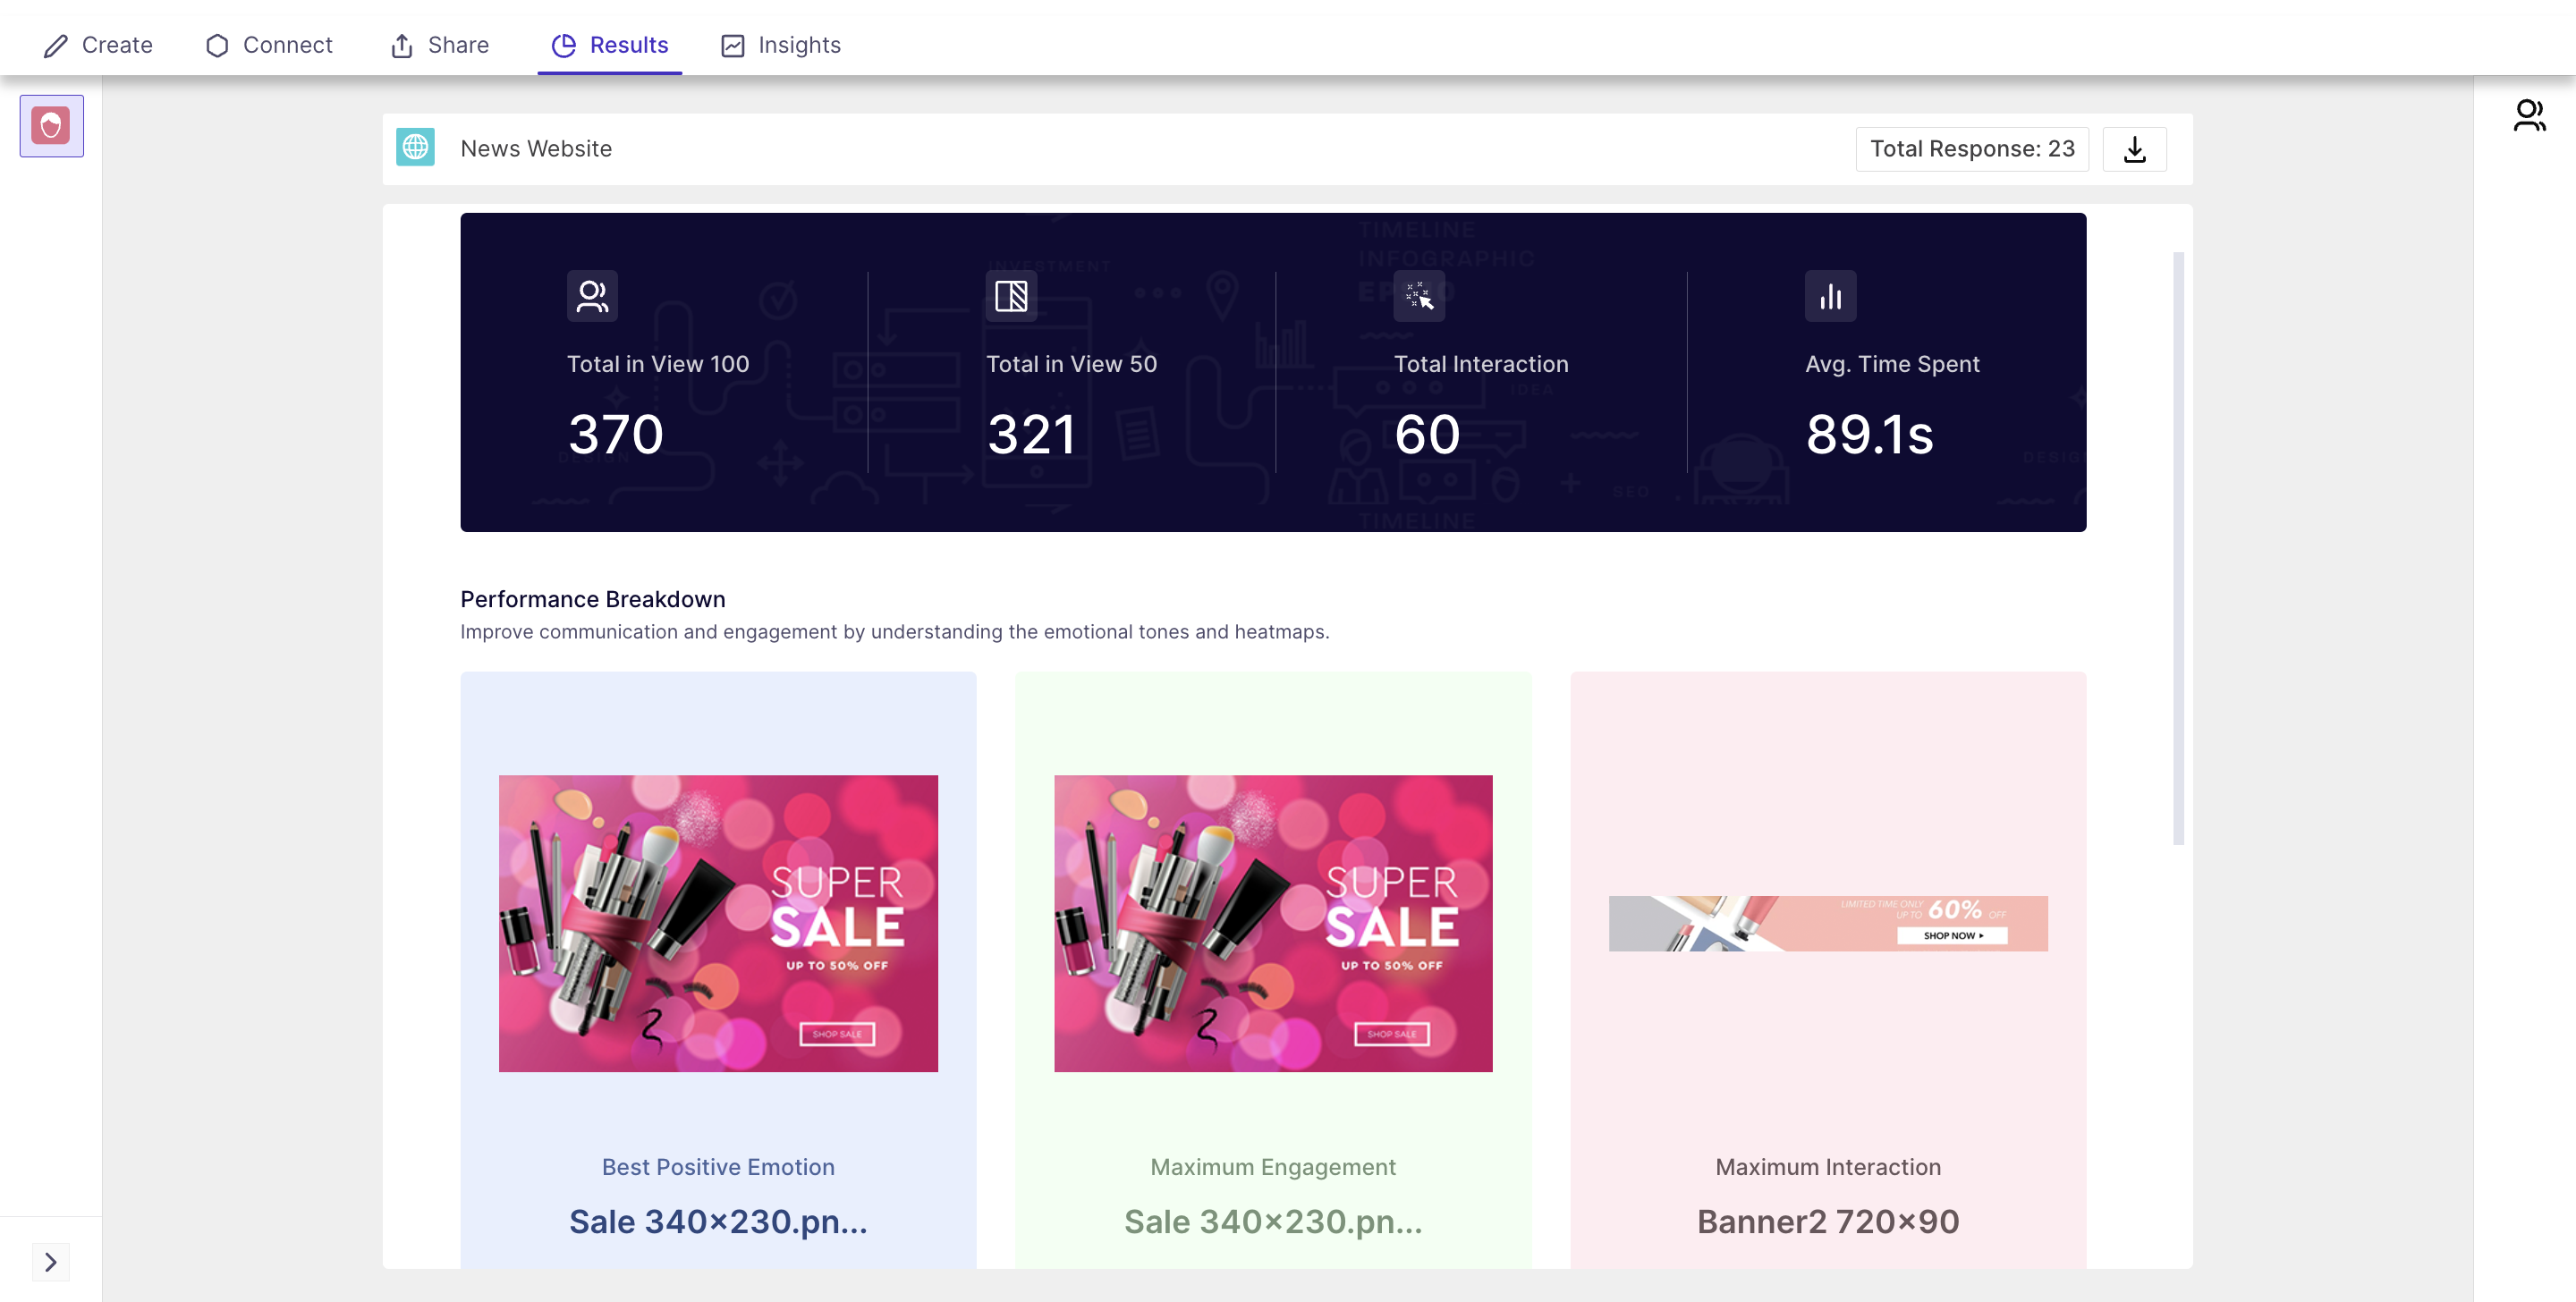
- Total Views in 50: Number of times the ad was partially visible. (the ad is placed at the bottom, and the users have not scrolled fully to view the ads; only some section of the ad is visible, then the view will be counted as a partial view.)

- Total Interaction: Number of times users clicked on the ads and interacted with the content.
- Average Time Spent: The average duration users spent engaging with the ads.
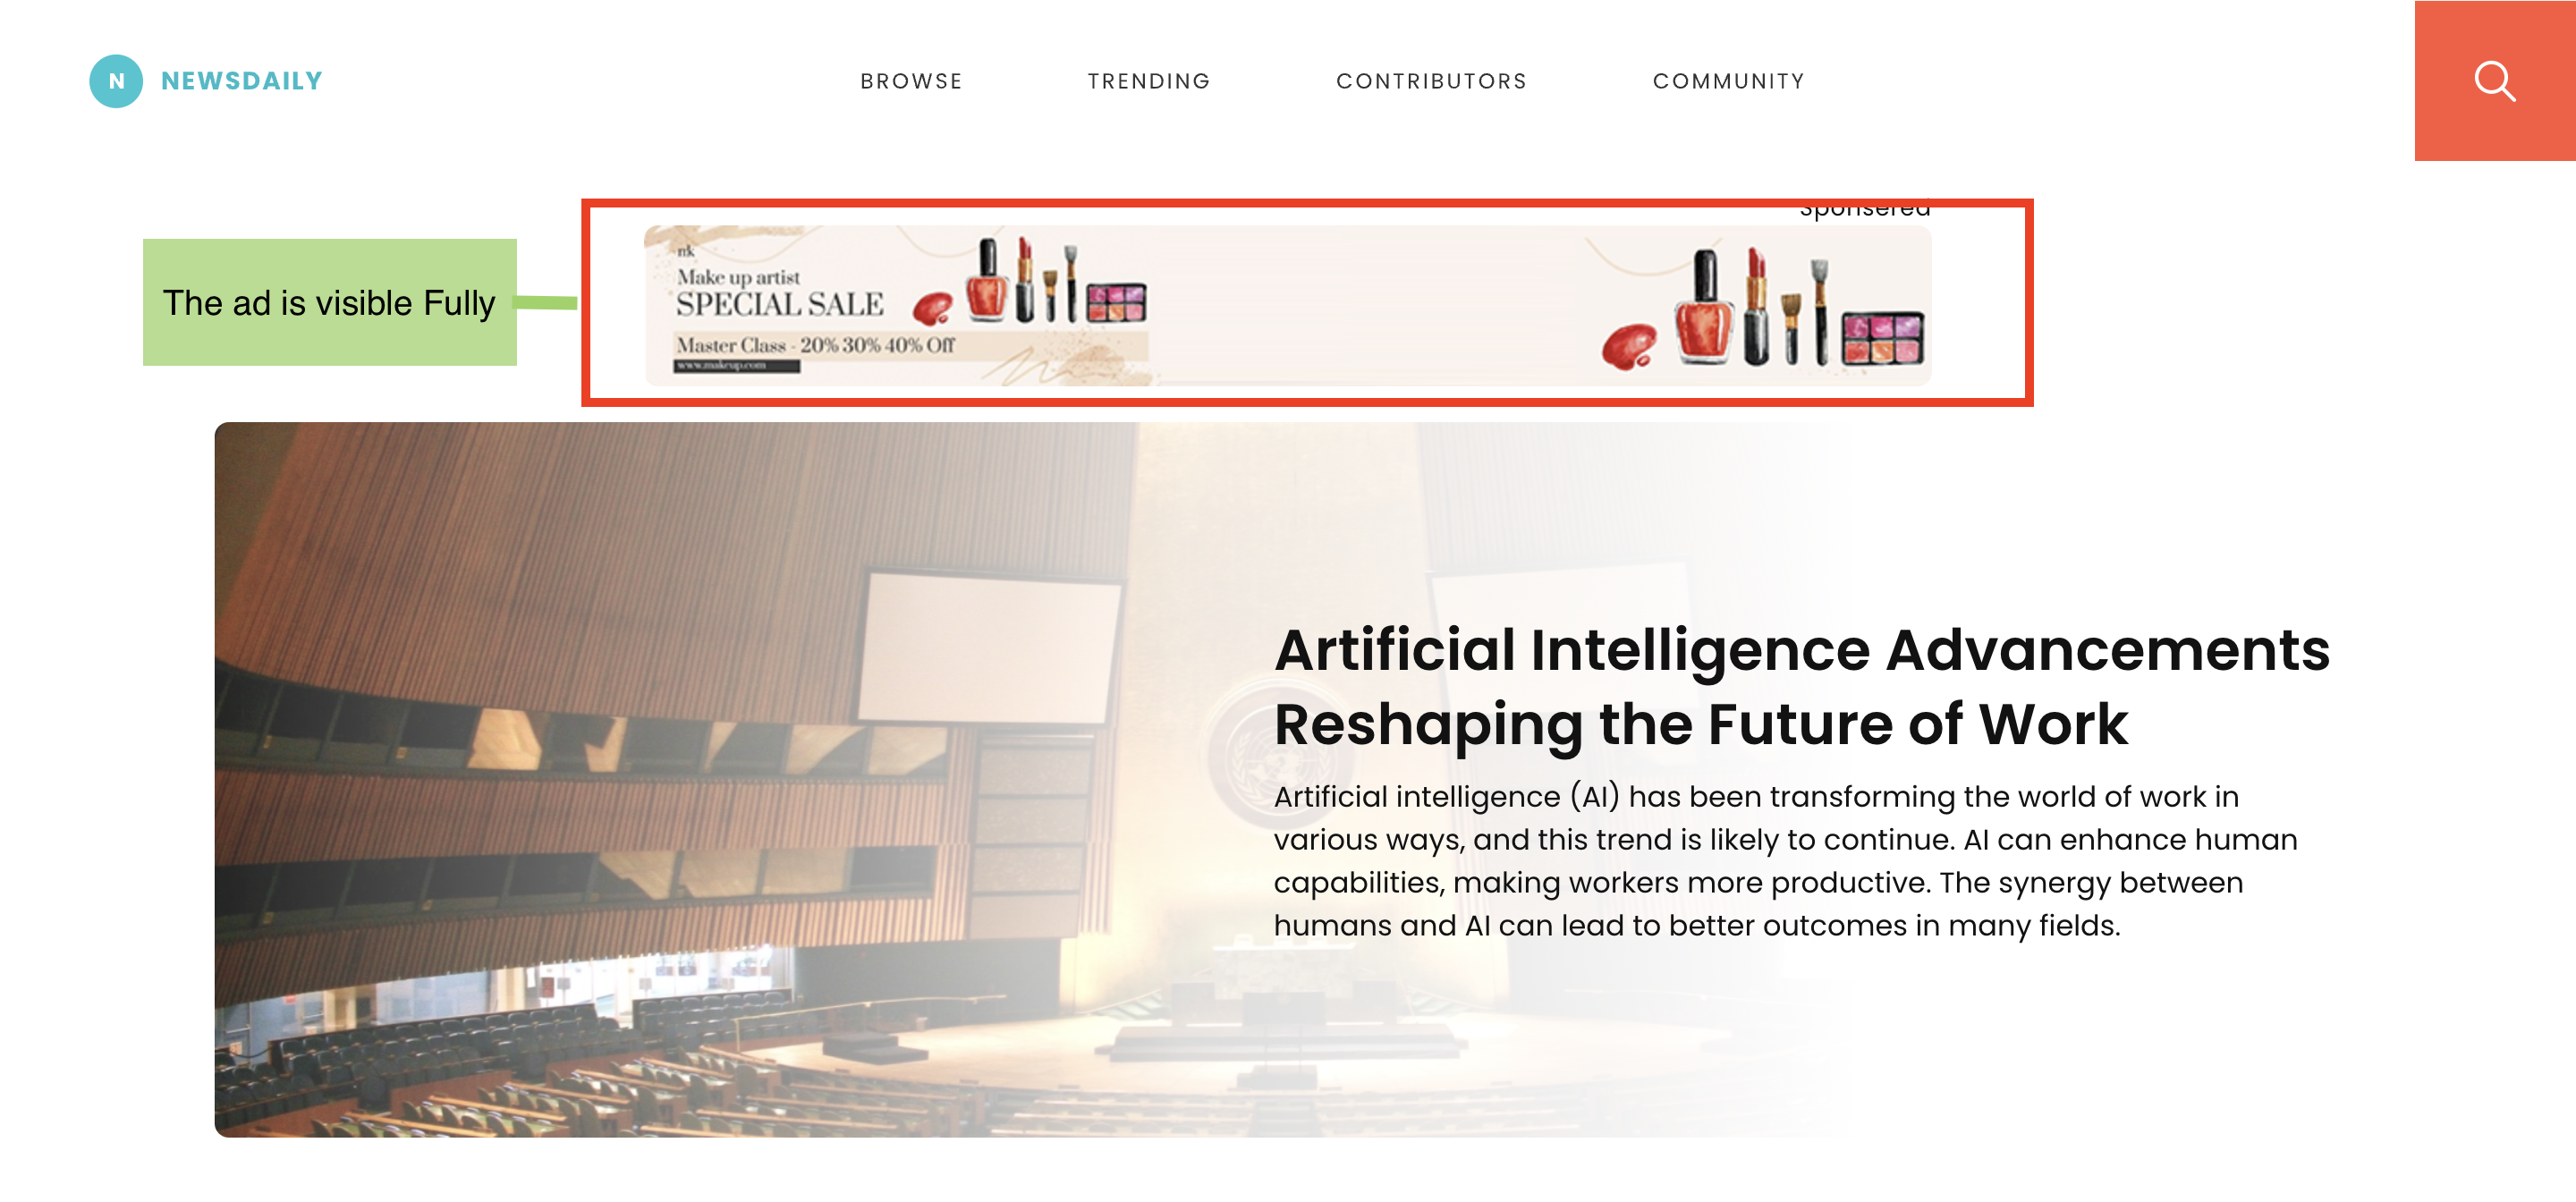
Top Performers
Discover the most impactful aspects of your test through:
- Best Positive Displayed: Identifies the ad that generated the most positive user responses.
- Maximum Engagement: Ad that secured the highest user engagement.
- Maximum Interaction: The ads which received the maximum number of clicks.
Creative Section
Explore the comprehensive list of all creatives that underwent testing. For detailed analytics at the creative level, simply click on the "View Creative" button corresponding to the desired creative.
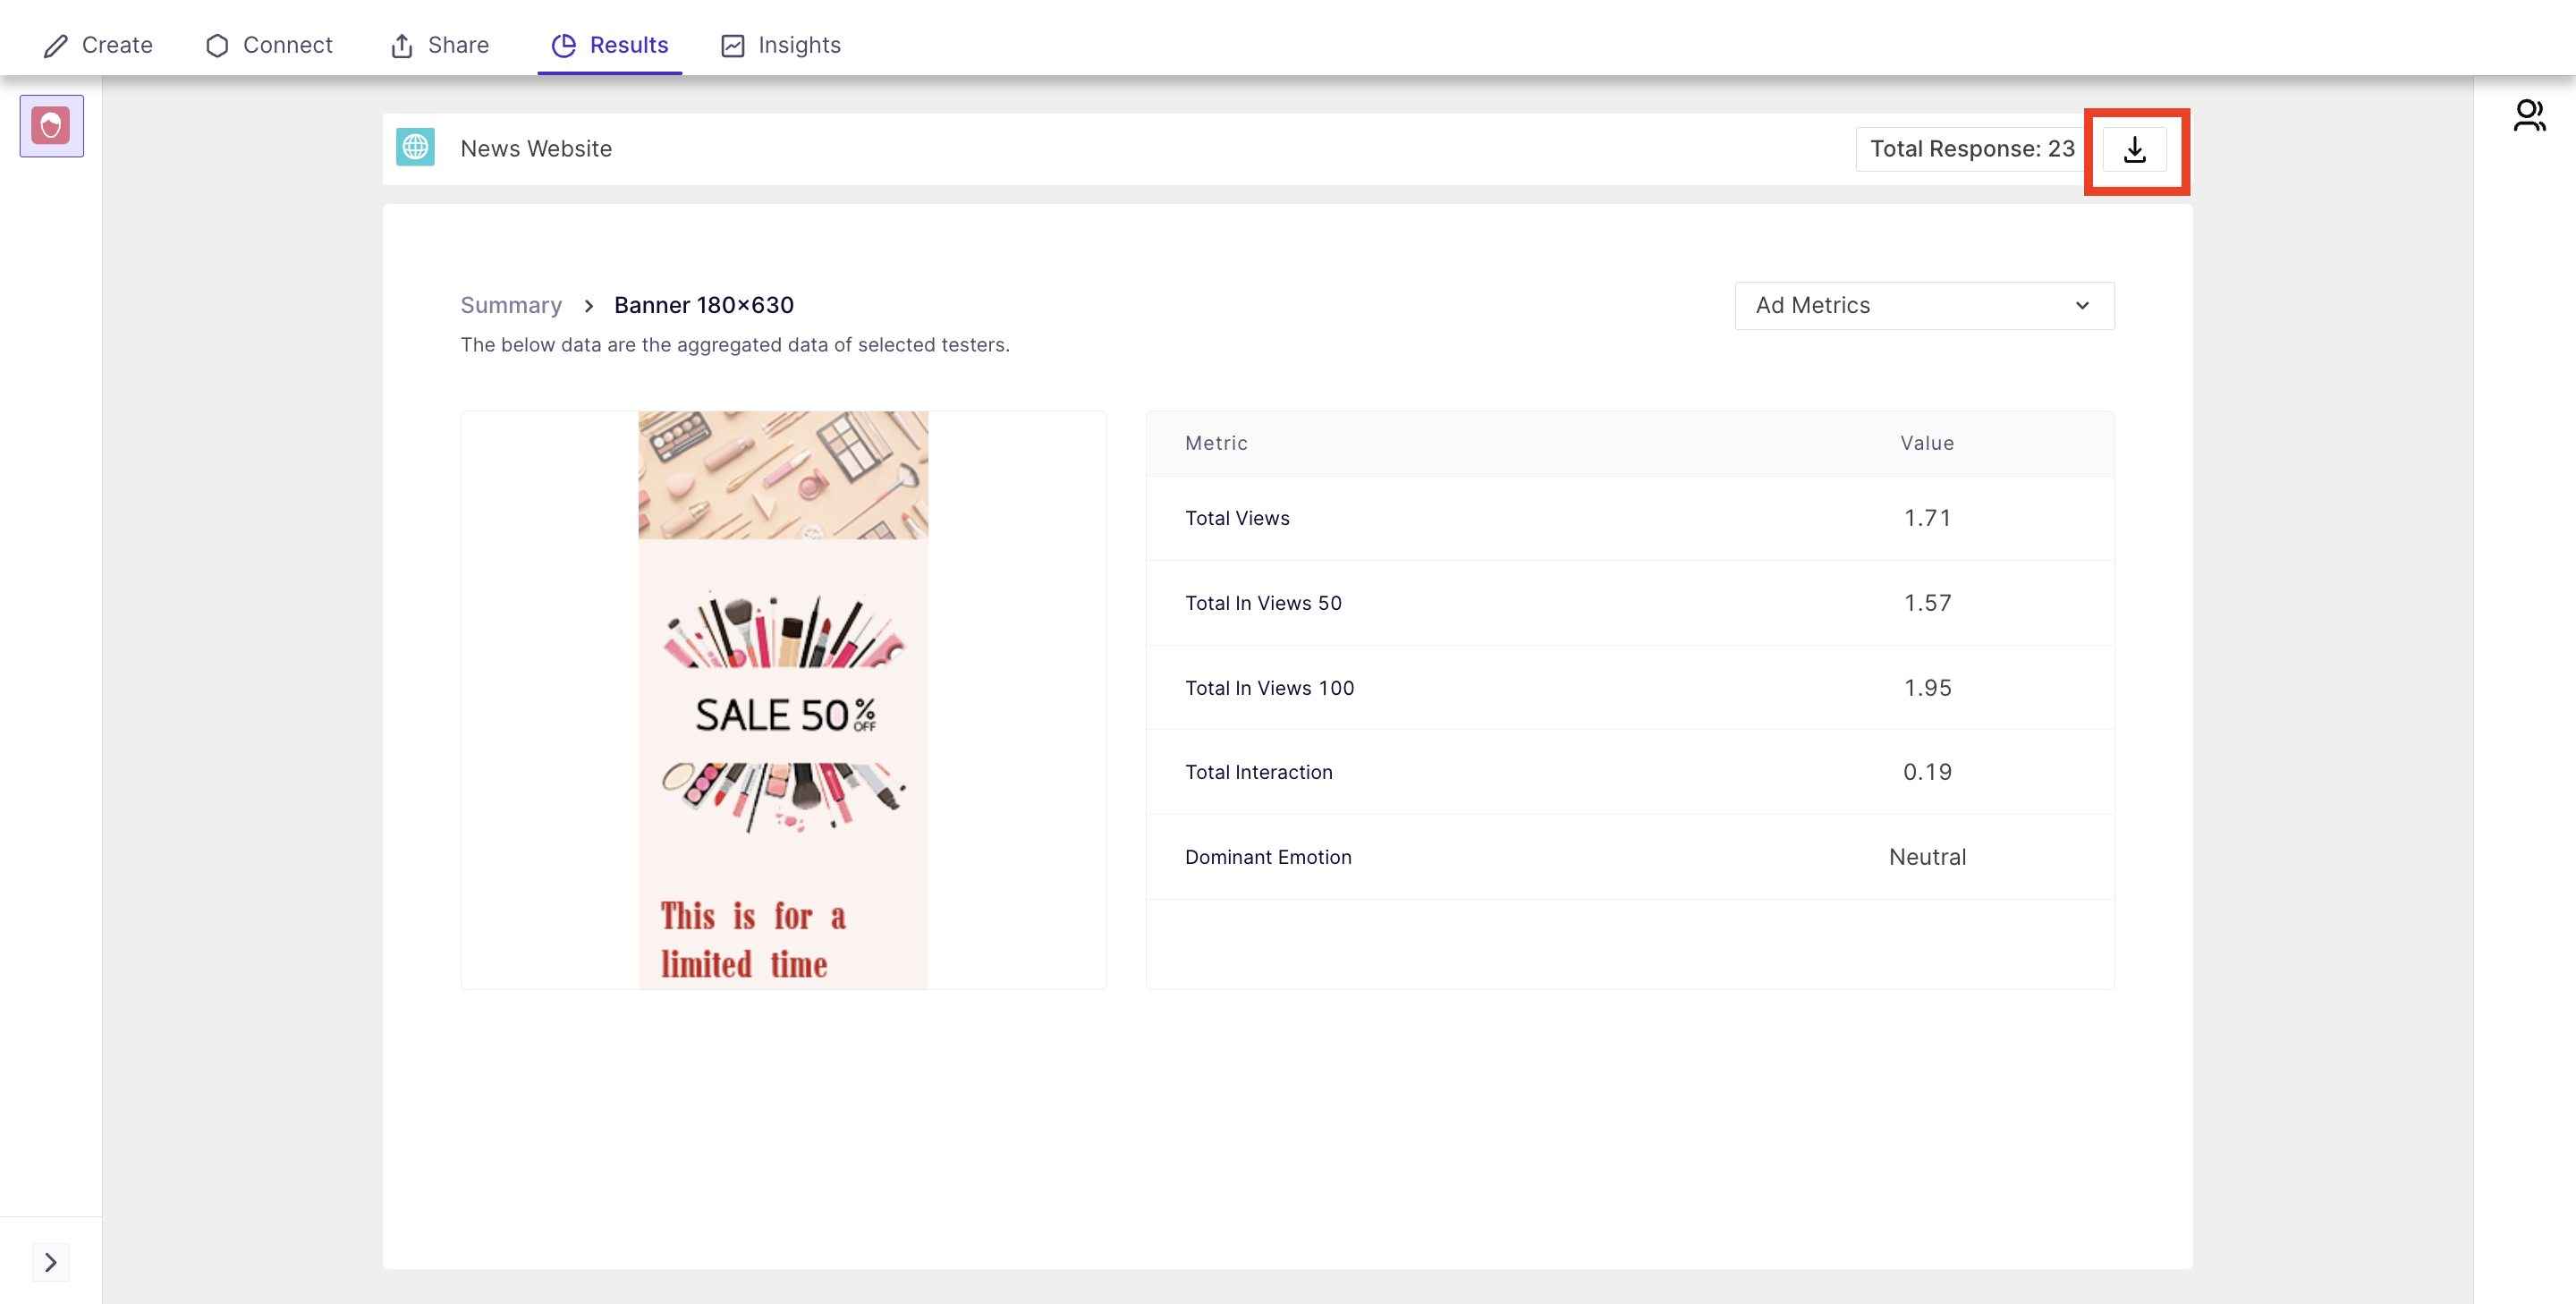
Once you select to view data on a particular creative, you will taken to a new page where you will find the overall metrics. You can use the dropdown to change the insights.
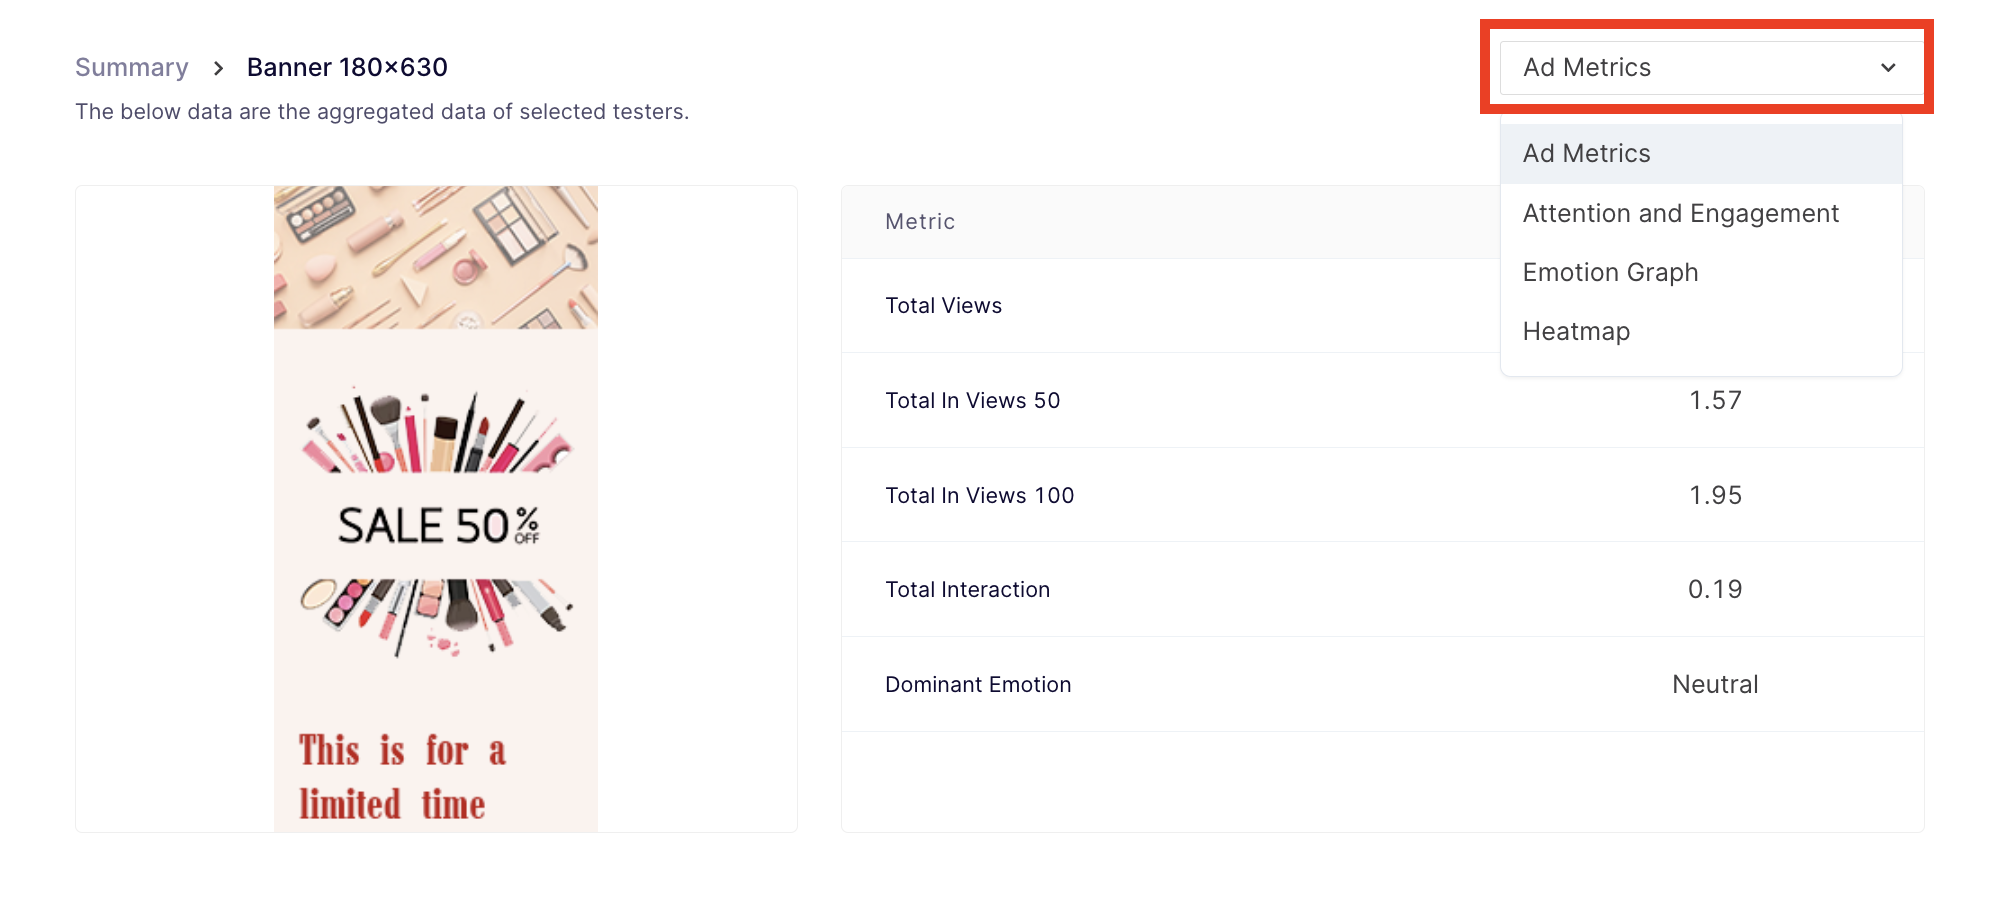
You will find the following insights:
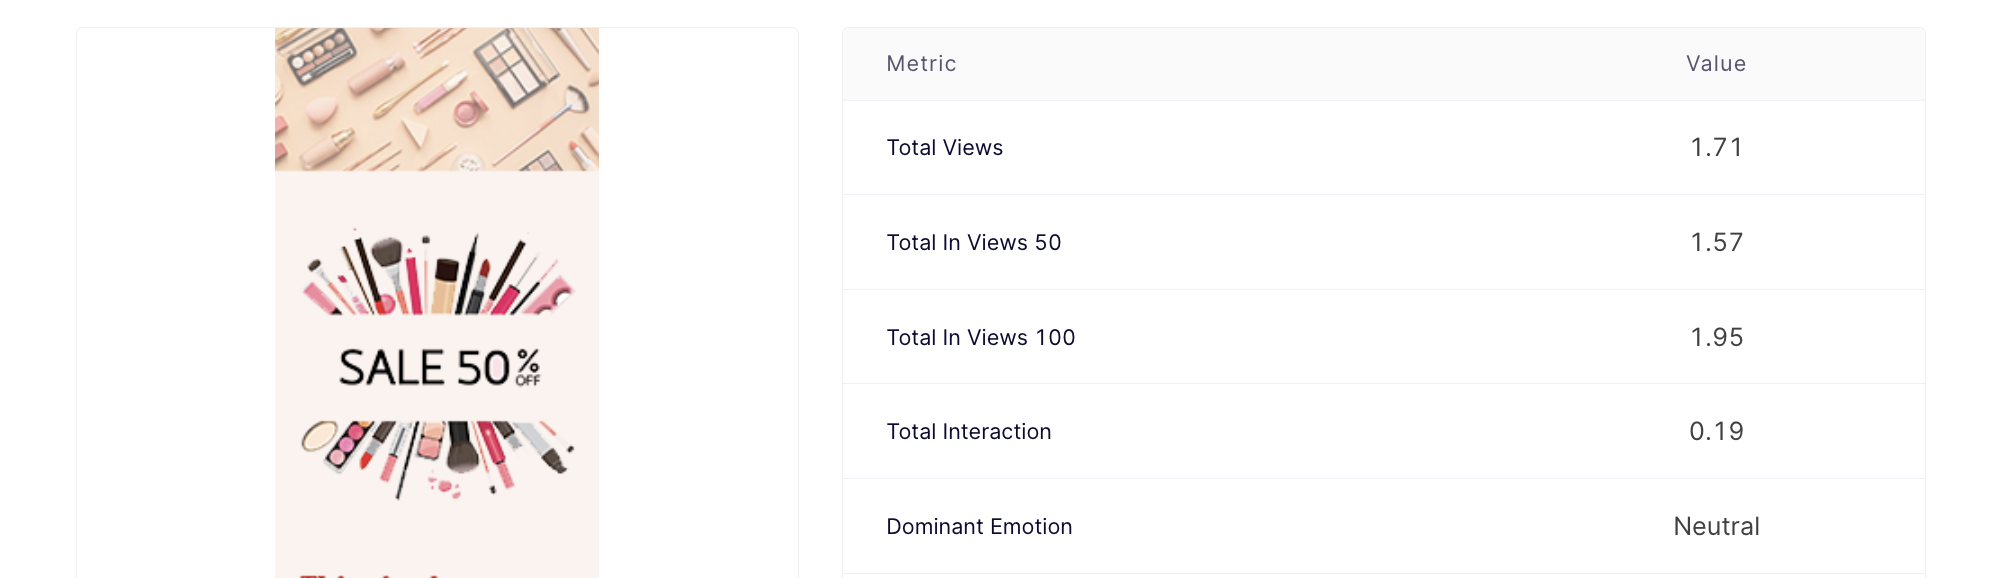
Metrics
1. Total Views: Average of Total Views in 50 and Total Views in 100
Calculation: (Total Views in 50)+ (Total Views in 100) /2
2. Total views in 50: Average of the number of times the ad was viewed partially by the users.
Calculation: (viewer 1 * number of times viewed the ad partially)+ (viewer 2 * number of times viewed the ad partially) +........n/ Total number of viewers
3. Total In Views 100: Average of the number of times the ad was viewed in full by the users.
Calculation: (viewer 1 * number of times viewed the ad in full)+ (viewer 2 * number of times viewed the ad in full)+........n/ Total number of viewers
4. Total Interaction: Average clicks made by users on the ad.
Calculations: (number of clicks by viewer 1) + (number of clicks by viewer 2)+........n/ Total number of viewers
5. Dominant emotions: Emotion displayed the most by the users.
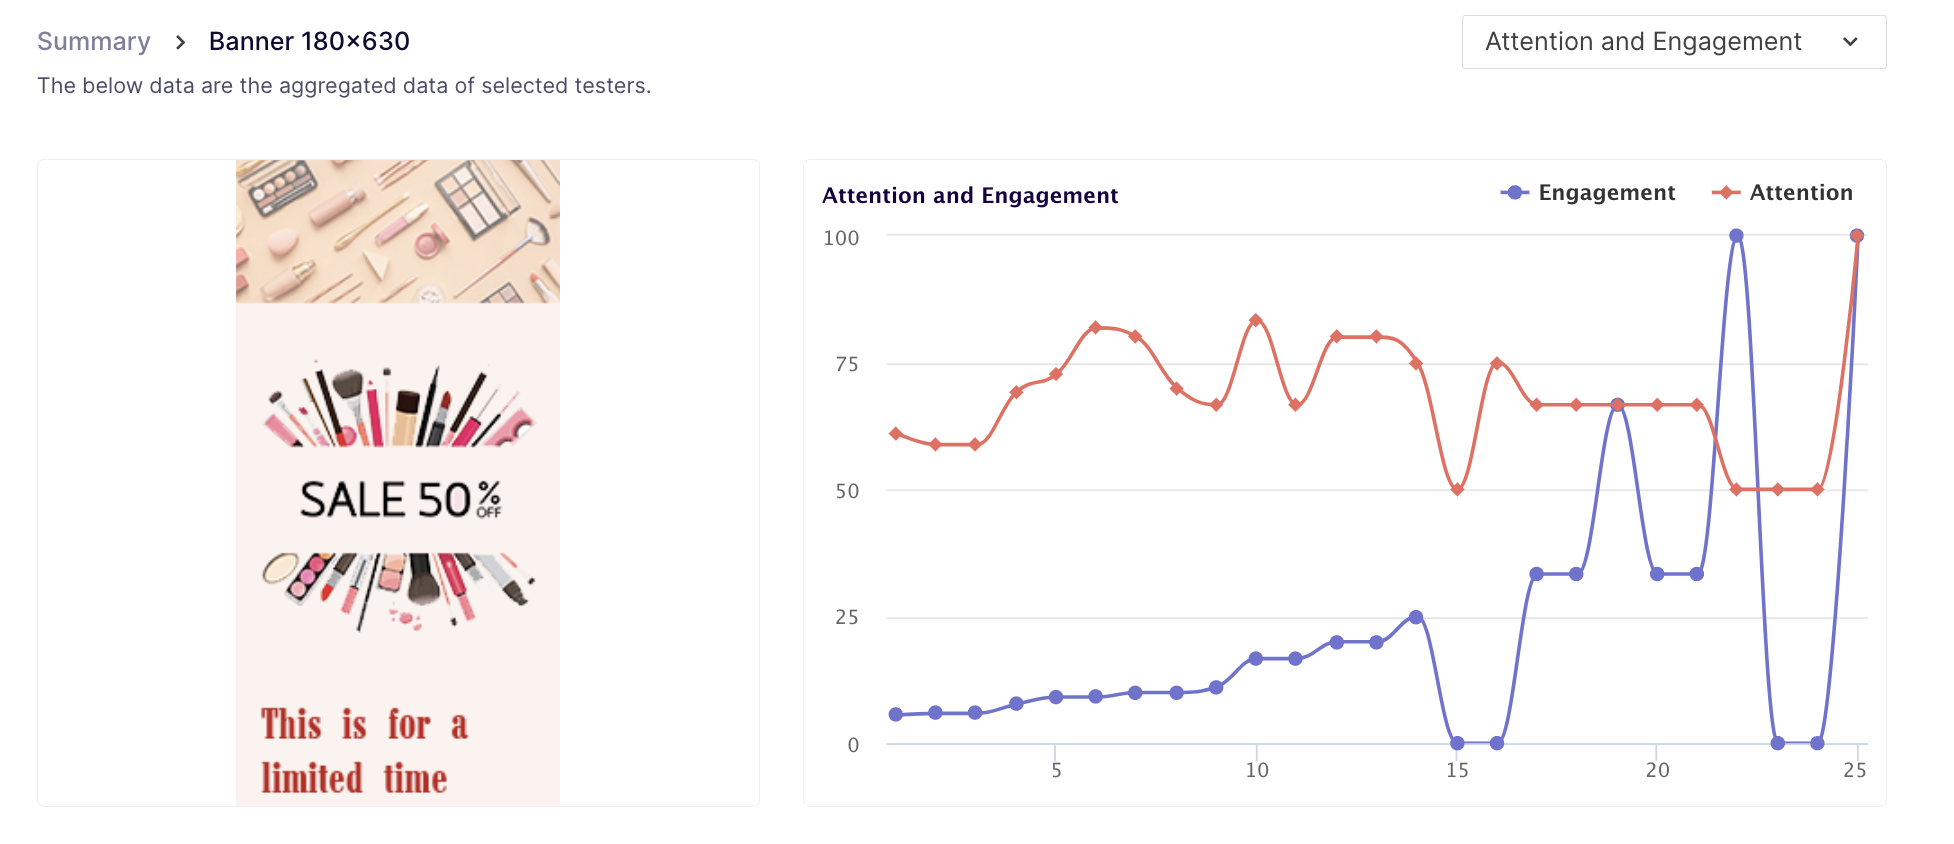
Attention and Engagement Graph
It provides the viewer's second-by-second attention and engagement scores. The chart is presented as a line graph to see the scores hover over the timelines; a small information box will appear with the scores for that second.
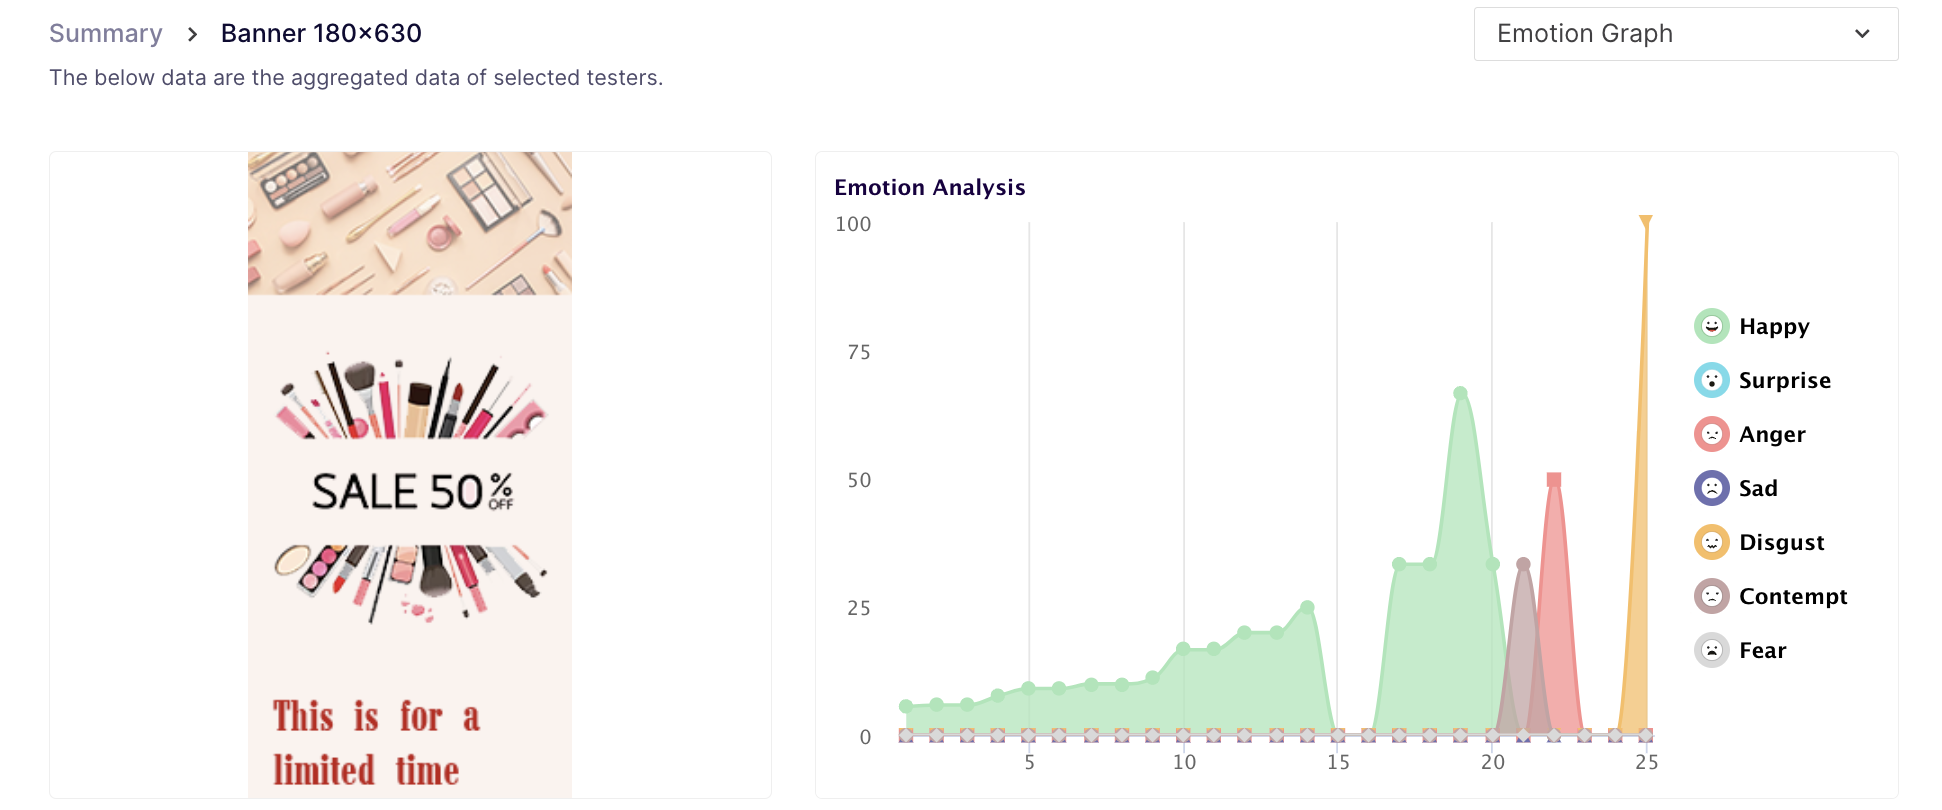
Emotion Graph
This graph provides information about the respondent's emotions throughout the media. It displays what emotions the respondents display at a particular second while watching the ad.
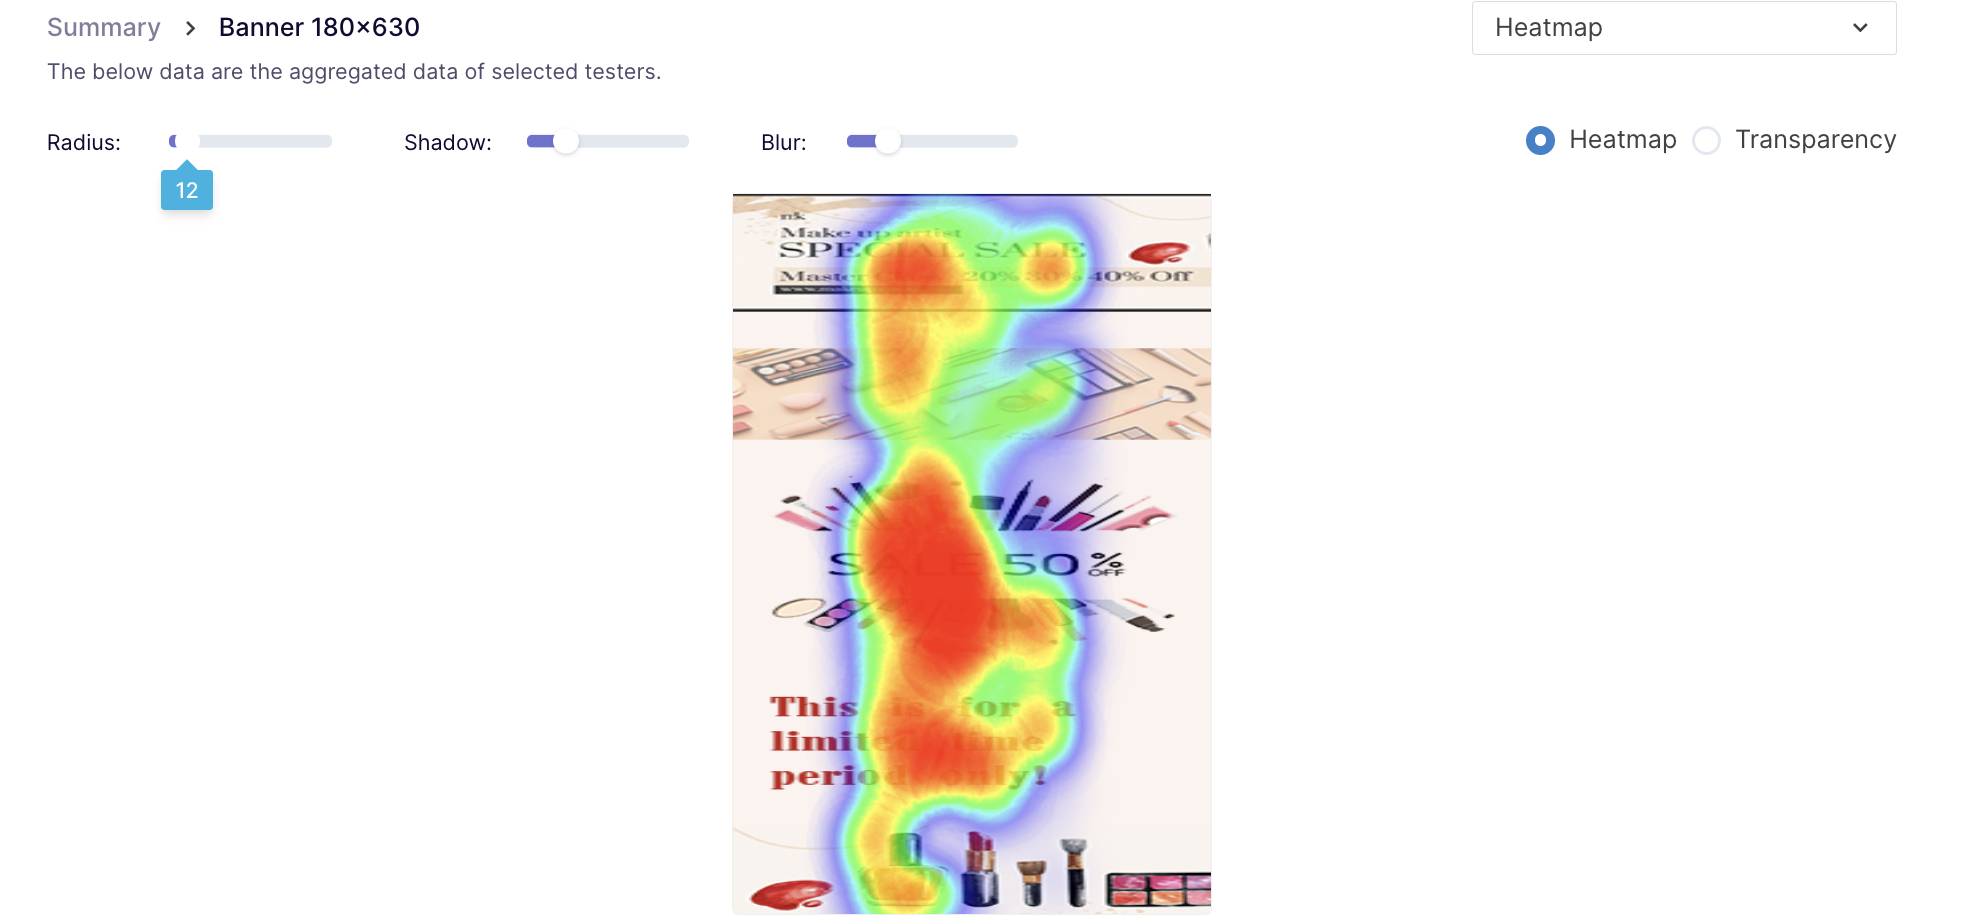
Heatmap and Transparency map
Heatmap: A heat map is a visual representation of areas that were viewed most by the respondents. It uses a VIBGYOR gradient to change colour and intensity, with brighter colours highlighting areas that were viewed more often by the respondents. This can be used to identify the most viewed parts of the ad.
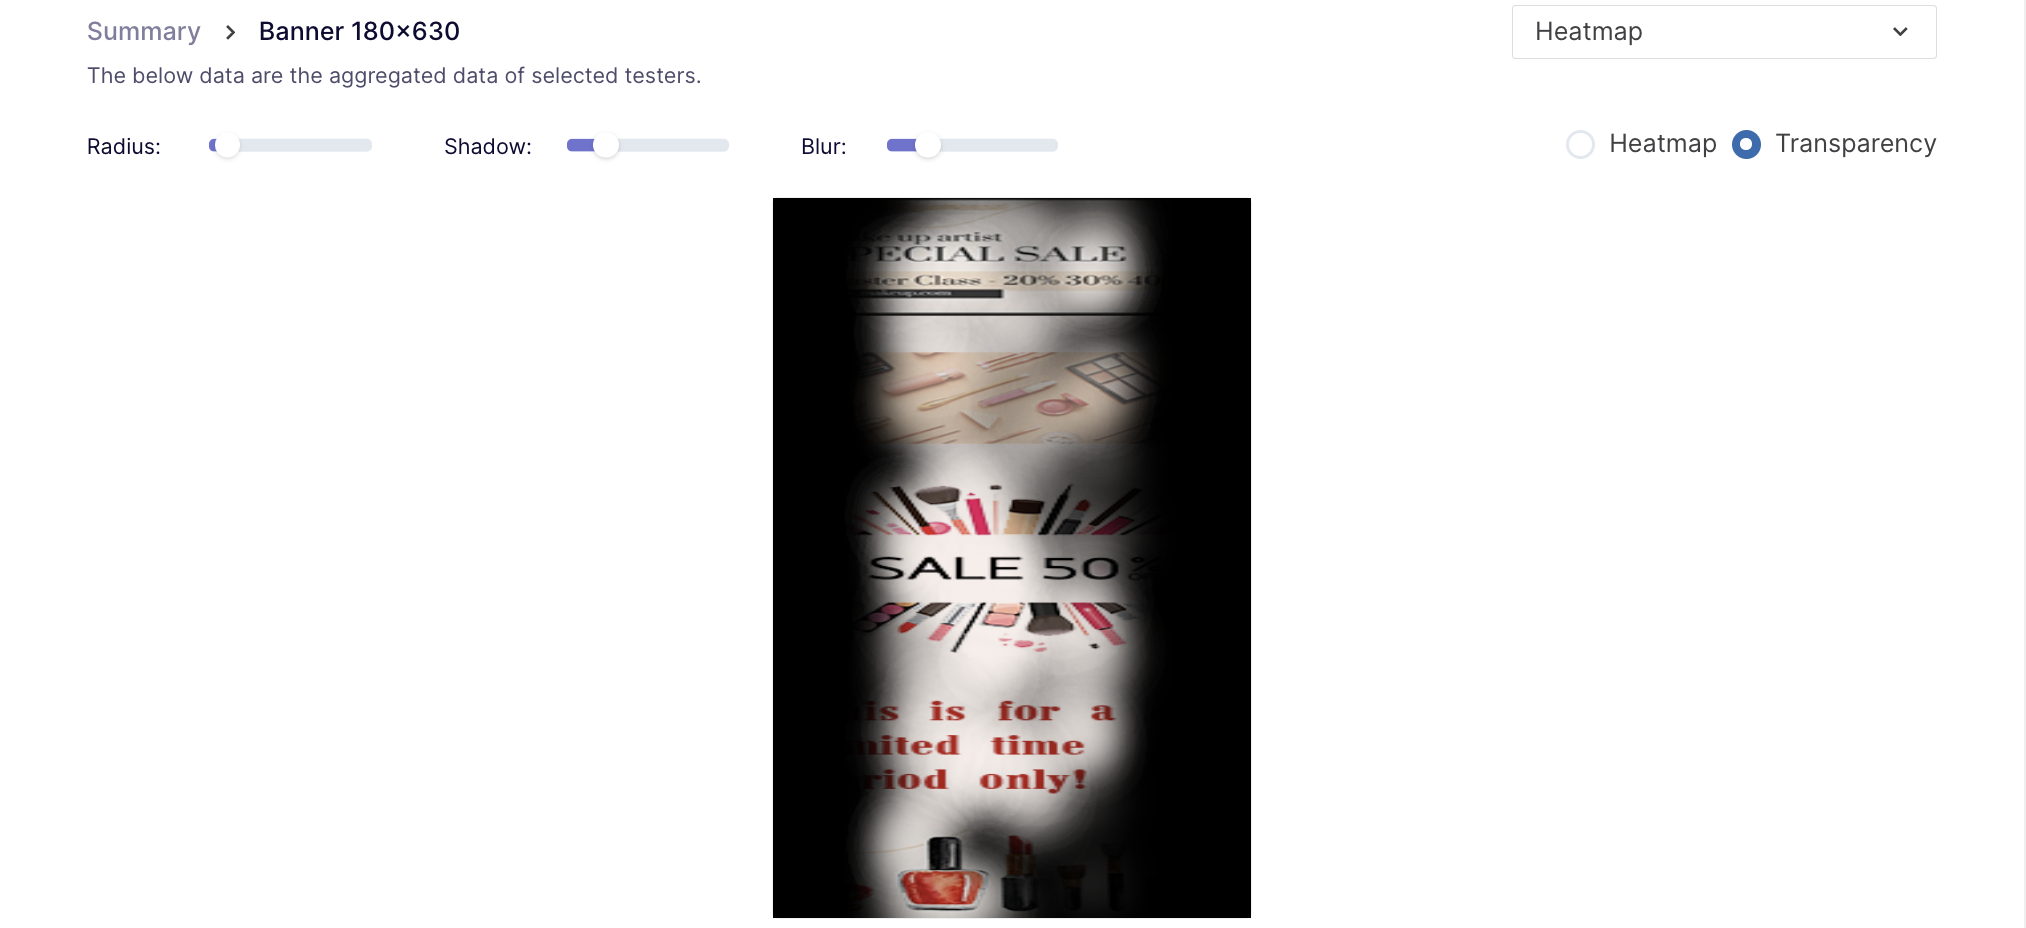
Transparency map: Just like Heat maps, Transparency maps are also plotted using the respondents' Gaze Points on top of the media. But instead of using varying colour intensities, the media is made transparent where the gaze points aggregate.
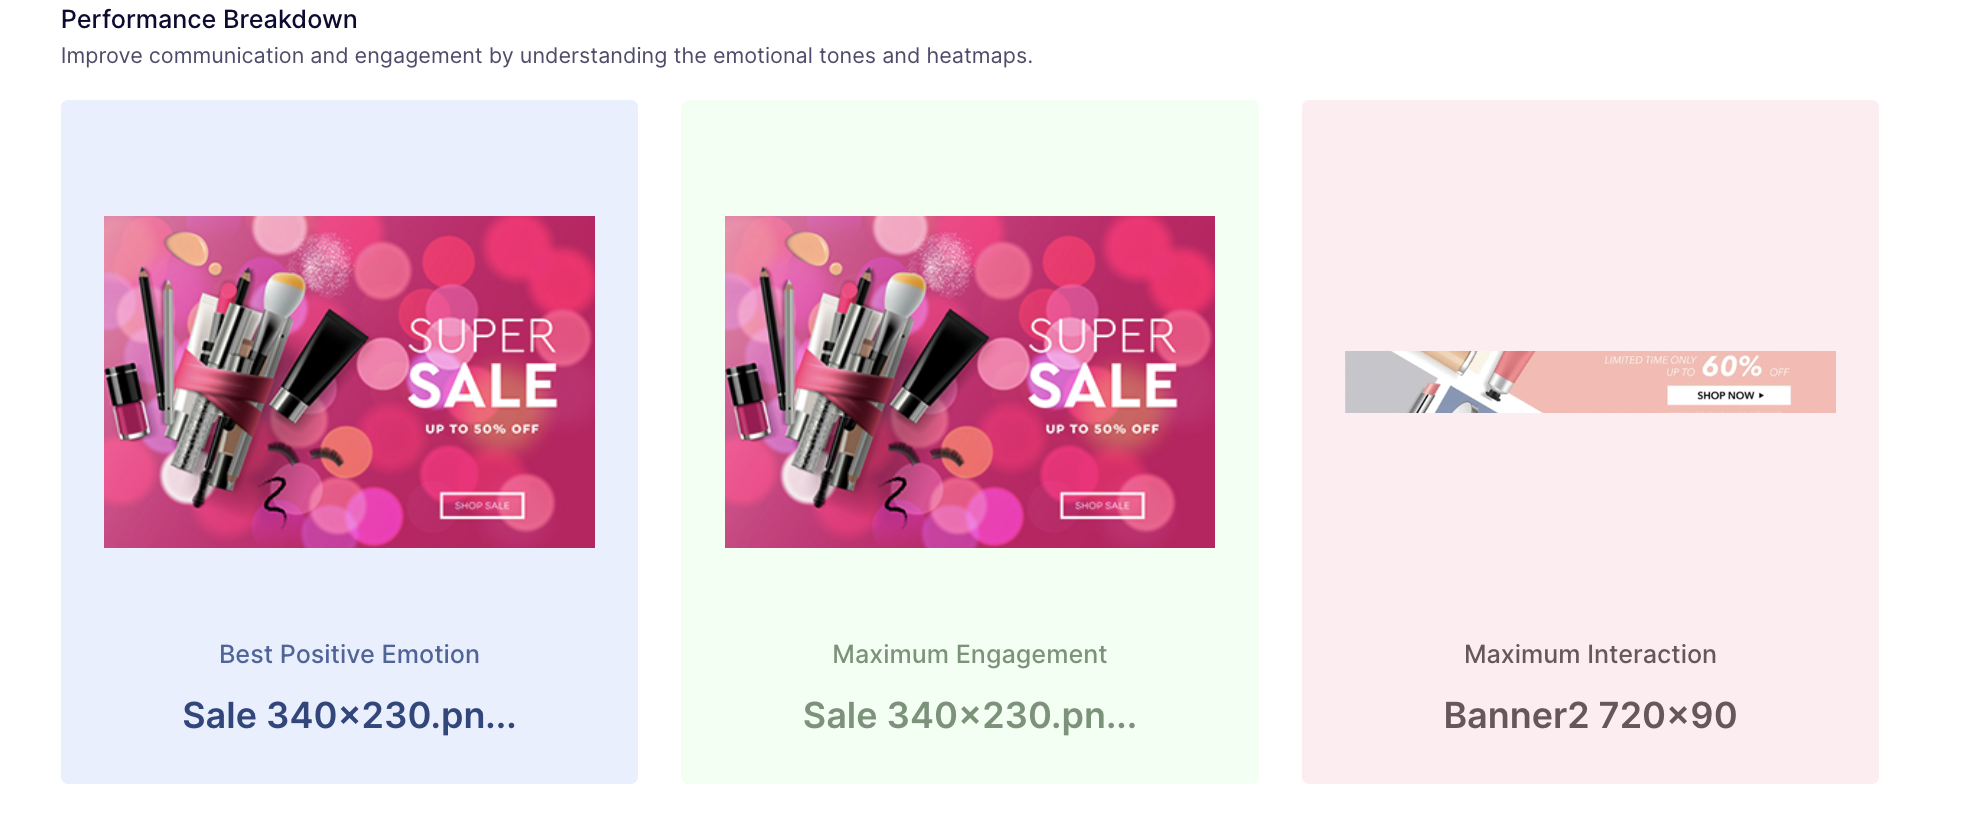
Insights Download
You can also download the insights in the CSV. In the downloaded format, you will find other important metrics along with their definitions, units of measurement and other important details.
Media level Download CSV: In this format, you will find data for all the media for all the metrics.
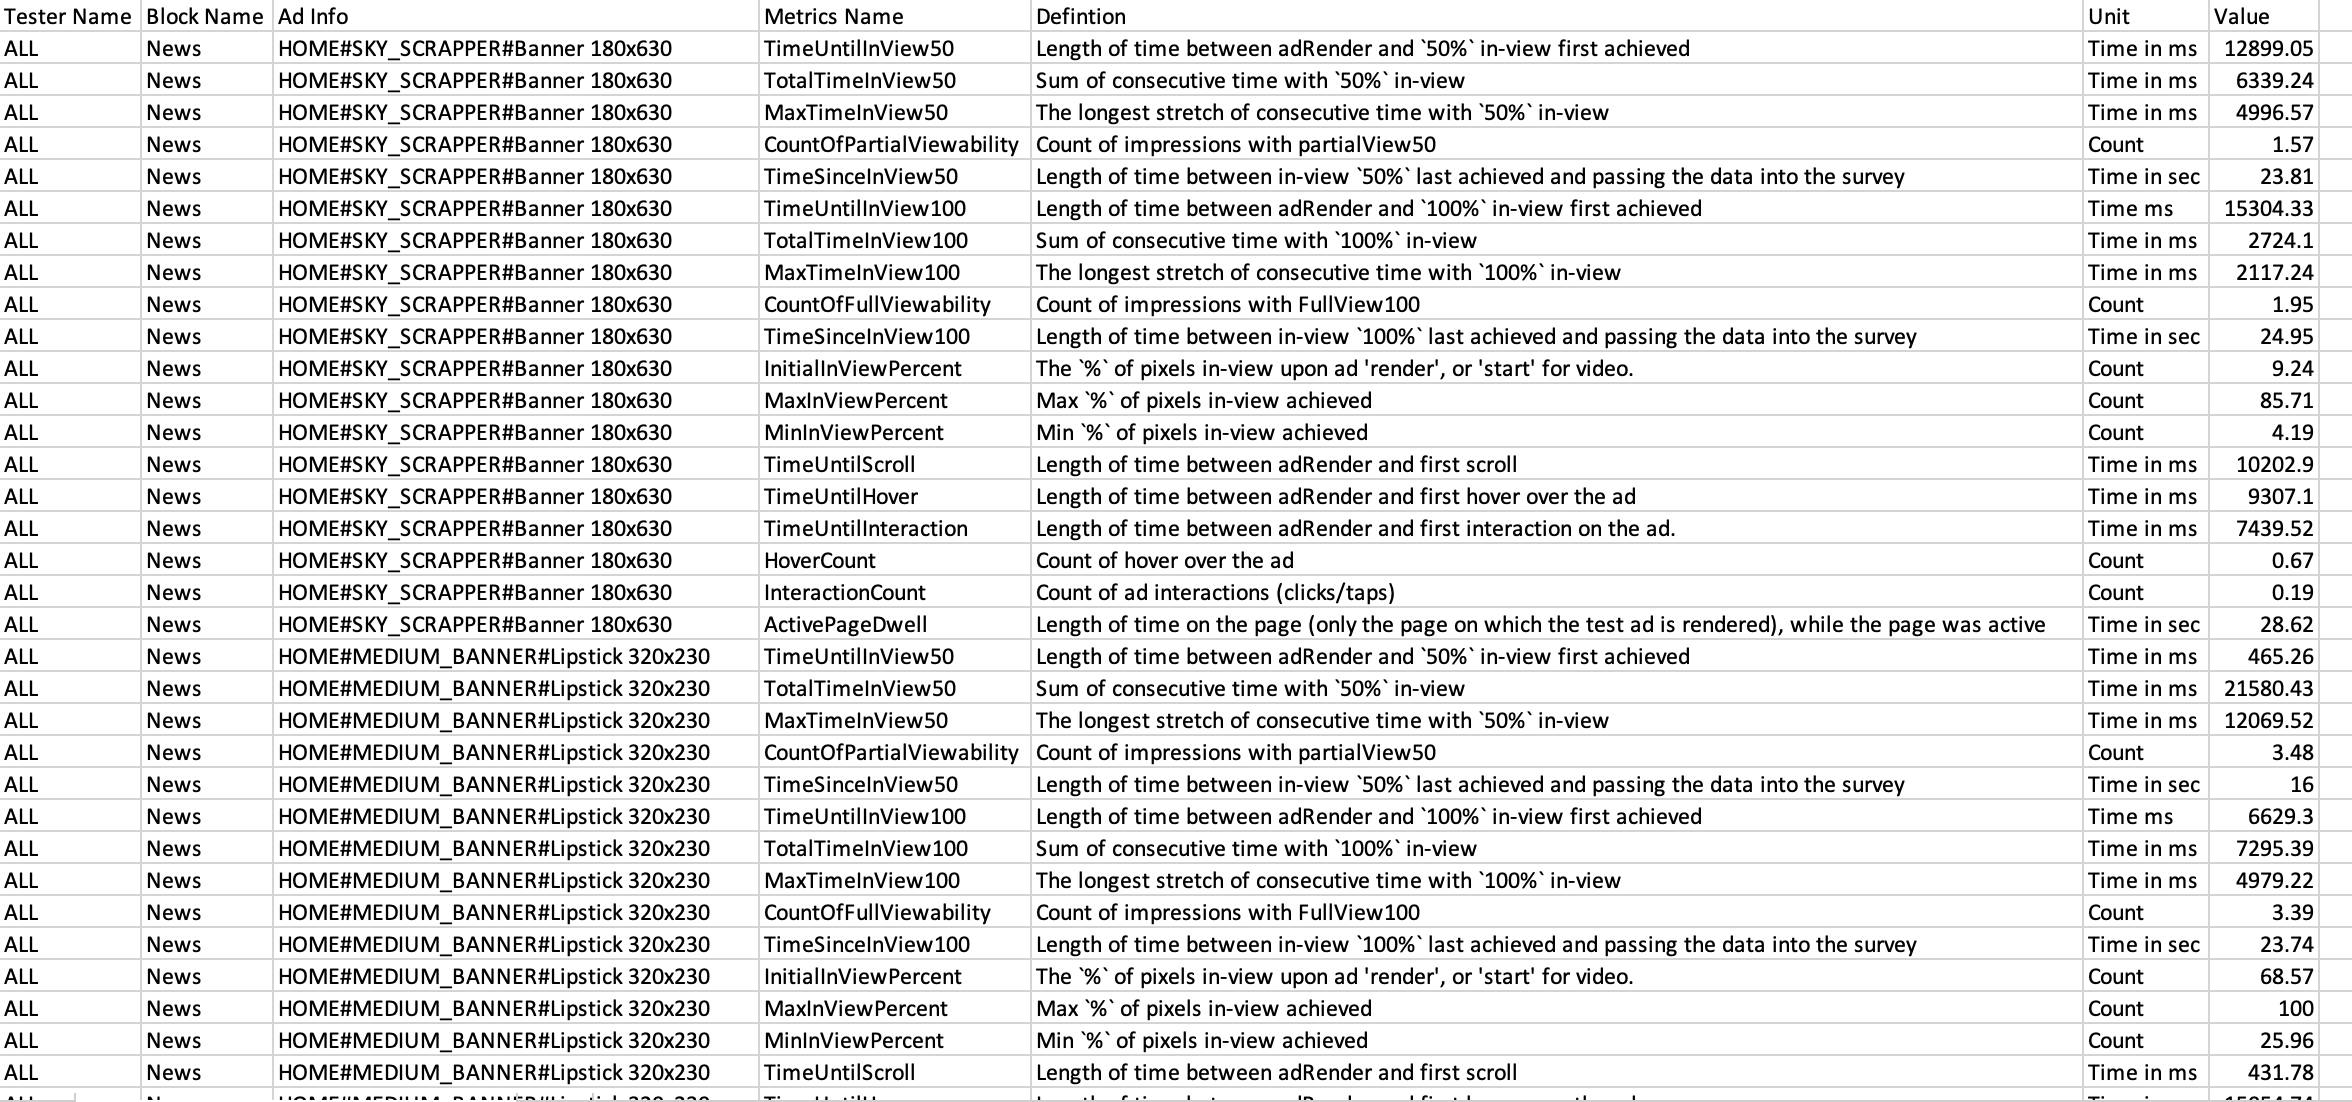
Tester level Download CSV: In this format, you will find tester-wise data for all the metrics, for all the ads.