Thumb Up/Down Block
Overview
A Thumbs Up/Down block collects quick, instinctive reactions from participants by asking them to indicate whether they like or dislike something.
Block Details
Enter the Question: To personalise a question using an answer from a previous block, type @ in the question field. A list of earlier questions will appear. Select the one you want to pipe from.
Example:
Previous Question: Which shampoo brand do you currently use?
Options: Dove Shampoo, Head & Shoulders, Pantene, Clinic Plus, Sunsilk and Tresemmé .
Thumbs Up/Down Block Question: Do you like the fragrance of @Which shampoo brand do you currently use?
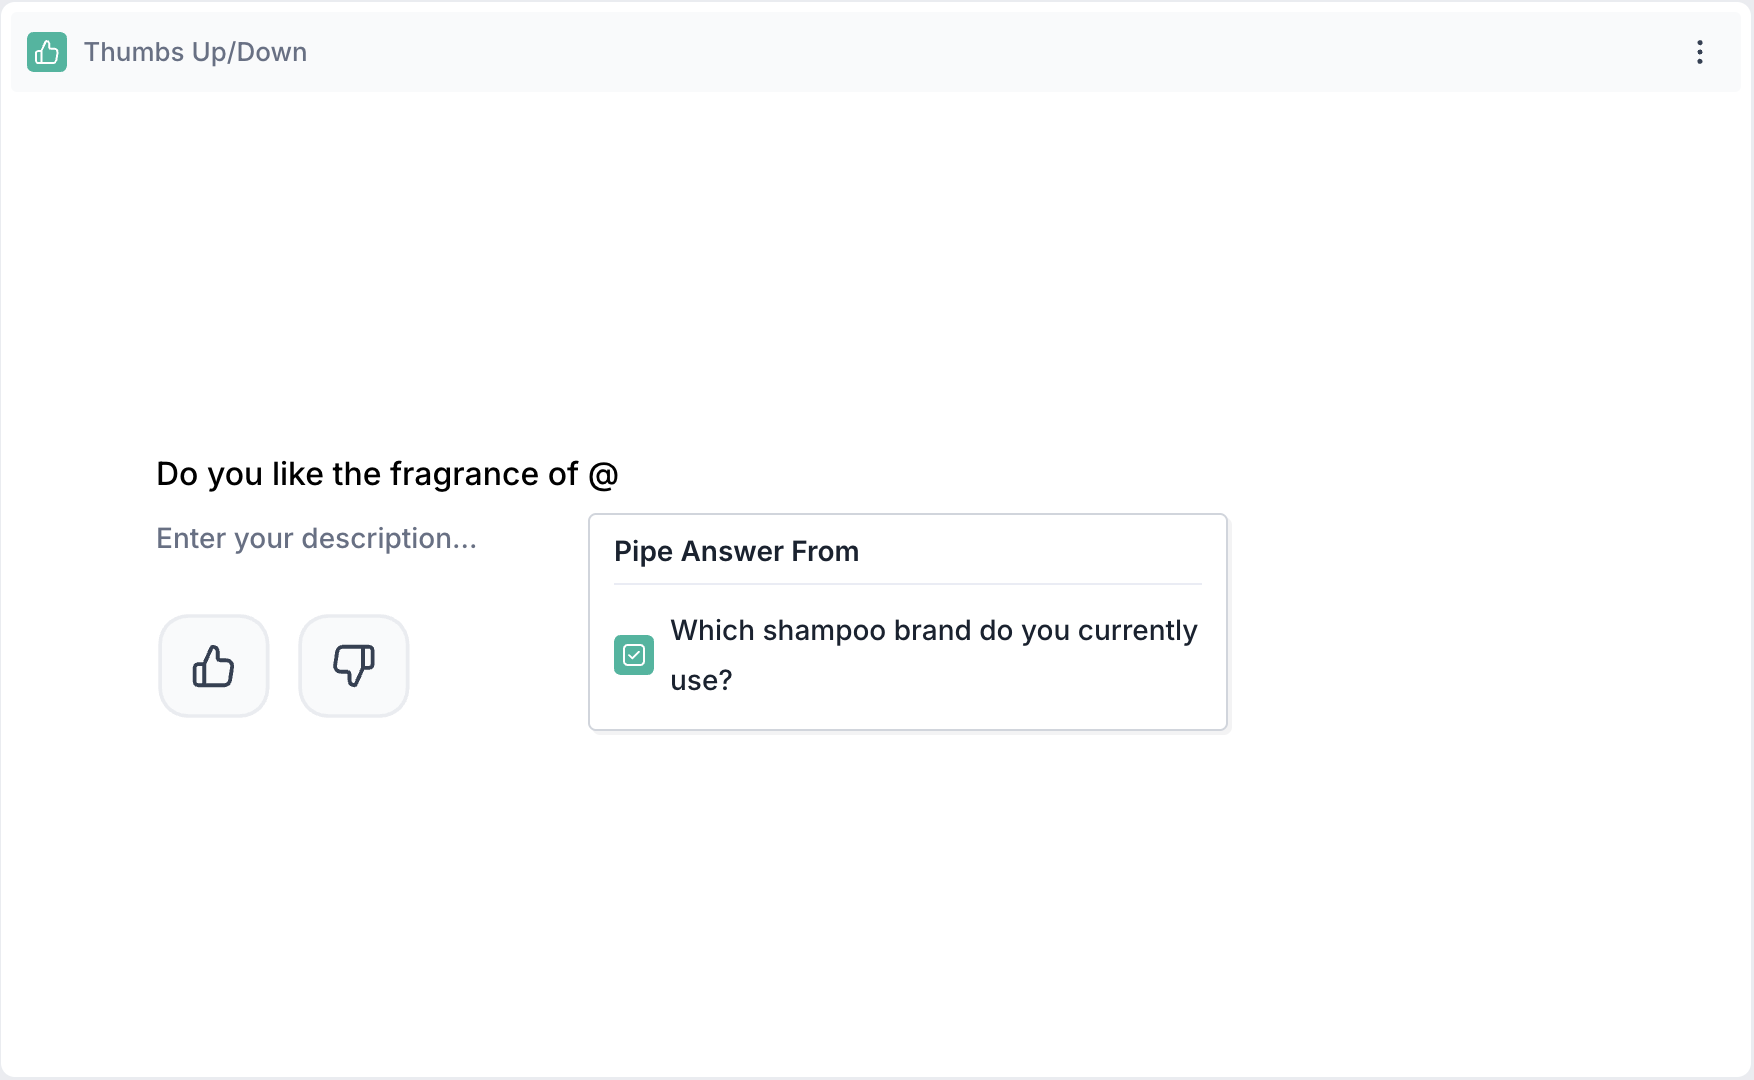
If the respondent selected Dove Shampoo in the previous question, the Thumbs Up/Down question will appear as, Do you like the fragrance of Dove Shampoo?

Properties
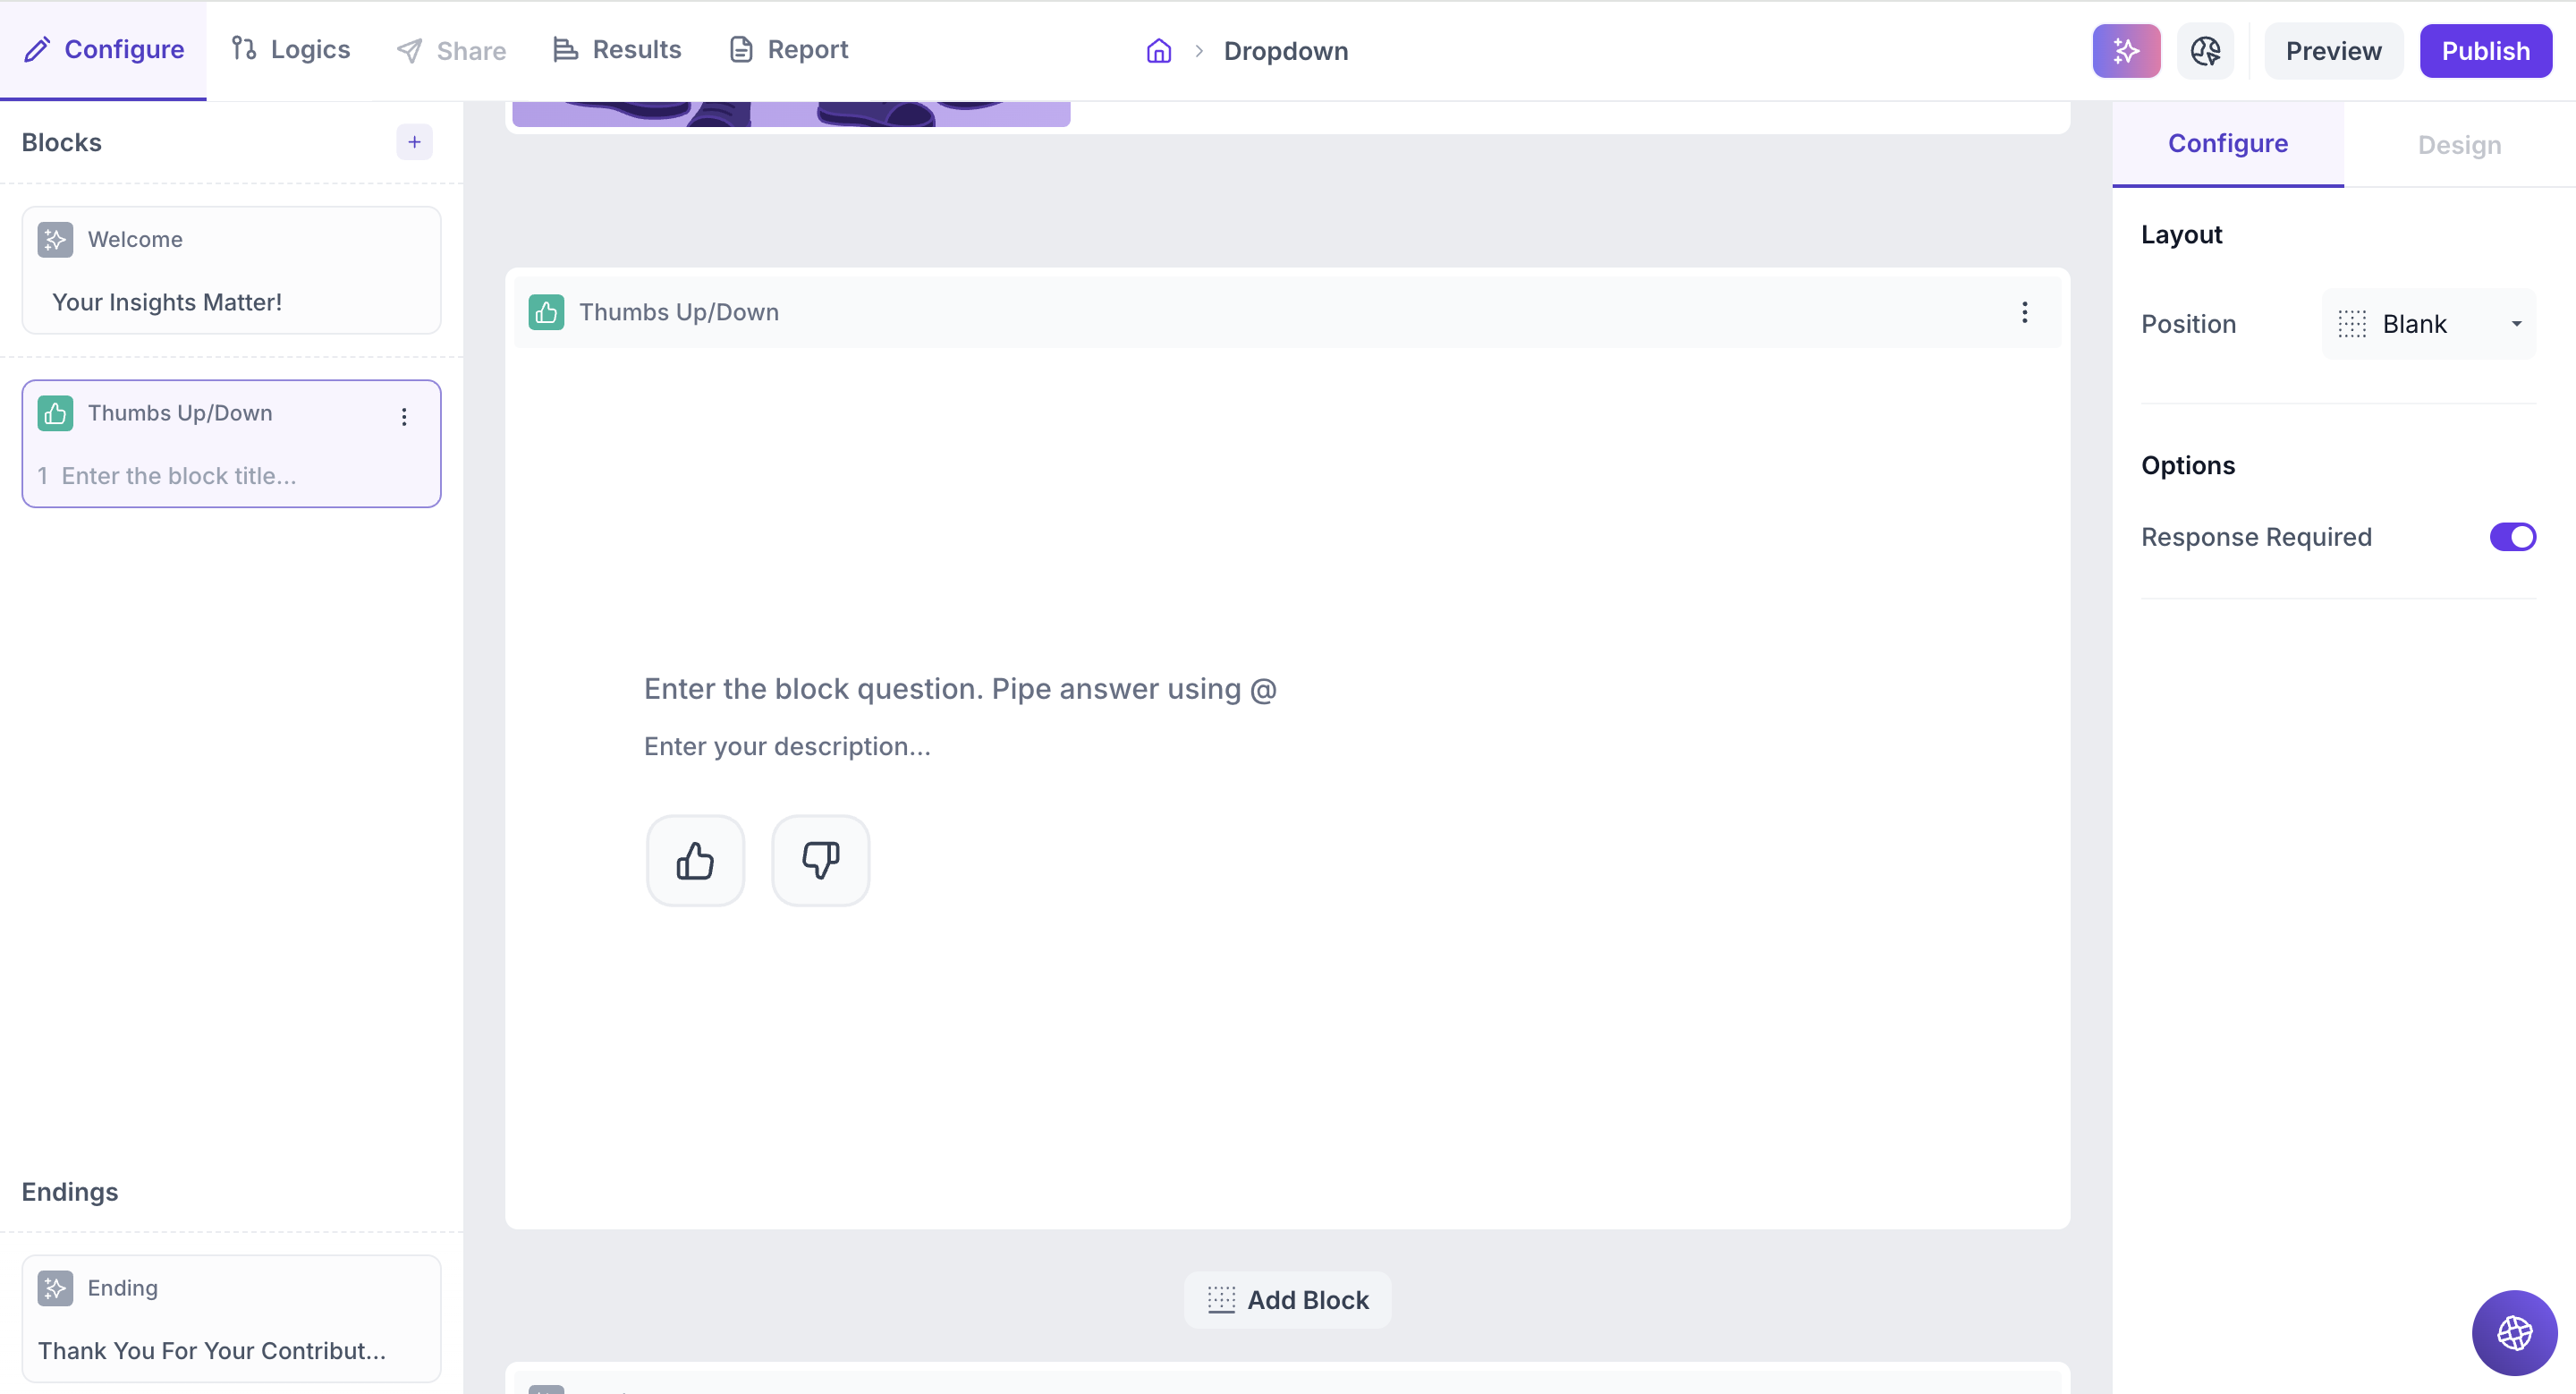
You can configure the Thumbs Up/Down block using the following properties in the right-side panel:
Layout: You can add an image such as a product photo, packaging design, advertisement visual or brand logo to the block by selecting a layout position.
1. To add an image, select a layout position from the right panel. By default, the layout is set to Blank. To enable image upload, select a different layout option:
- Left
- Right
- Top
2. Upload or Select an Image: Once a layout is selected, you'll see an option to:
- Upload an image from your device
- Choose from predefined images available in the platform’s image library.
Options
Response Required (Enabled by default): This setting ensures respondents must select an option before proceeding to the next question. You can disable it if you want to make the question optional.
Result
Once your study is published and respondents have taken the test, you can analyze the block-wise results of the questions asked.
Overall Results
Once your study is published and respondents have completed it, you can view the results for each block. For a Thumbs Up/ Down block, results are displayed as a column chart.
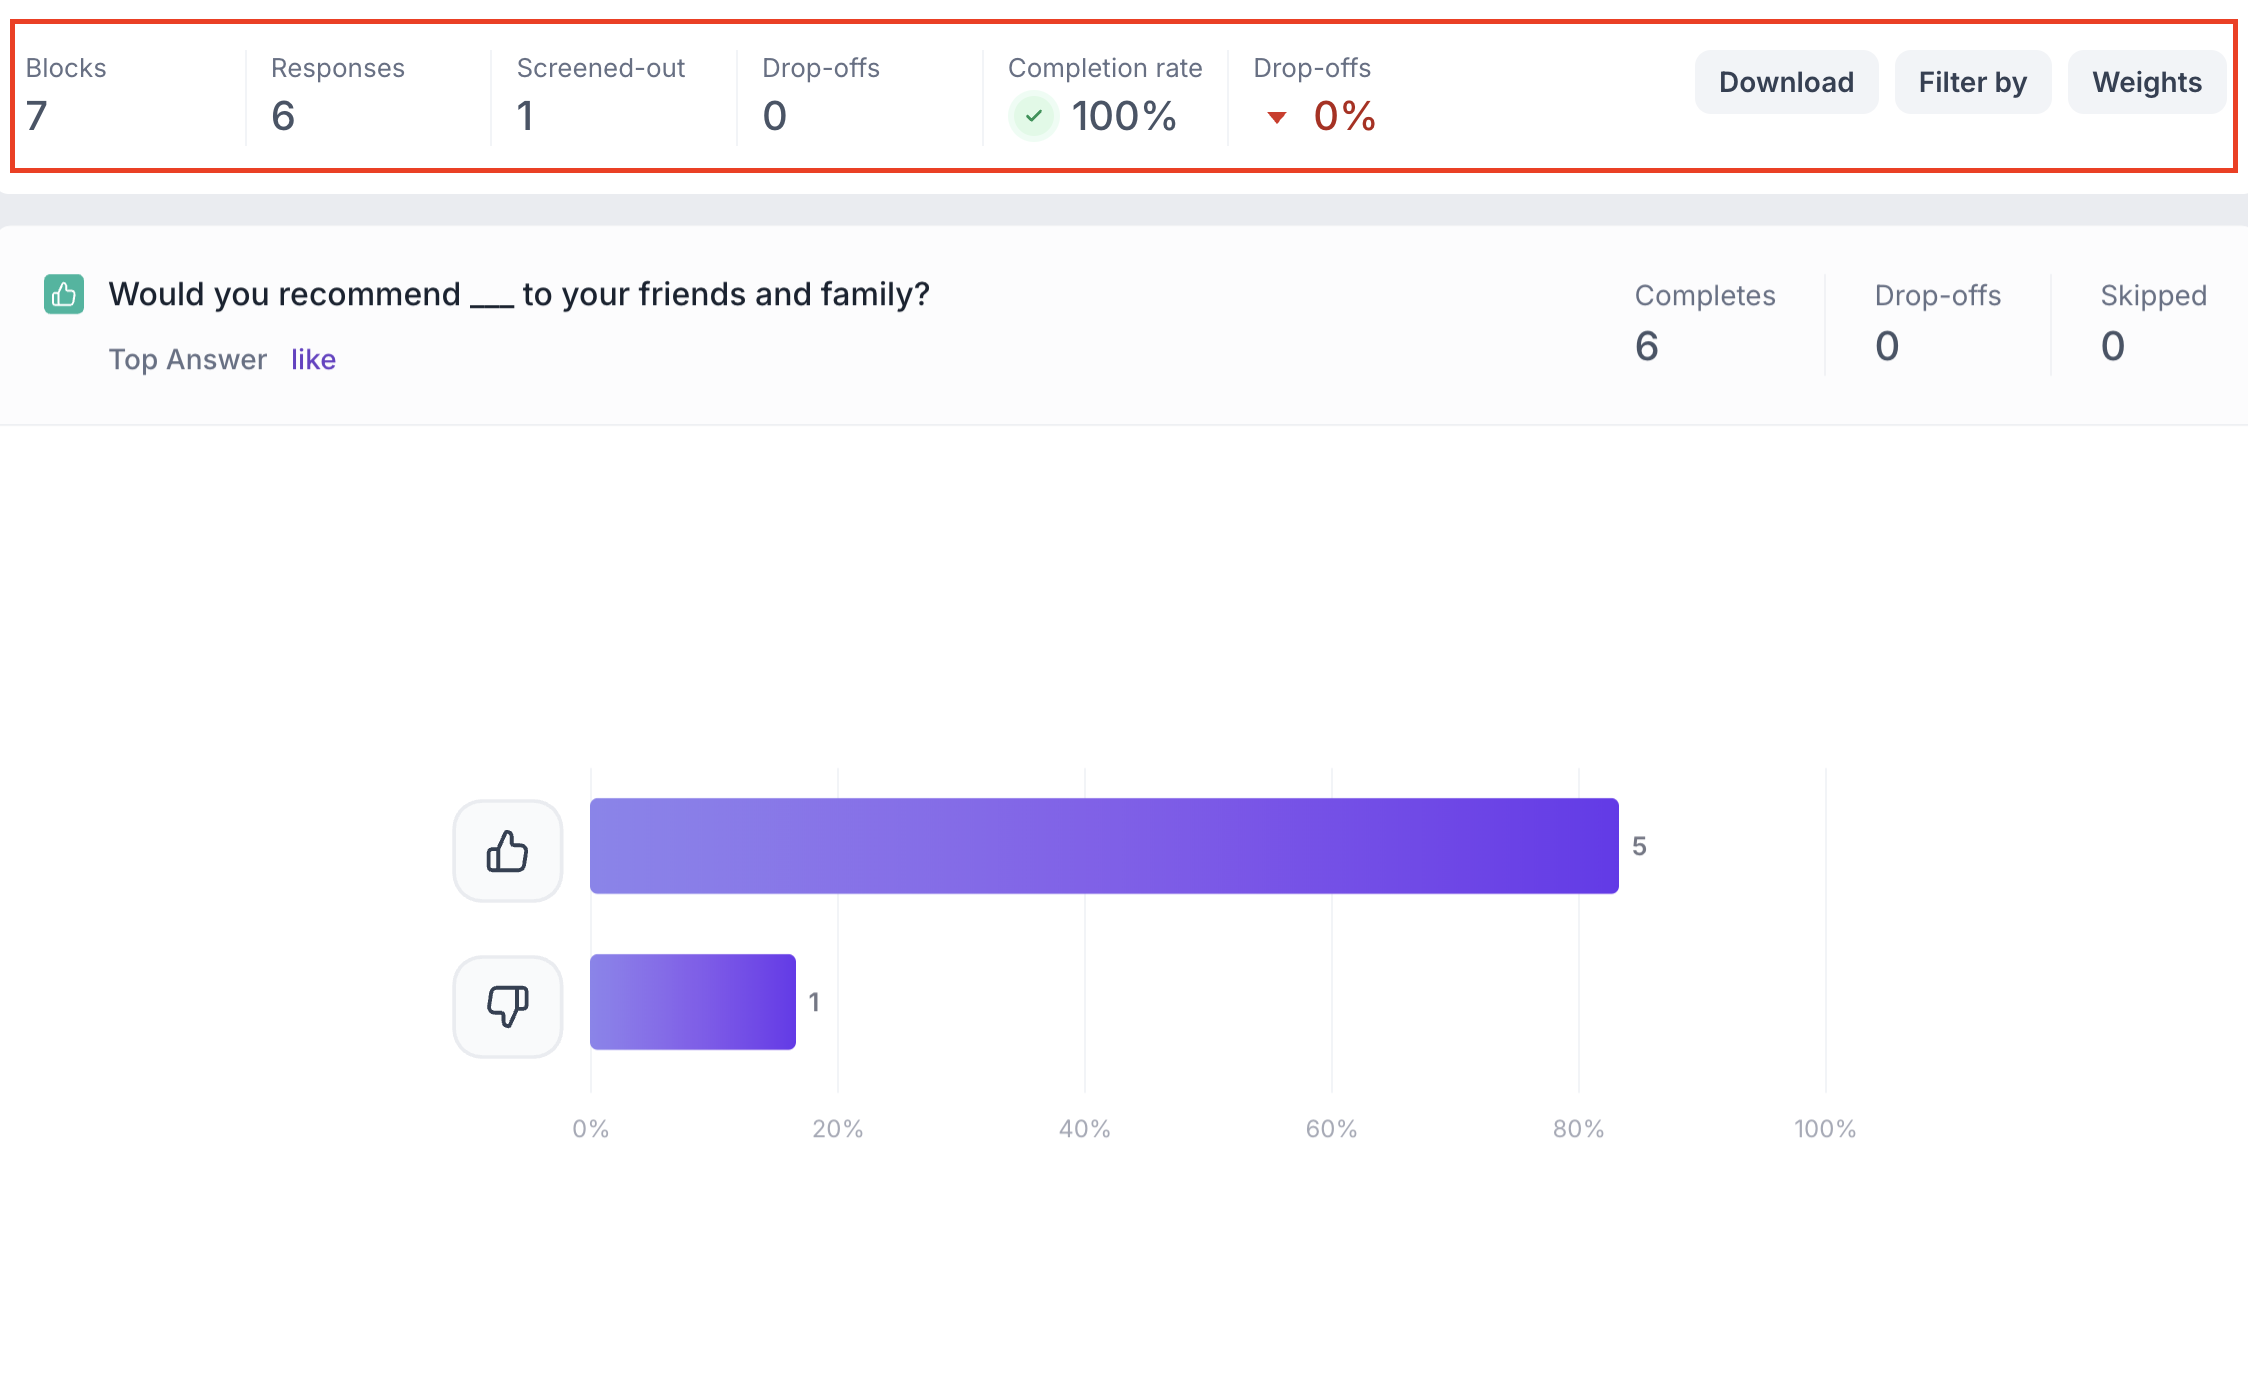
1. Top Summary
This section provides an overview of how your study performed:
- Total Blocks – Number of question blocks included in the study
- Total Responses – Count of completed responses across all blocks
- Screened Out – Respondents who didn’t qualify based on screener logic
- Dropped Off – Respondents who exited the study midway
- Completion Rate – % of respondents who completed the full study
- Drop-Off Rate – % of respondents who exited before completion
2. Study-Level Download
- Download all collected response data at the study level, covering every block and question.
3. Filter Responses
Use the filter panel at the top of the results view to analyze specific respondent segments.
You can filter based on:
- Answers from previous questions
- Device type (e.g., mobile, desktop)
- Browser used (e.g., Chrome, Safari)
This helps uncover trends and insights within specific user groups.
4. Weighting
Clicking the "Weight" button opens a right panel where you can:
1. Choose questions to apply weighting
2. View a table showing:
- Sample % – Actual respondent distribution
- Target % – Your desired audience distribution
Once applied, the platform recalculates results across all blocks based on the new weights, allowing you to analyze outcomes using your ideal respondent mix.
Thumbs Up/Down Question Block Results
1. Response Summary
- Completed – Number of respondents who answered the question.
- Drop-off – Respondents who exited the study before reaching this block.
- Skipped – Number of respondents who viewed but didn’t respond.
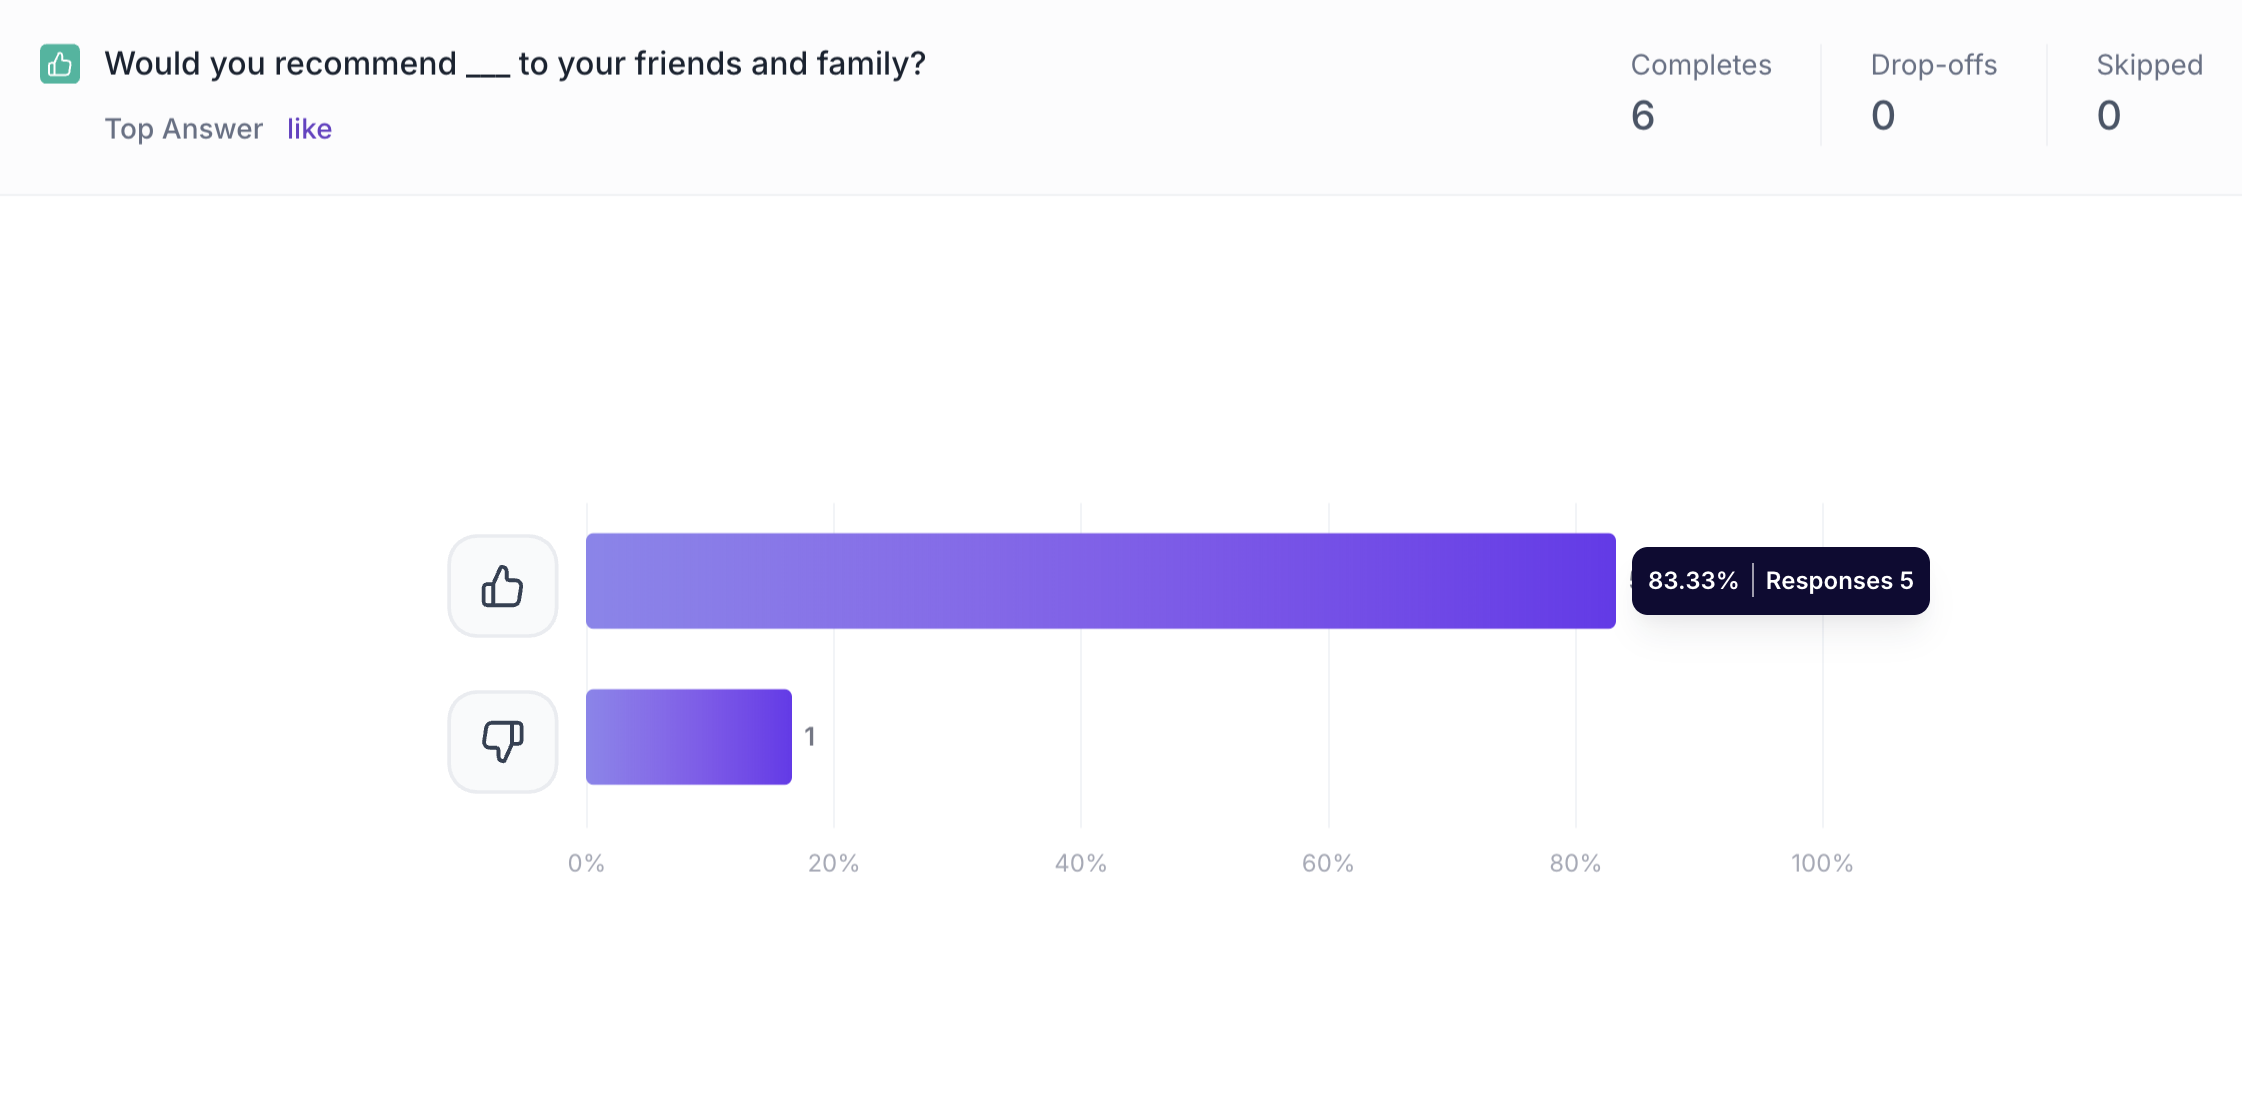
2. Pie Chart
For a Thumbs Up / Thumbs Down block, the results are displayed in a pie chart, with two segments representing the Thumbs Up (Like) and Thumbs Down (Dislike) responses.
Each segment shows:
- The percentage of total responses
- The number of responses
Just below the question title, you’ll see the top selected response as Like or Dislike, helping you quickly gauge the overall sentiment at a glance.