Youtube and Vimeo Block
Overview
Incorporating YouTube or Vimeo videos into your survey is a powerful way to capture both behavioural and emotional insights from respondents. By embedding public video links, you can analyze how respondents react using advanced tracking technologies like Facial Coding and Eye Tracking.
To add a video
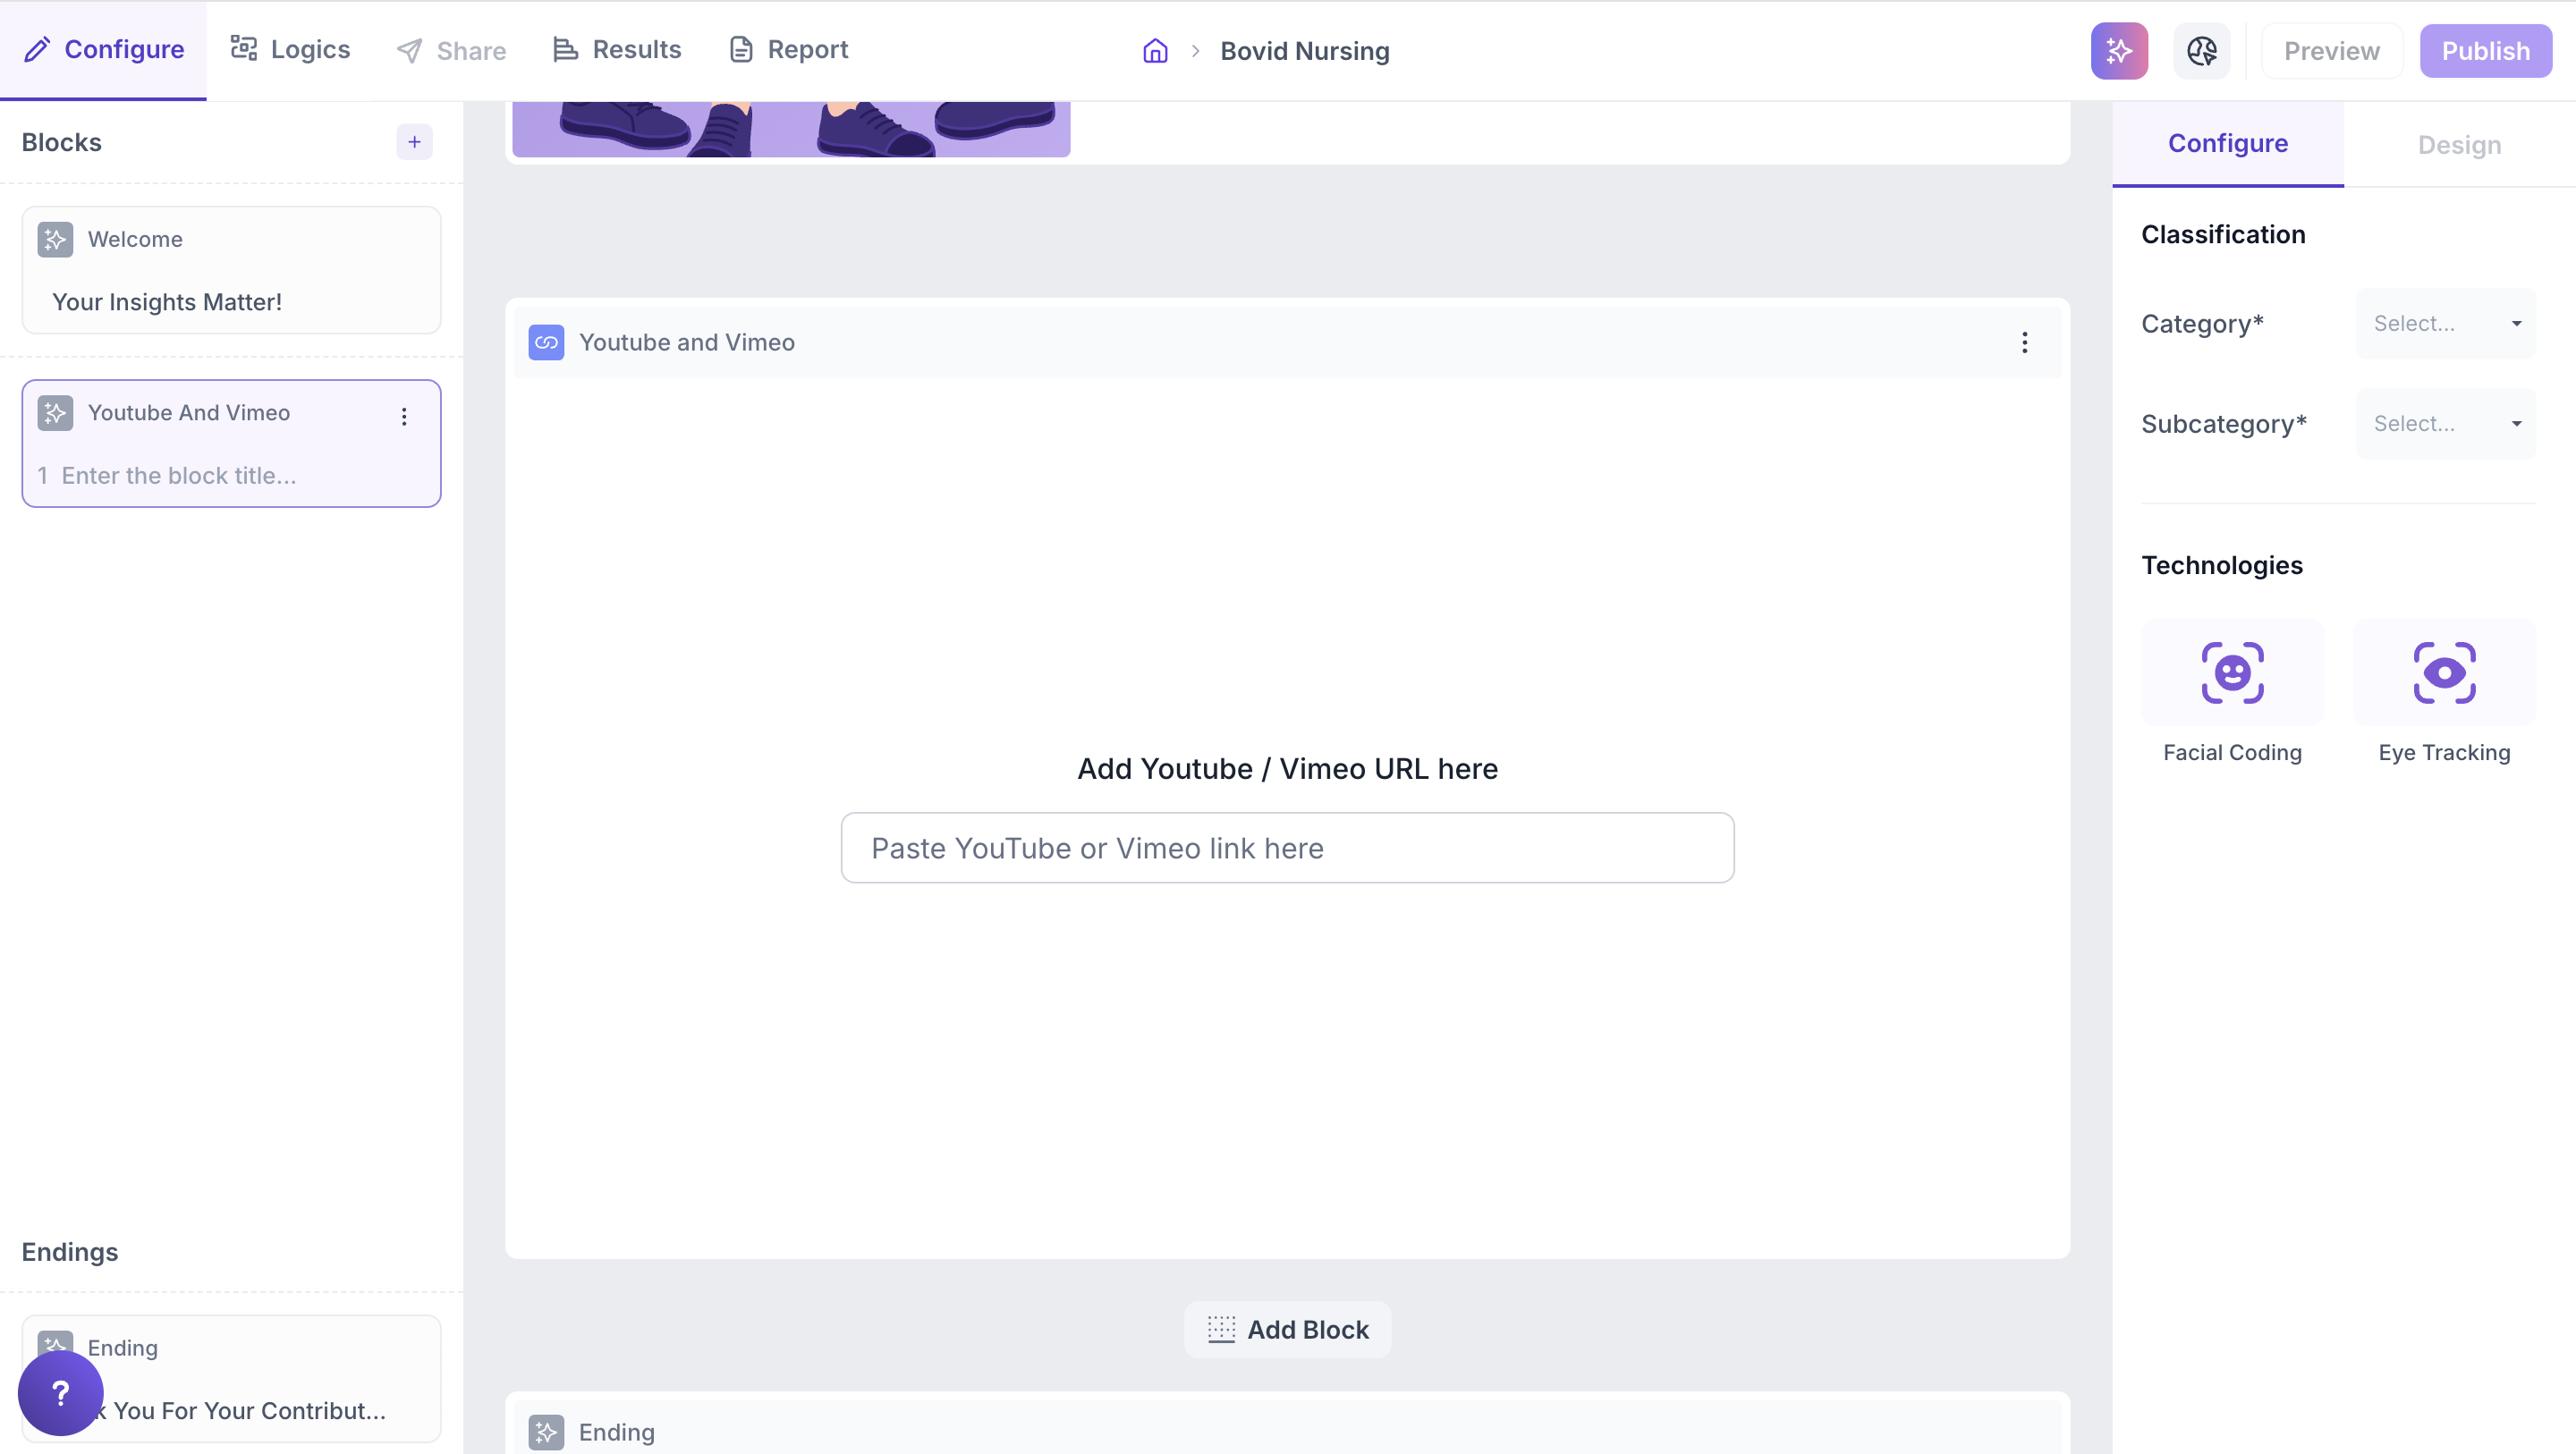
- Paste the public YouTube or Vimeo link into the URL field.
- The video will be automatically embedded into the survey block.
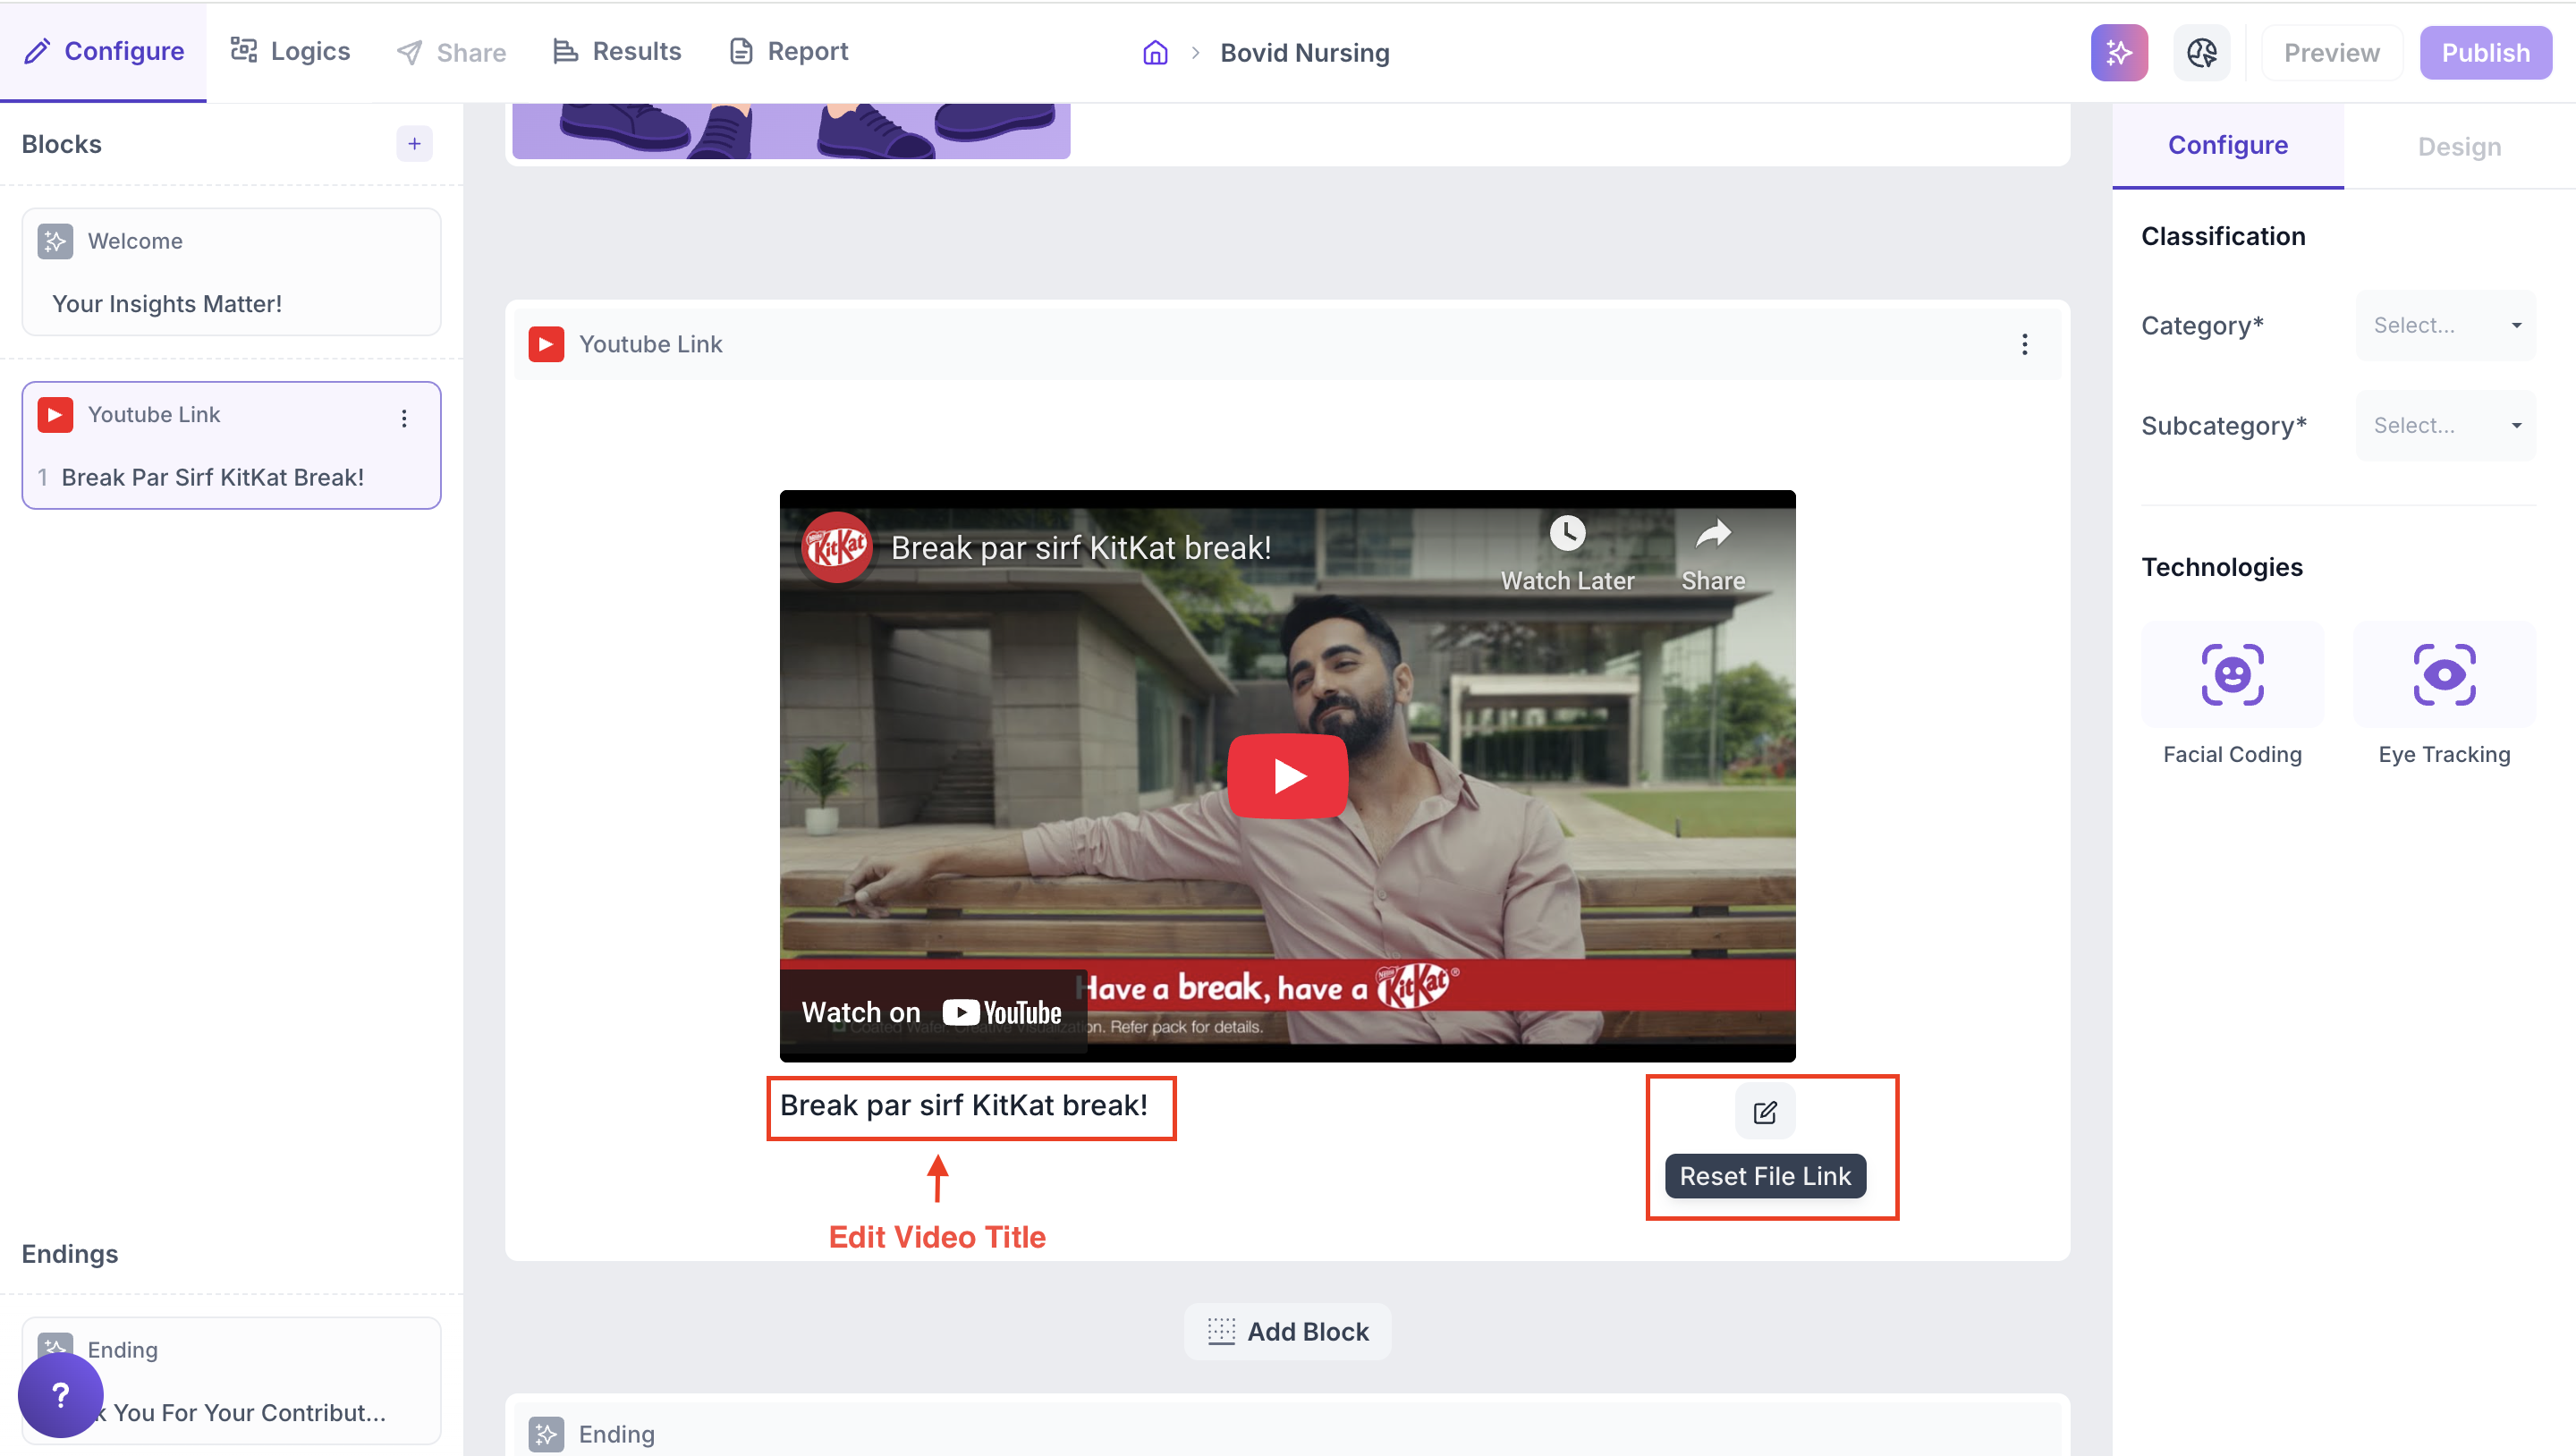
- You can edit the video title as needed.
- To replace the video, click the Reset File Link button and enter a new URL.
This seamless integration helps you collect deeper insights into attention, engagement and emotional response making your media testing more effective and data-driven.
Properties
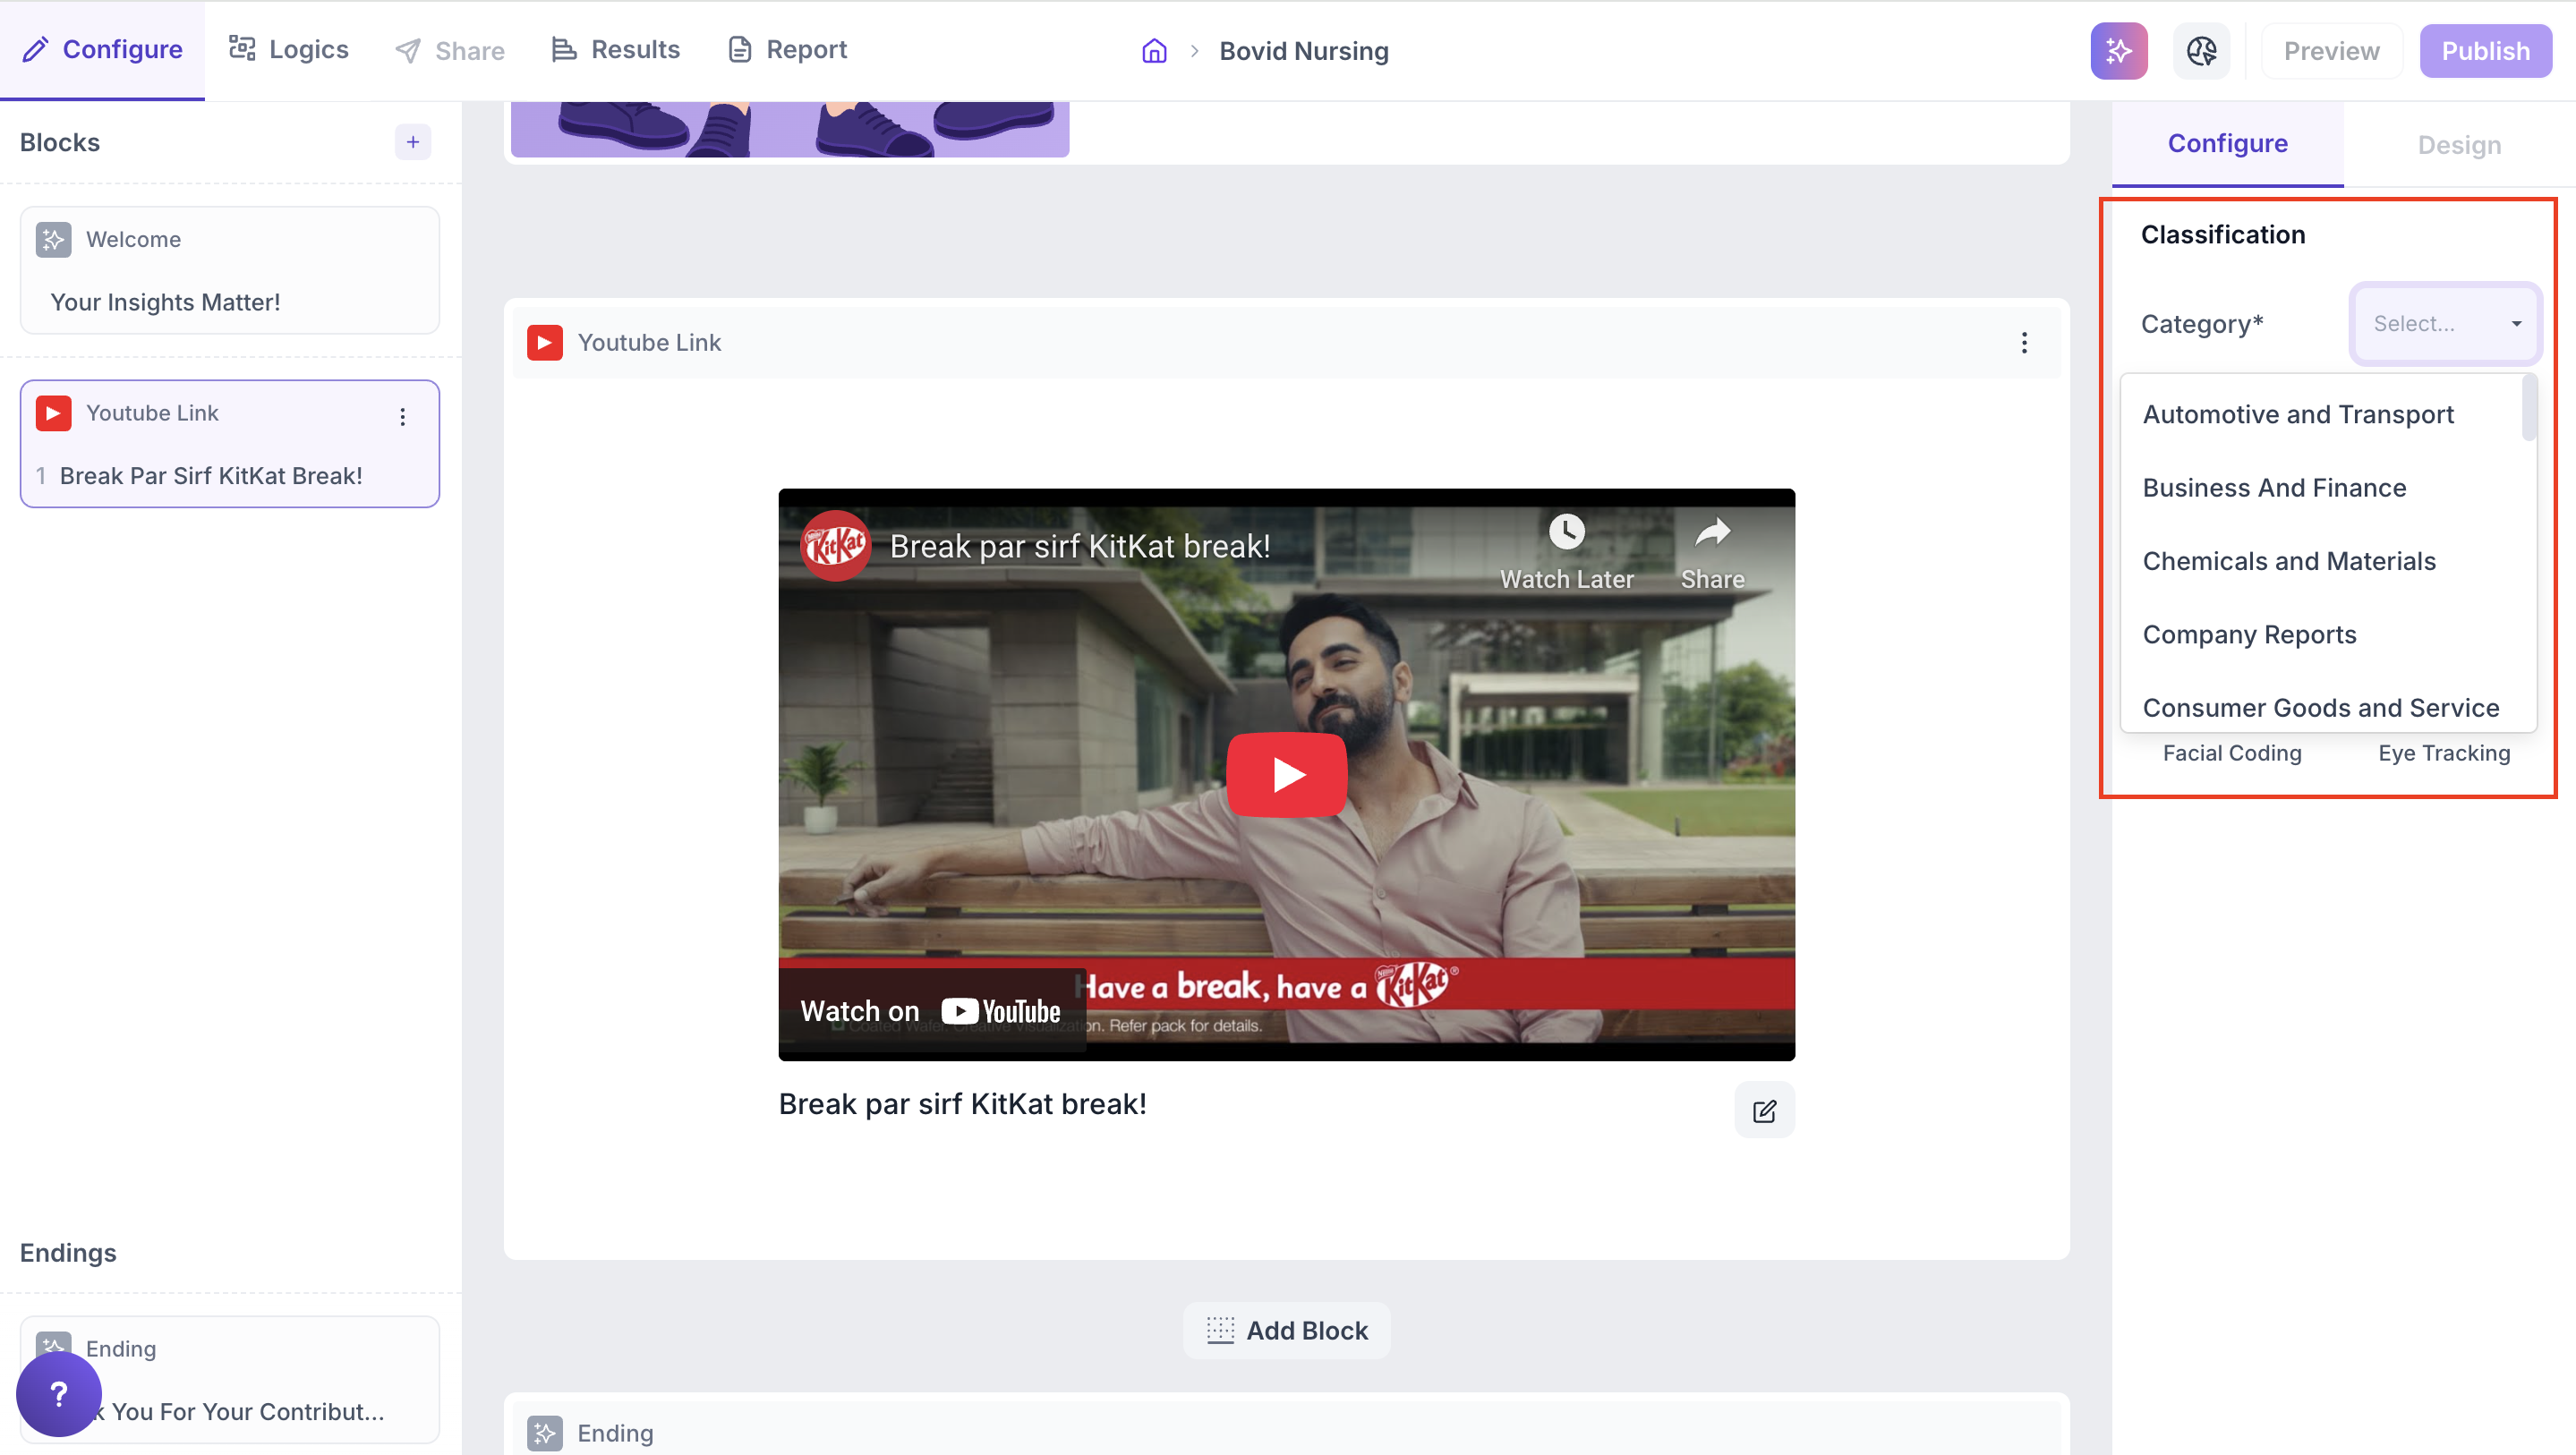
1. Category: Classify the media under a broader group. This helps benchmark your media’s performance against other media in the same category. To select, click the dropdown and choose the relevant category.
2. Subcategory: Further refine your media classification for more granular comparisons. Select the appropriate subcategory from the dropdown.
3. Tracking Technology: Choose how you want to track respondent behavior while they view the video:
- Facial Coding: Tracks facial expressions to identify emotional responses like happiness, surprise, anger, and more. (Requires respondent’s camera to be enabled.)
- Eye Tracking: Monitors eye movement and gaze to understand what parts of the video drew the most attention and how focus shifted over time.
Result
Once respondents have completed viewing your media, the platform automatically analyzes their behavior using Facial Coding and Eye Tracking (if enabled).
Here’s a quick summary of what you’ll find in your media insights:
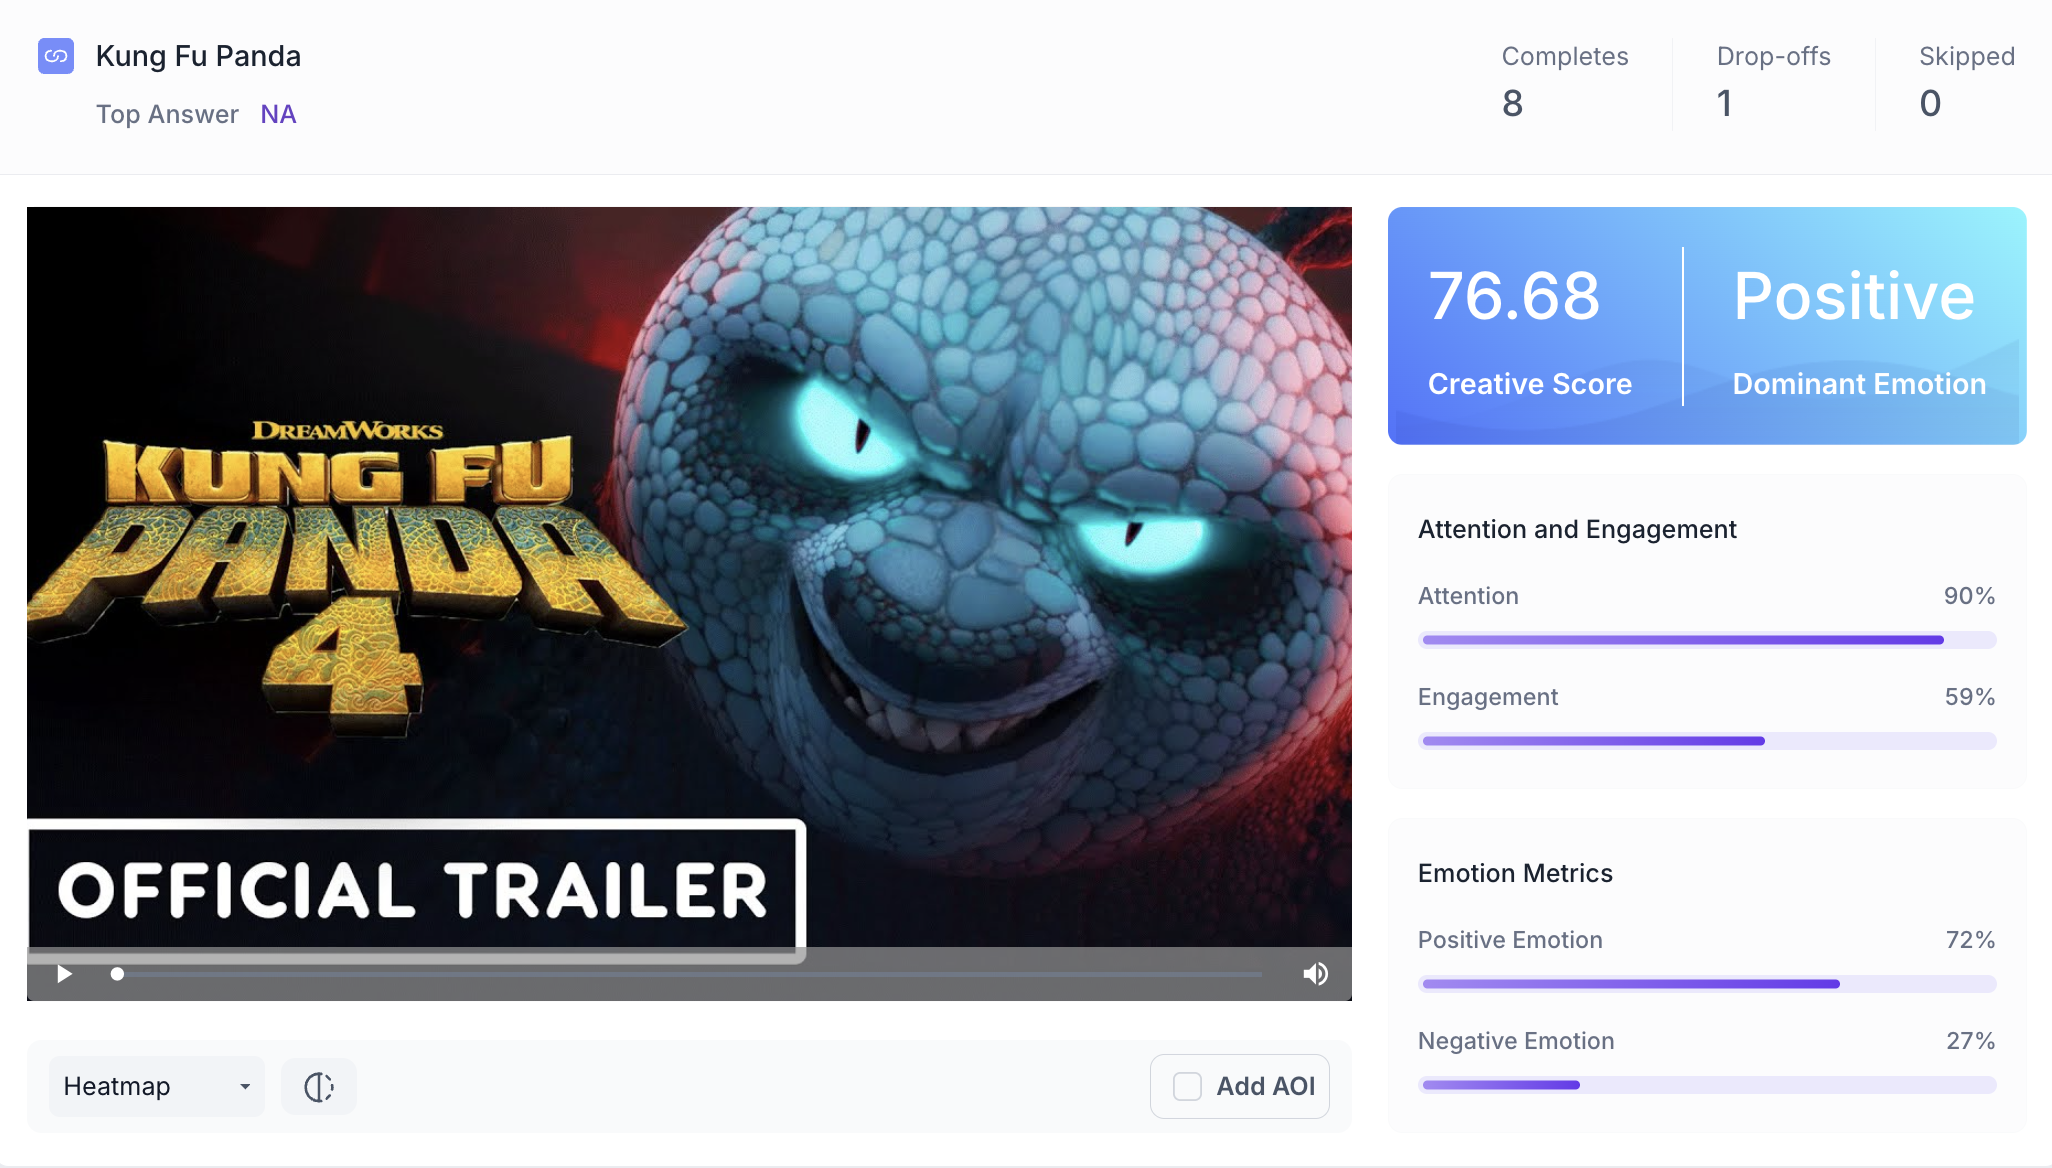
- Creative Score: Overall performance of your media
- Dominant Emotion: The emotion most commonly shown across respondents
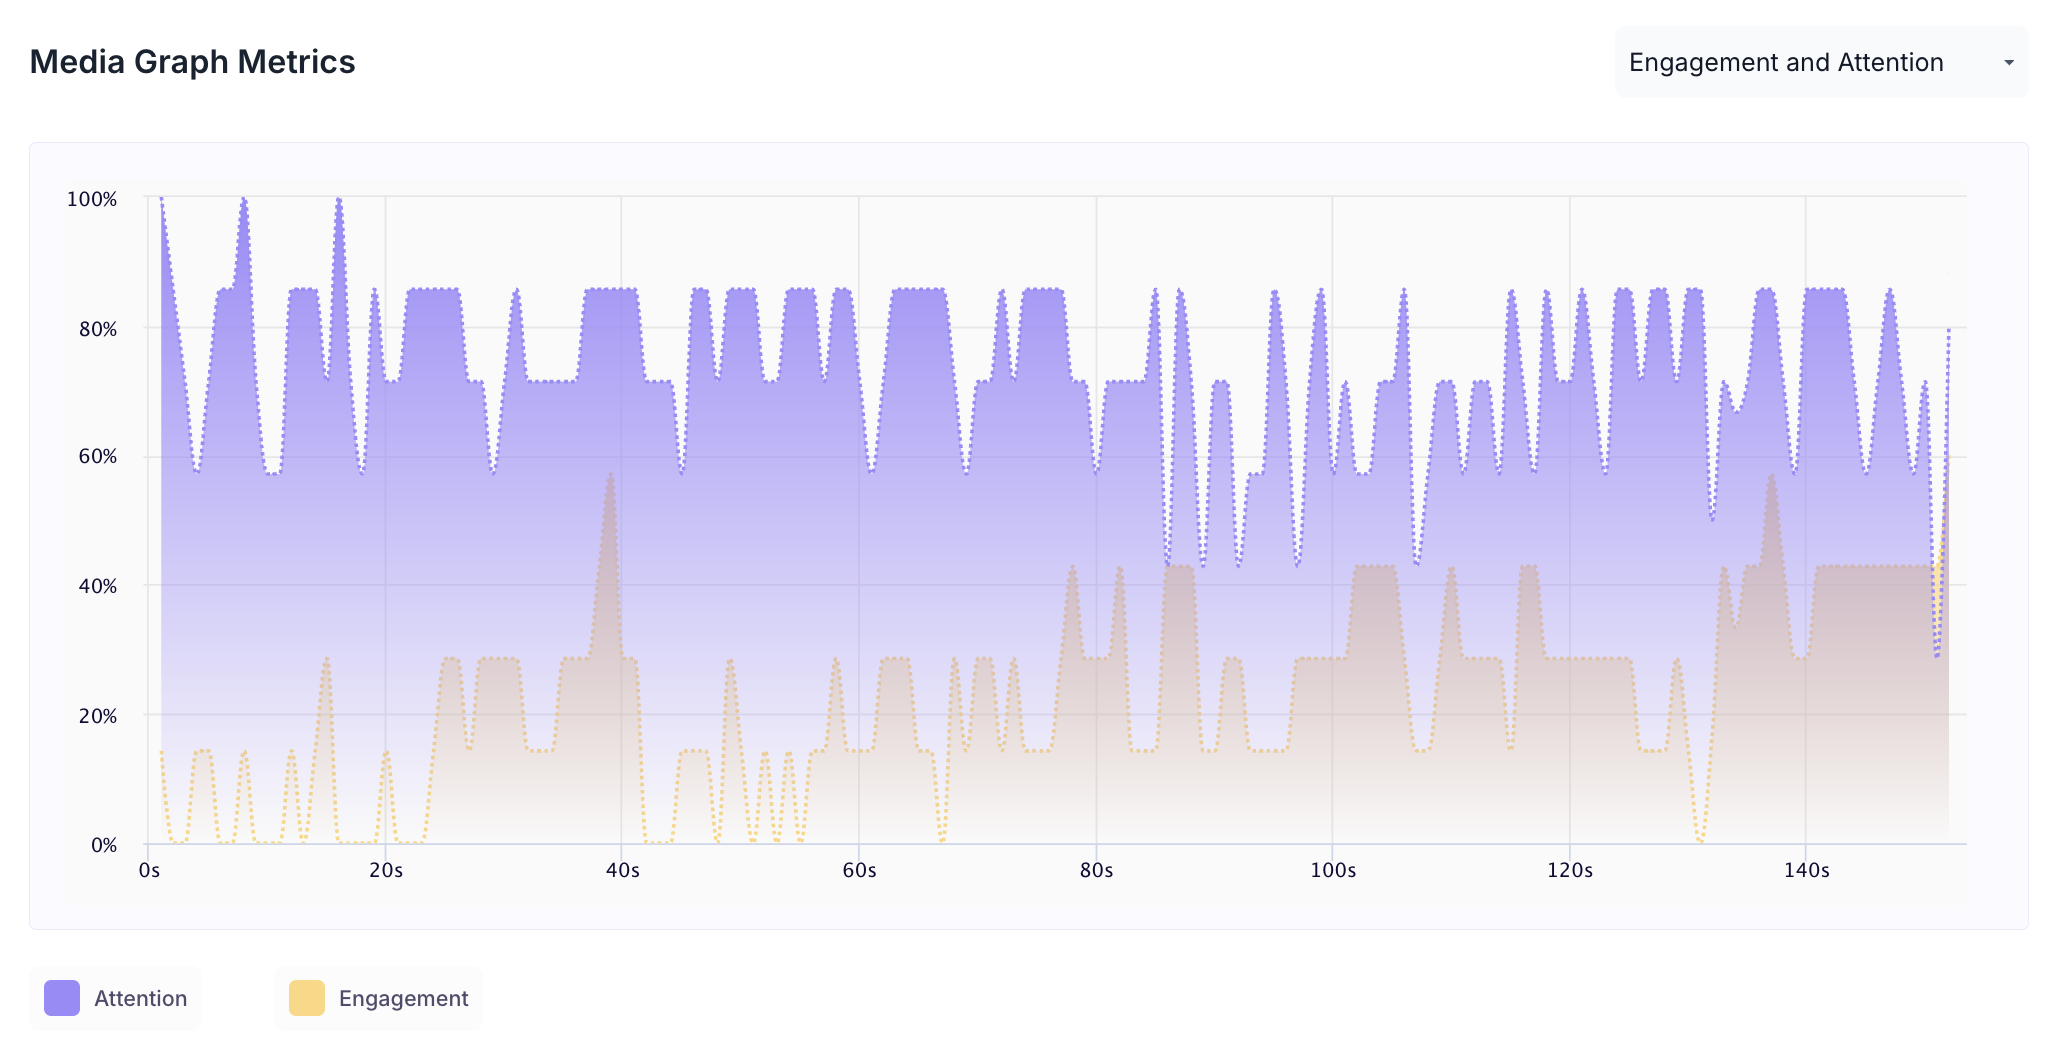
- Attention & Engagement: Measures visual focus and emotional intensity
- Emotion Analysis: Highlights positive (Happiness, Surprise) and negative (Anger, Disgust, Contempt) responses
- Second-by-Second Analysis: Interactive graphs showing how respondents reacted throughout the video
- Heatmap & Transparency Map: Visuals that show what areas were viewed the most
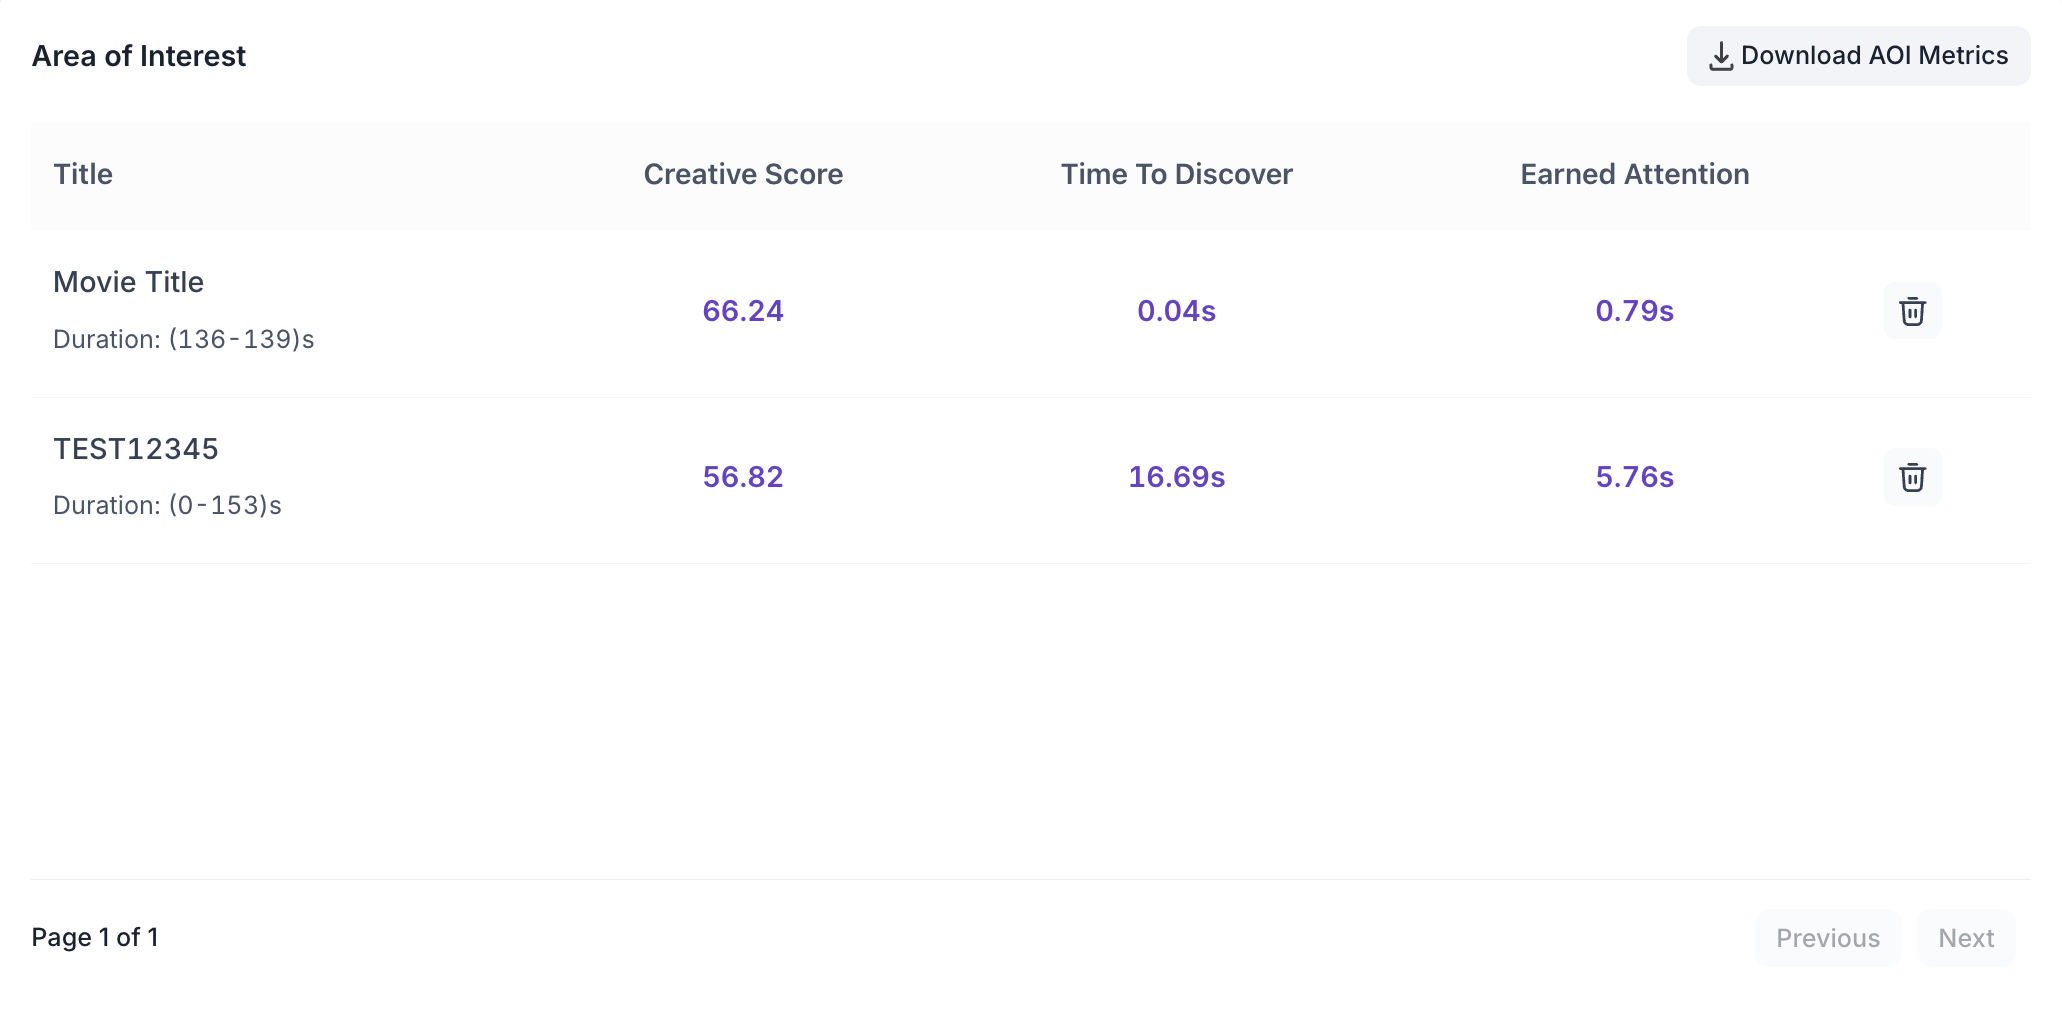
- AOI (Areas of Interest): Track attention and emotion in specific regions of the video
Area of Interest ( AOI ) Metrics
Media Graph Metrics