
Matrix Question Block
Overview
Matrix questions allow you to present multiple items (like product features, services, or statements) that respondents can rate using a consistent scale. This format helps collect comparative feedback in an efficient and structured way.
This block falls under the Advanced section category and is best used when you want to understand how different items are evaluated side by side.
When to Use Matrix Questions
Matrix questions are ideal for scenarios like:
- Product feature evaluation
- Brand perception studies
- Advertising feedback
- Customer satisfaction or usability surveys
They help identify patterns, trends, and areas needing improvement all from a single, unified question layout.
Why Use a Matrix Format?
Matrix blocks offer several advantages:
- Efficiency: Respondents rate multiple items in one go, reducing survey fatigue.
- Consistency: A uniform scale ensures data is directly comparable.
- Clarity: Organized presentation makes it easy for respondents to understand.
- Comprehensive analysis: Get a clear view of how different items are perceived.
Configuration
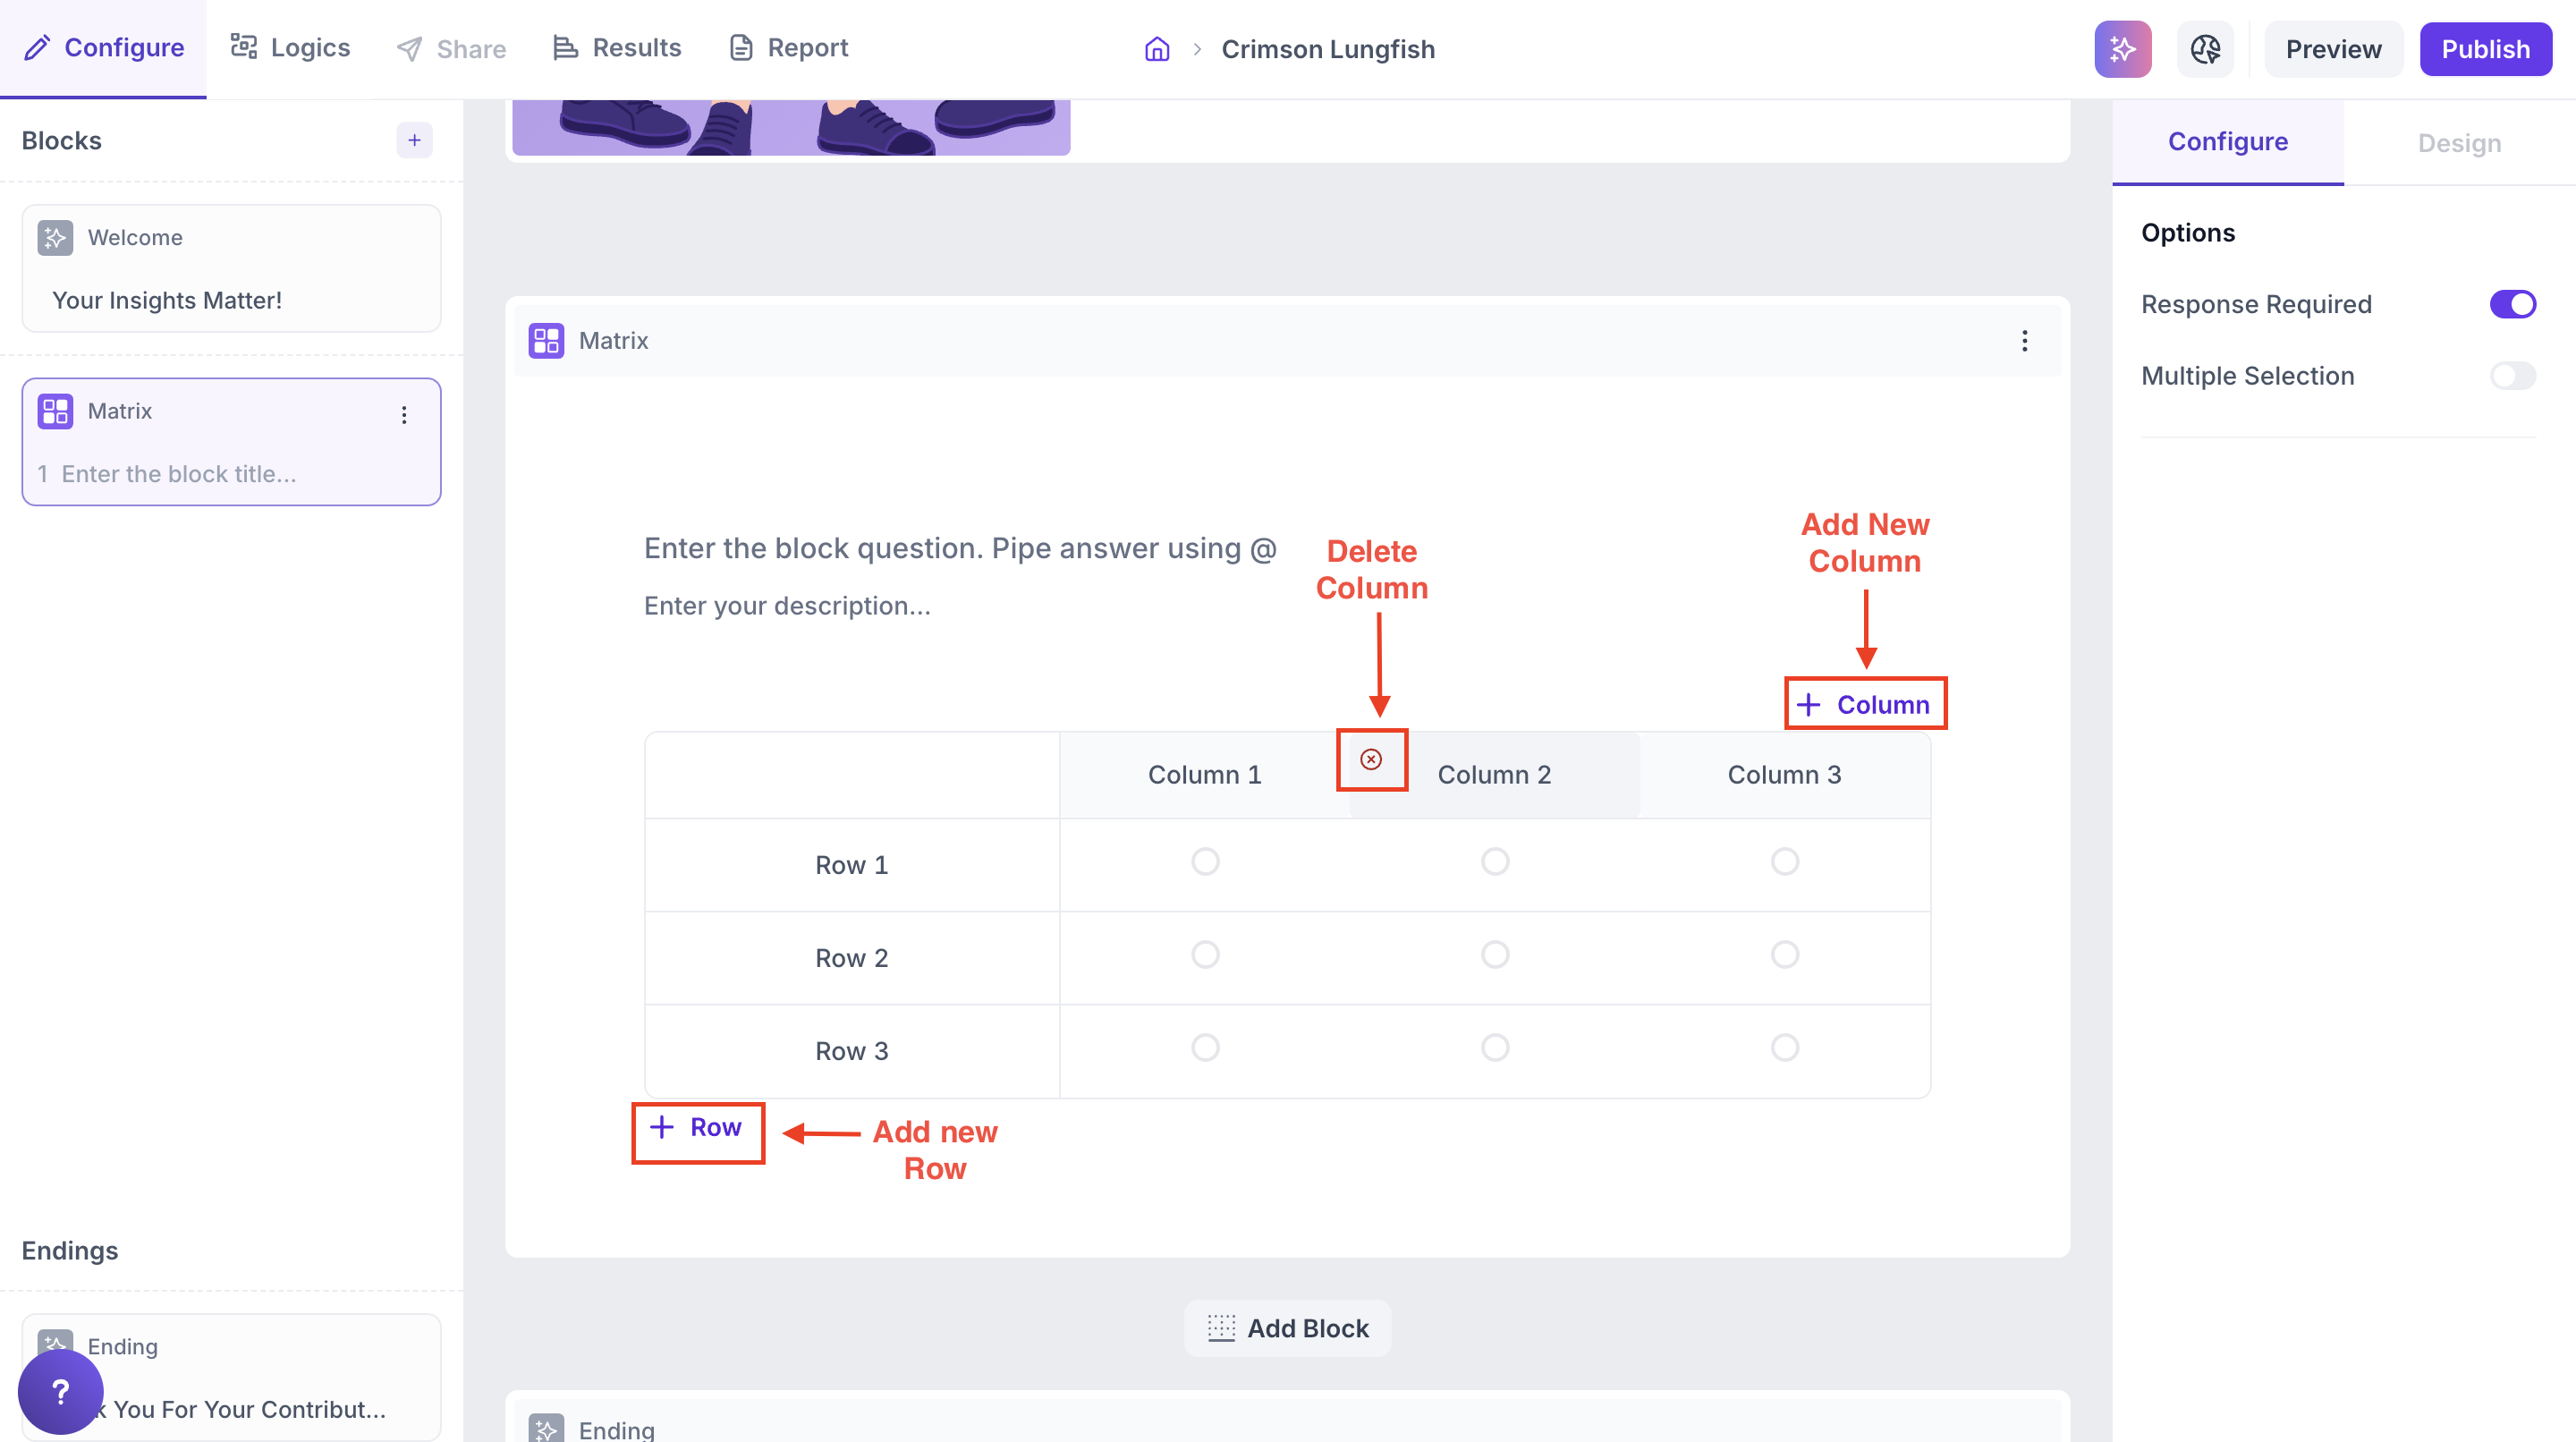
Matrix Questions support up to 9 rows and 9 columns. You can easily customize the layout based on your study needs:
- To add a new column, click the ‘+ Column’ button on the top right of the matrix.
- To add a new row, click the ‘+ Row’ button at the bottom of the matrix.
- To remove a row or column, hover over it and click the ‘×’ (cross mark) icon that appears.
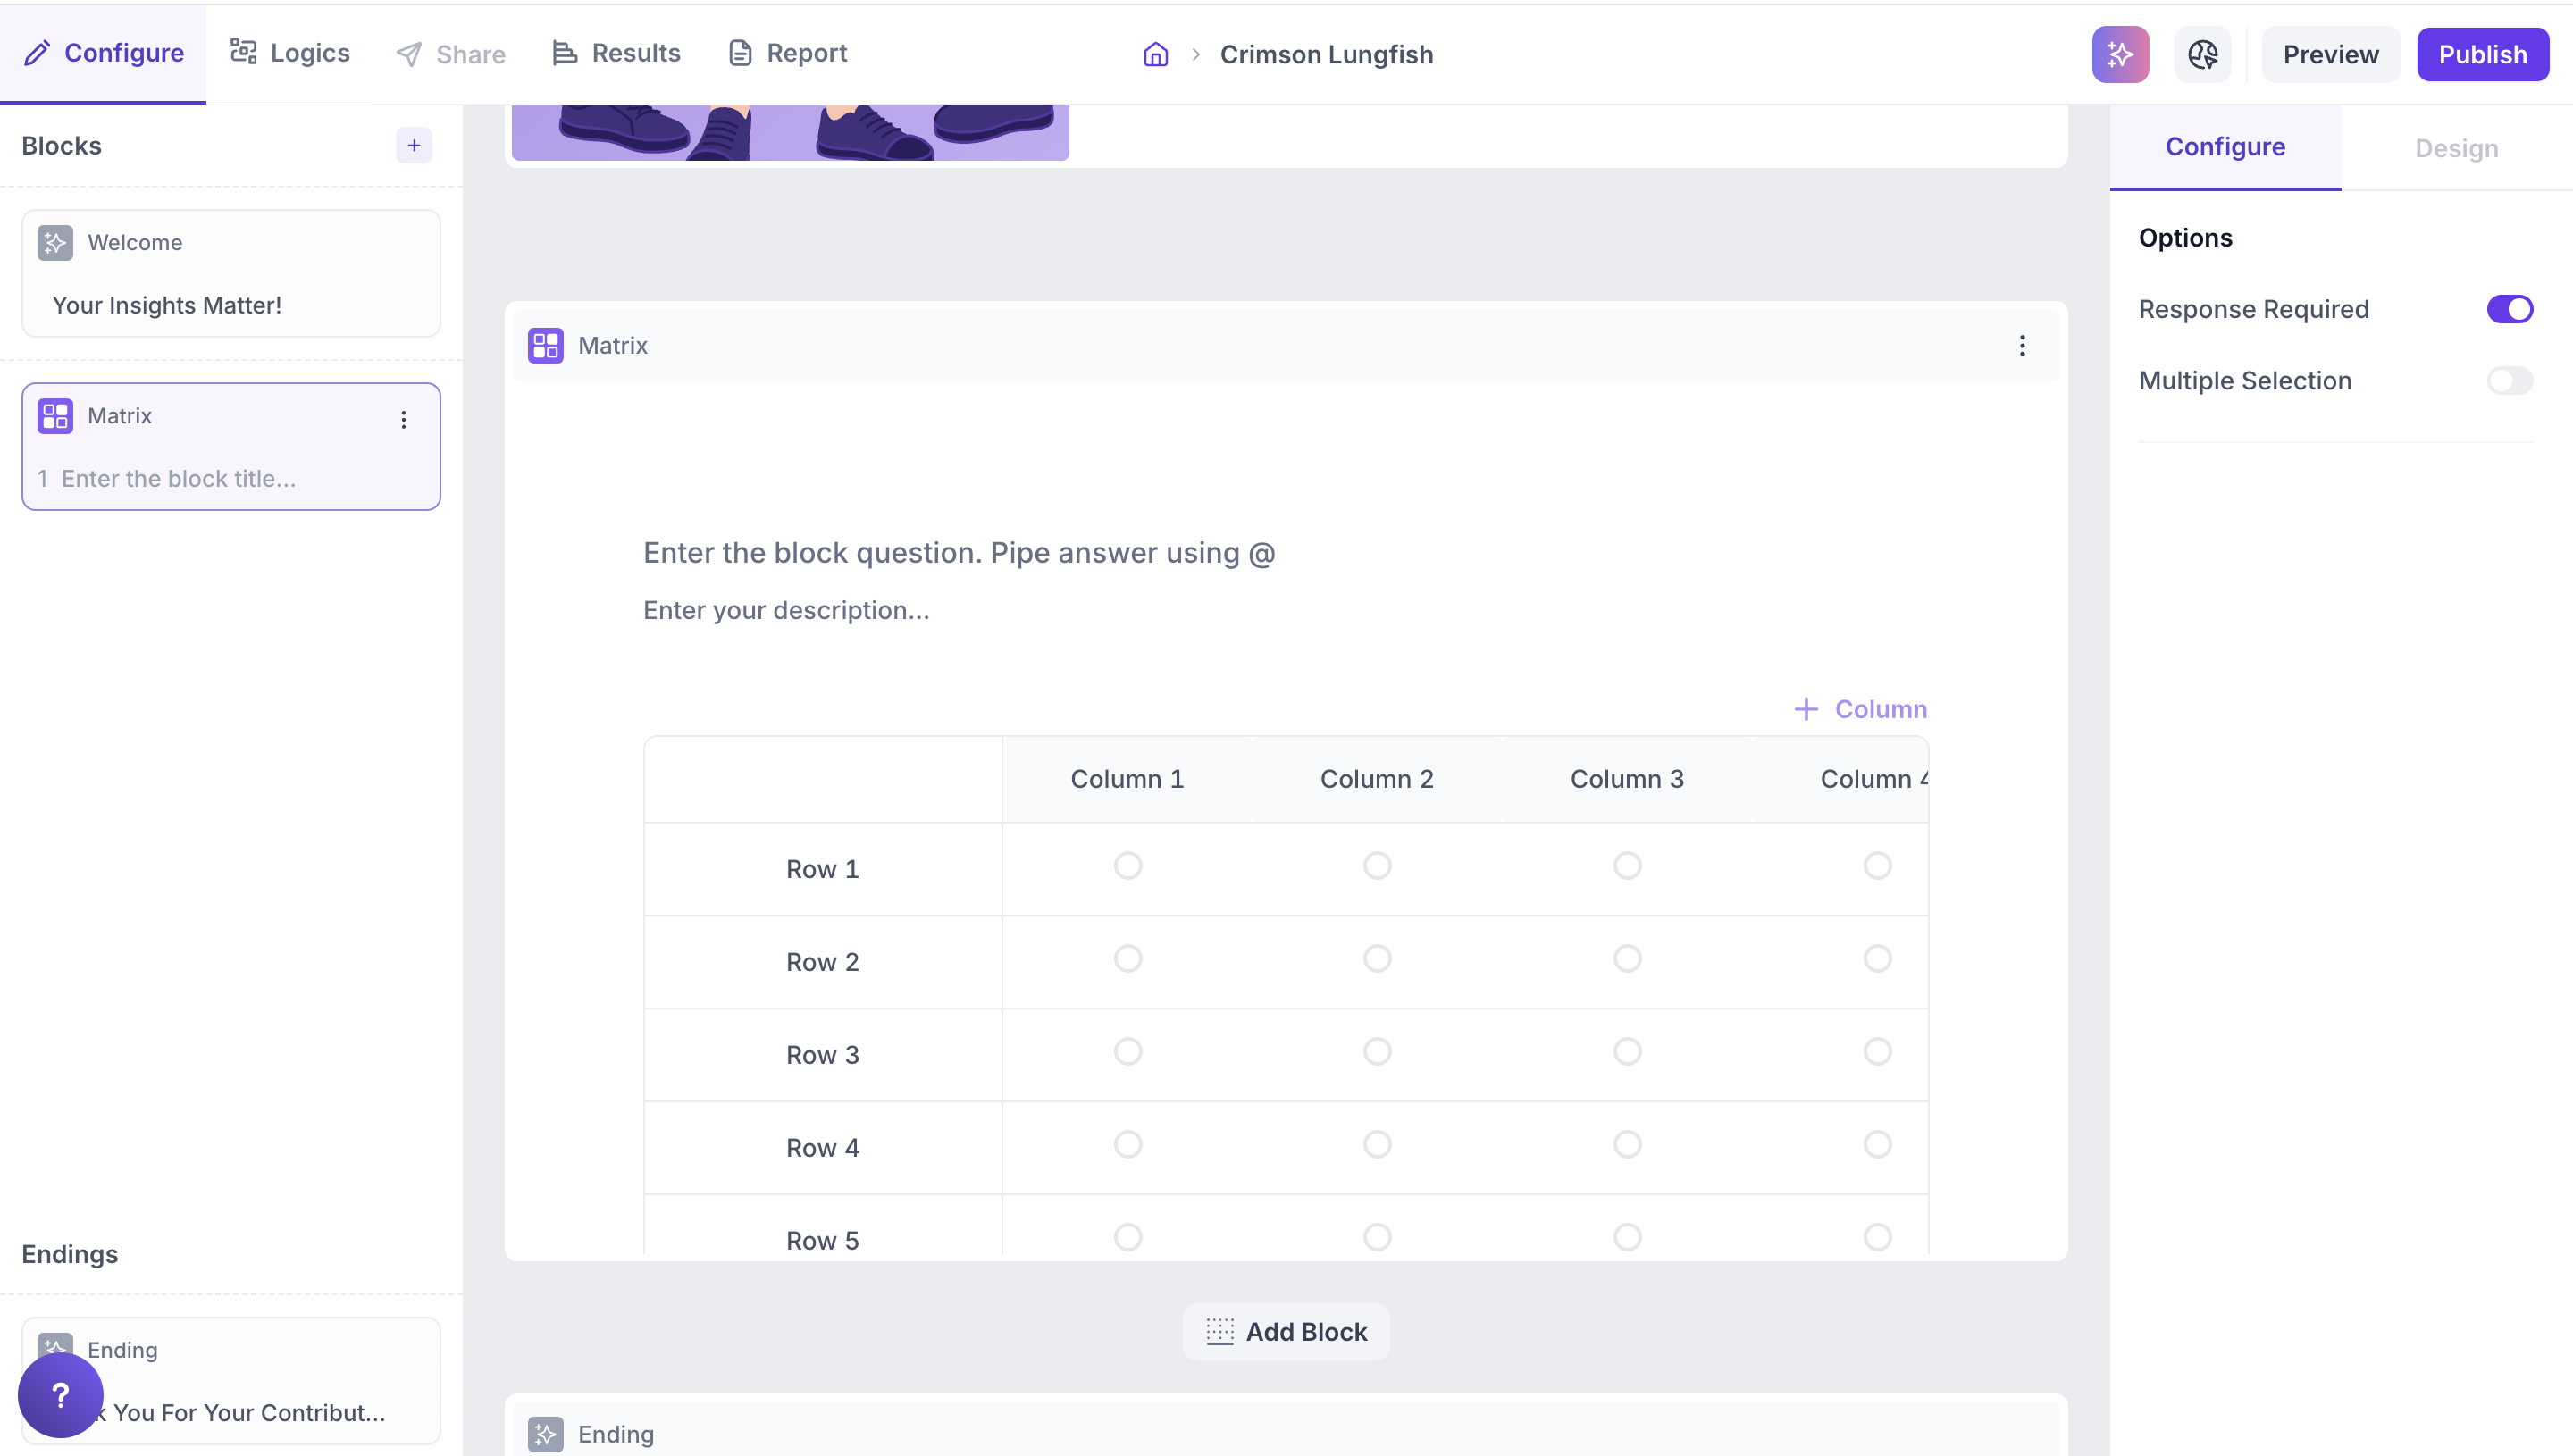
Properties
Response Required (Enabled by default): This setting ensures respondents must select an option before proceeding to the next question. You can disable it if you want to make the question optional.
Results
Matrix questions allow you to collect structured feedback by asking respondents to rate multiple items across a consistent scale — such as 1 to 5, Agree to Disagree, or other defined scales (up to 9 columns and 9 rows supported).
This format makes it easy to compare how different aspects of your product or service are perceived.
Overall Results
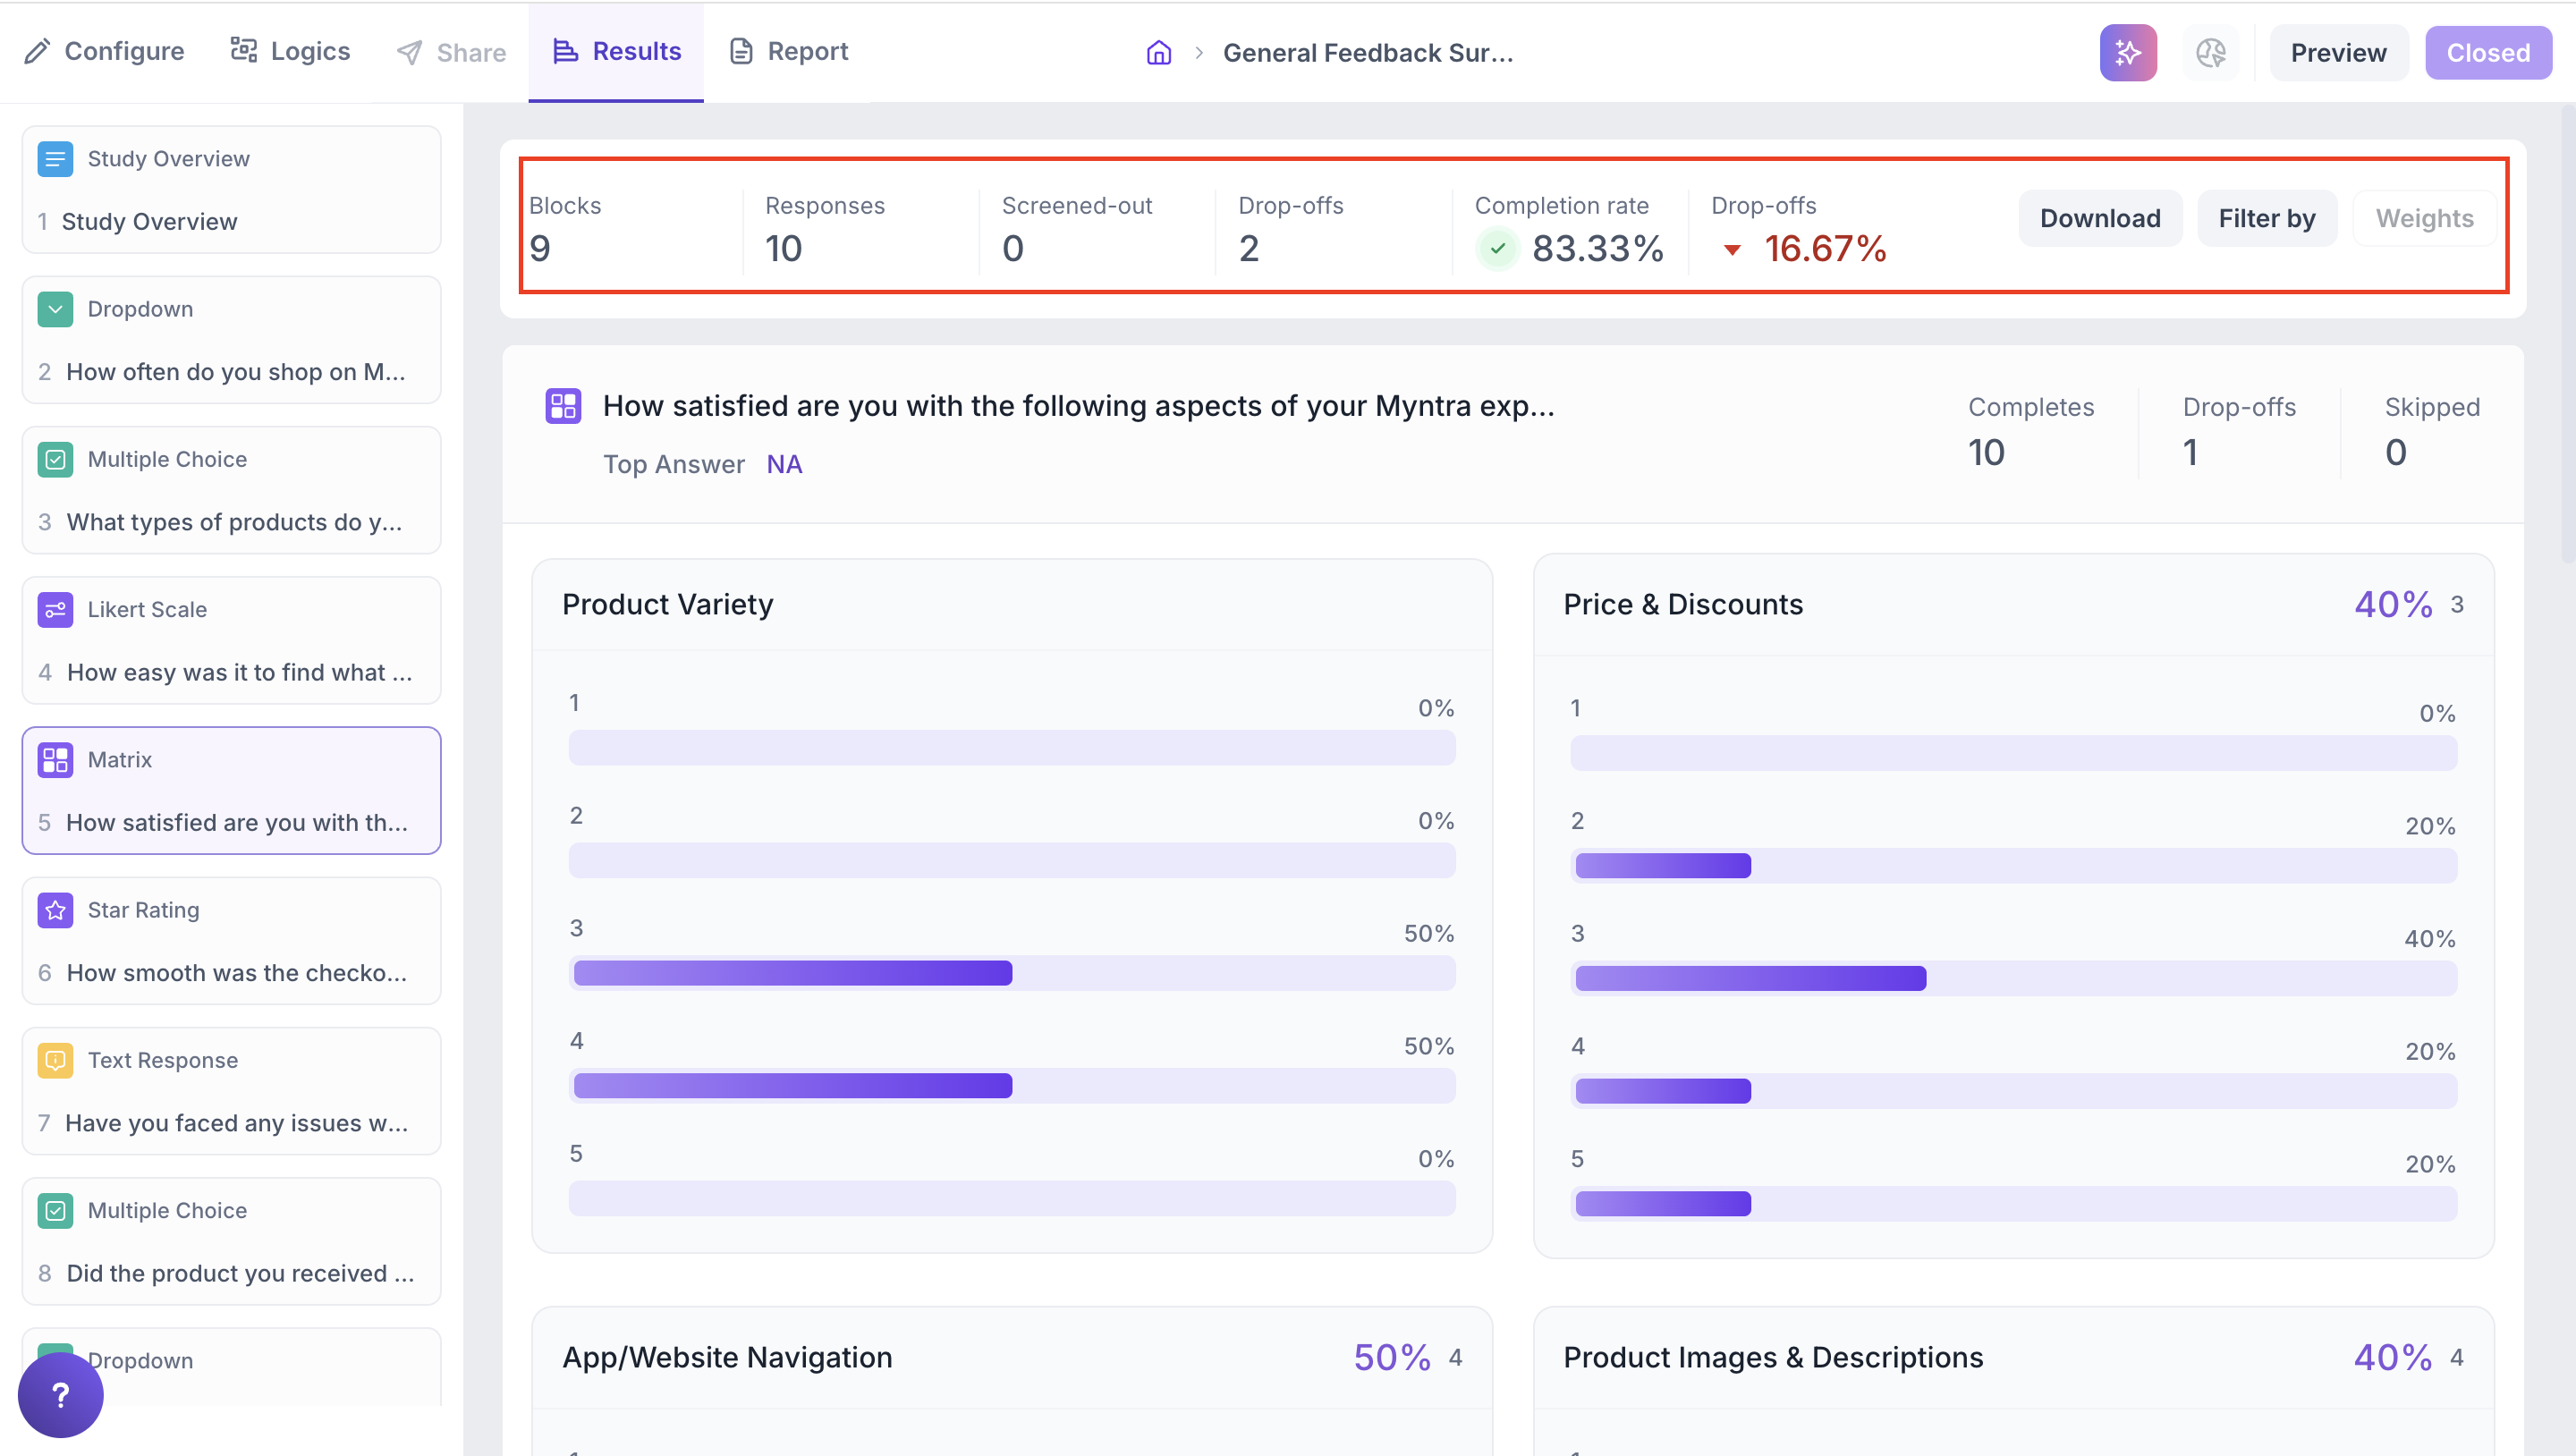
1. Top Summary
This section gives you a quick snapshot of how your study performed:
- Total Blocks – Number of question blocks included in the study
- Total Responses – Count of completed responses across all blocks
- Screened Out – Respondents who didn’t qualify based on screener logic
- Dropped Off – Respondents who exited the study midway
- Completion Rate – % of respondents who completed the full study
- Drop-Off Rate – % of respondents who exited before completion
2. Study-Level Download
- Download all collected response data at the study level, covering every block and question.
3. Filter Responses
Use the filter panel at the top of the results view to analyze specific respondent segments.
You can filter based on:
- Answers from previous questions
- Device type (e.g., mobile, desktop)
- Browser used (e.g., Chrome, Safari)
This helps uncover trends and insights within specific user groups.
Matrix Block Results
1. Response Summary
- Completed – Number of respondents who answered the question.
- Drop-off – Respondents who exited the study before reaching this block.
- Skipped – Number of respondents who viewed but didn’t respond.
2. Each Matrix block result includes two views:
- Visual Graph View
- Matrix Table View (Tabular)
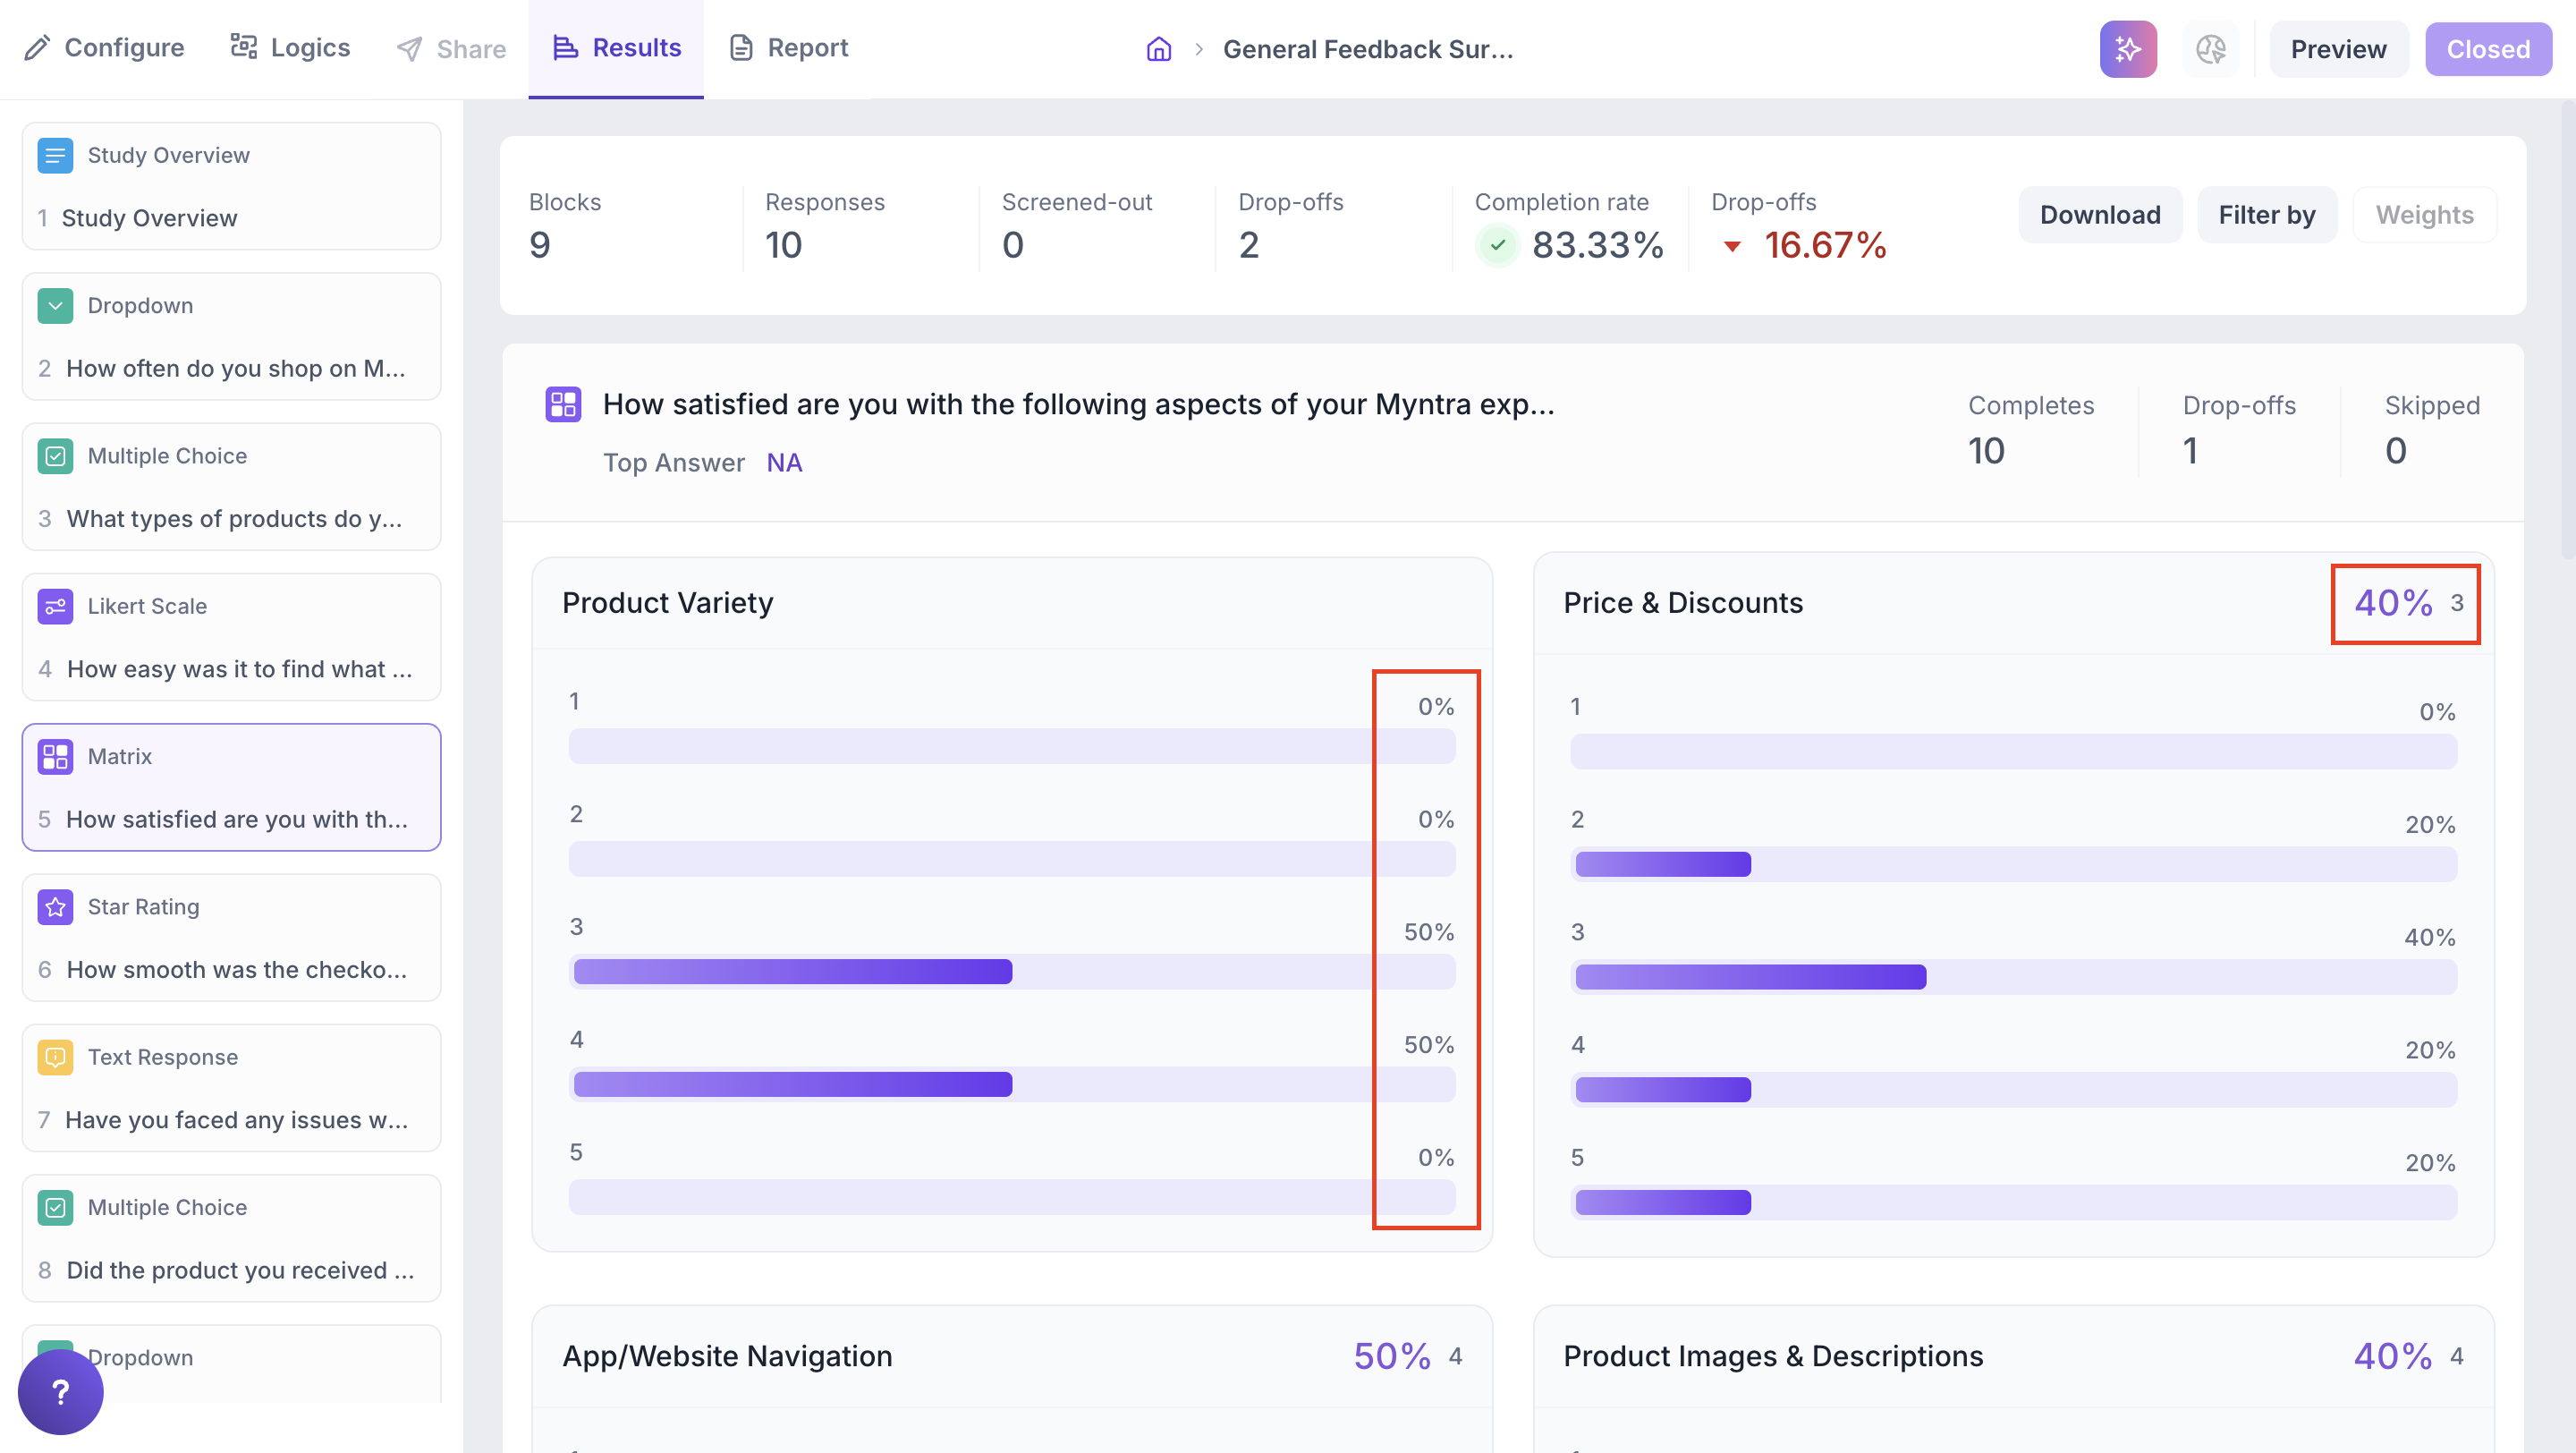
3. Graph View
- Each row represents a single statement or item (e.g., Product Variety, App Navigation).
- Each column represents a response scale point (e.g., 1 to 5). The scale can go up to 9 levels.
- Inside each cell, a horizontal bar indicates the percentage of respondents who selected that rating for that item.
- Color intensity represents how popular the rating was the more filled the bar, the higher the percentage.
Highlight:
- At the top of each card, the most selected rating and its percentage are displayed.
- Example: In the below image, For Price & Discounts 40% of respondents chose rating 3
This quickly tells you which score was most frequently chosen for each row item.
4. Matrix Table View
Below the graph, a detailed table shows the detailed responses as follows:
1. Each row is an item/question.
2. Each column is a scale point (e.g., 1, 2, 3…).
3. Each cell shows:
- Number of responses for that point
- Percentage of total responses
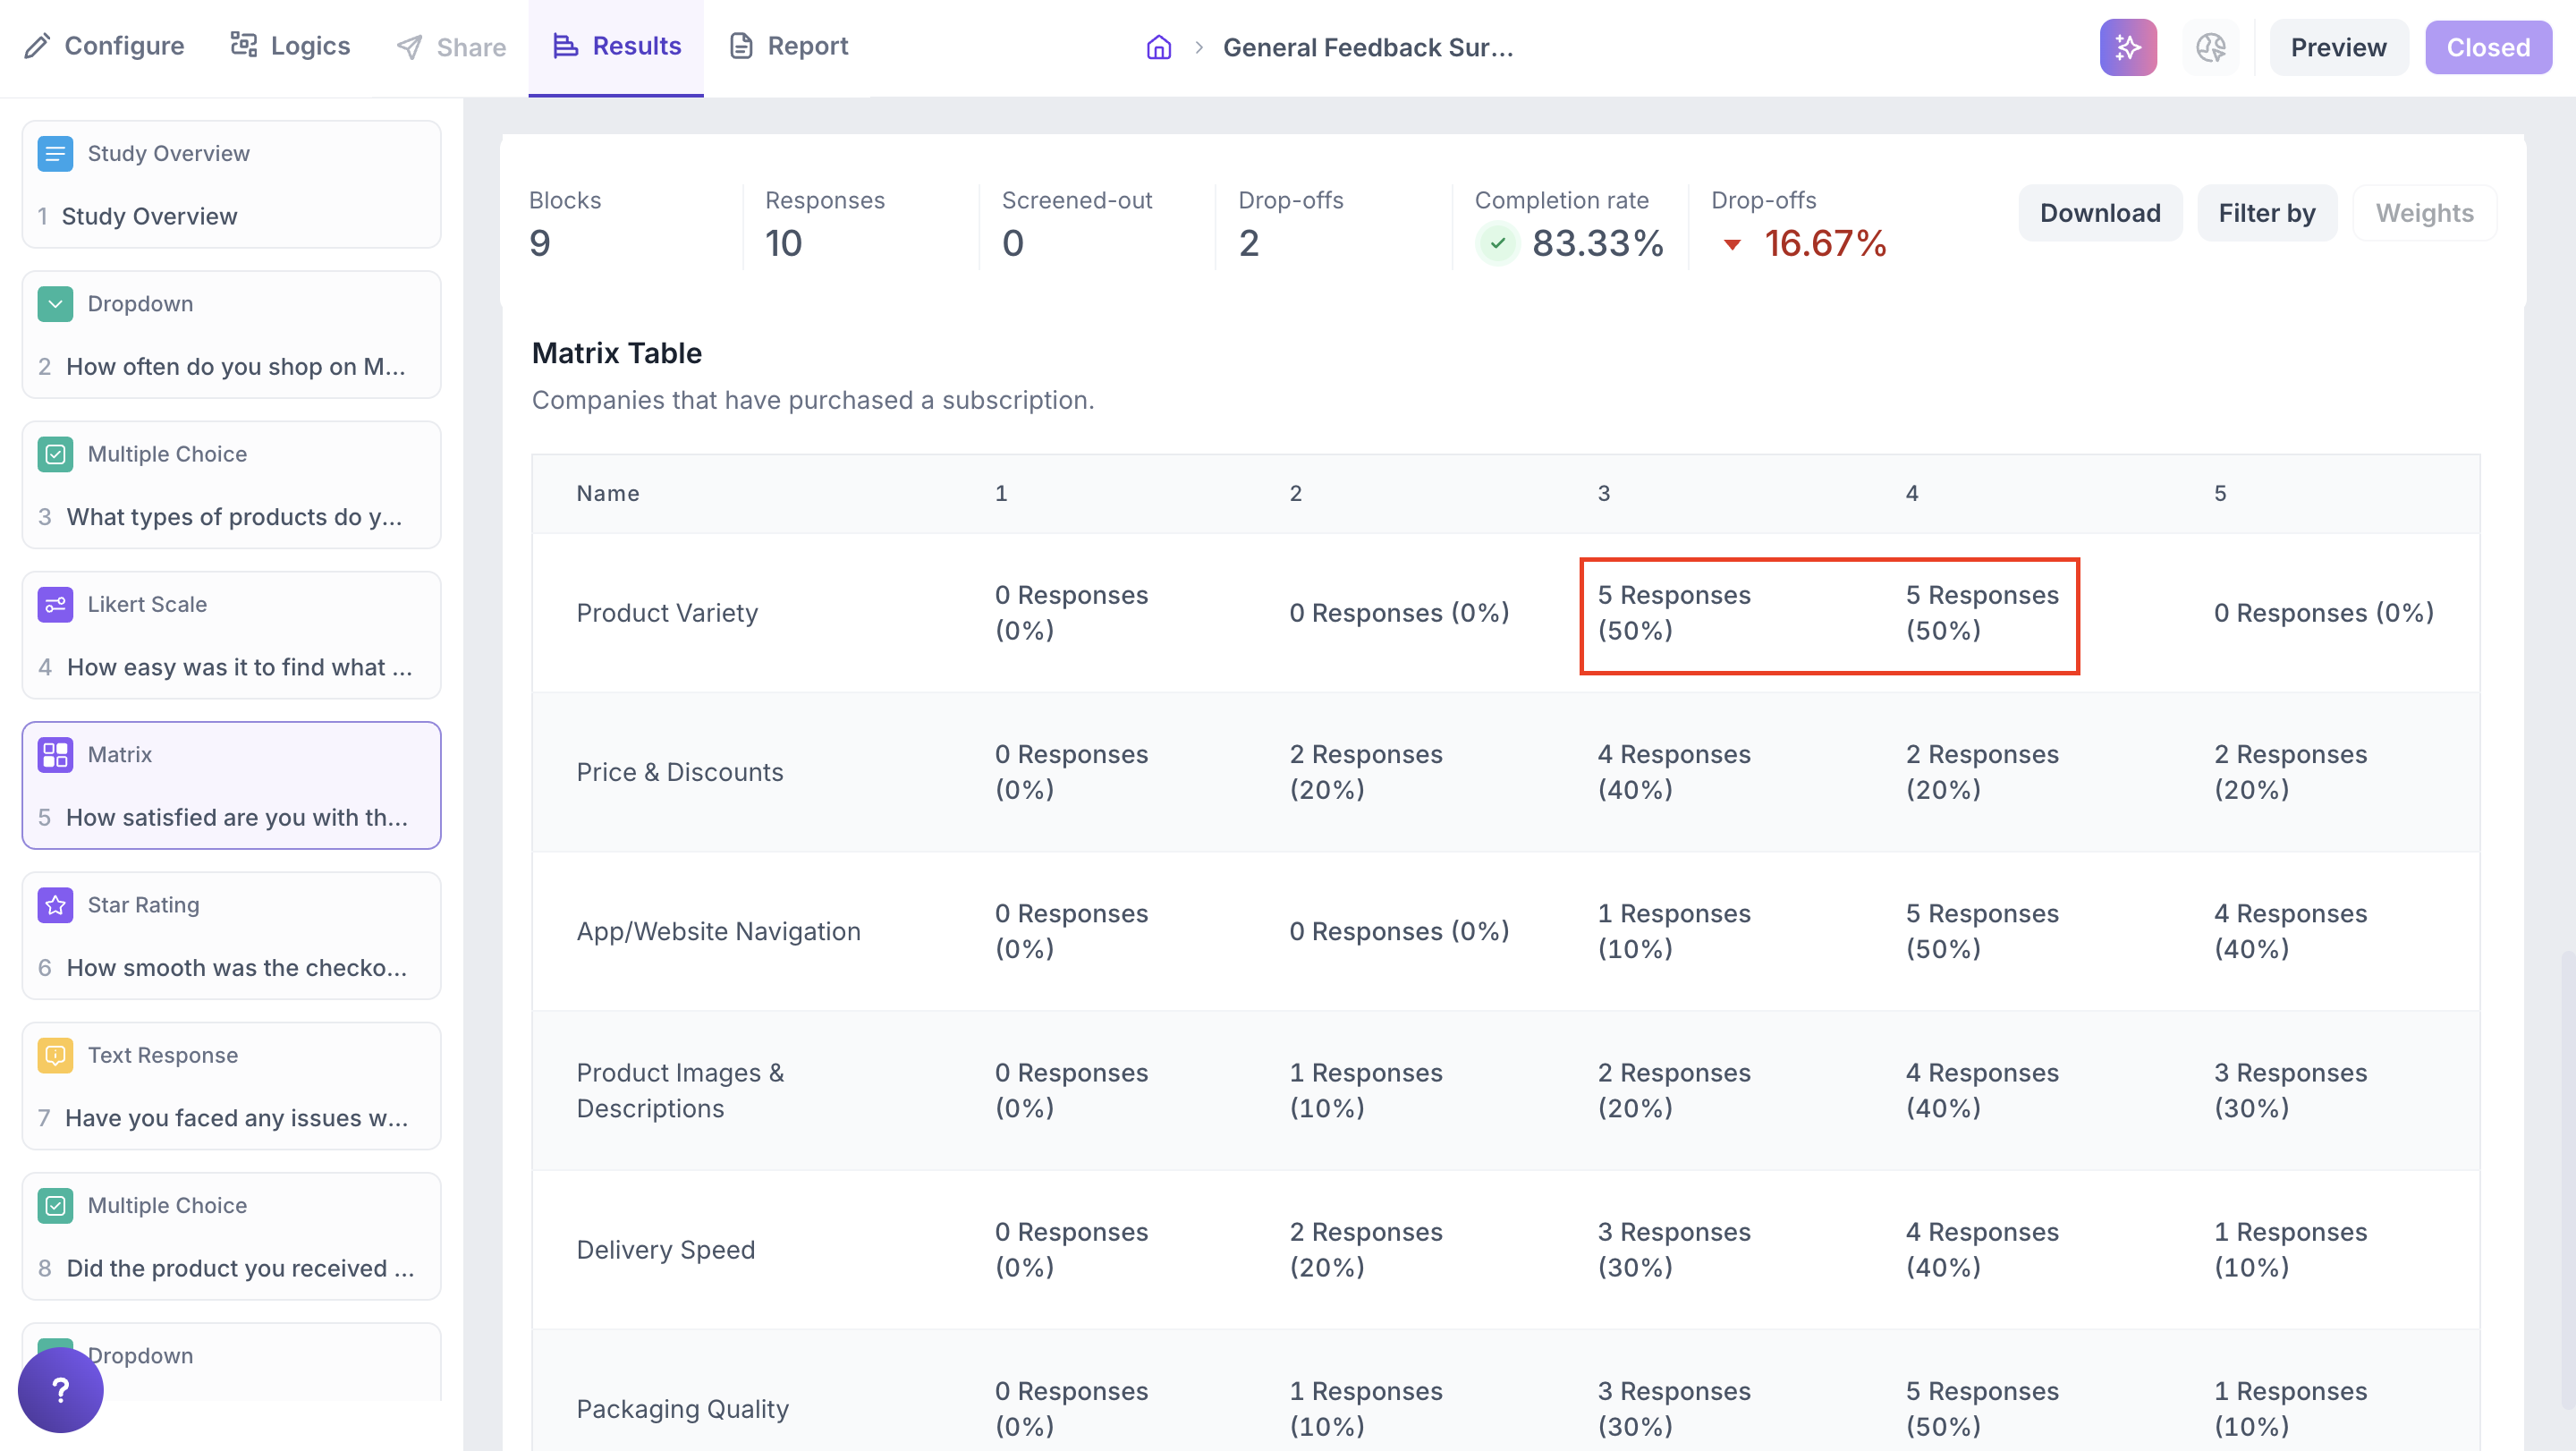
This tabular view is helpful for precise counts and percentages when you need to analyze data manually or compare across scale points.