Local Media - Media and Image Block
Overview
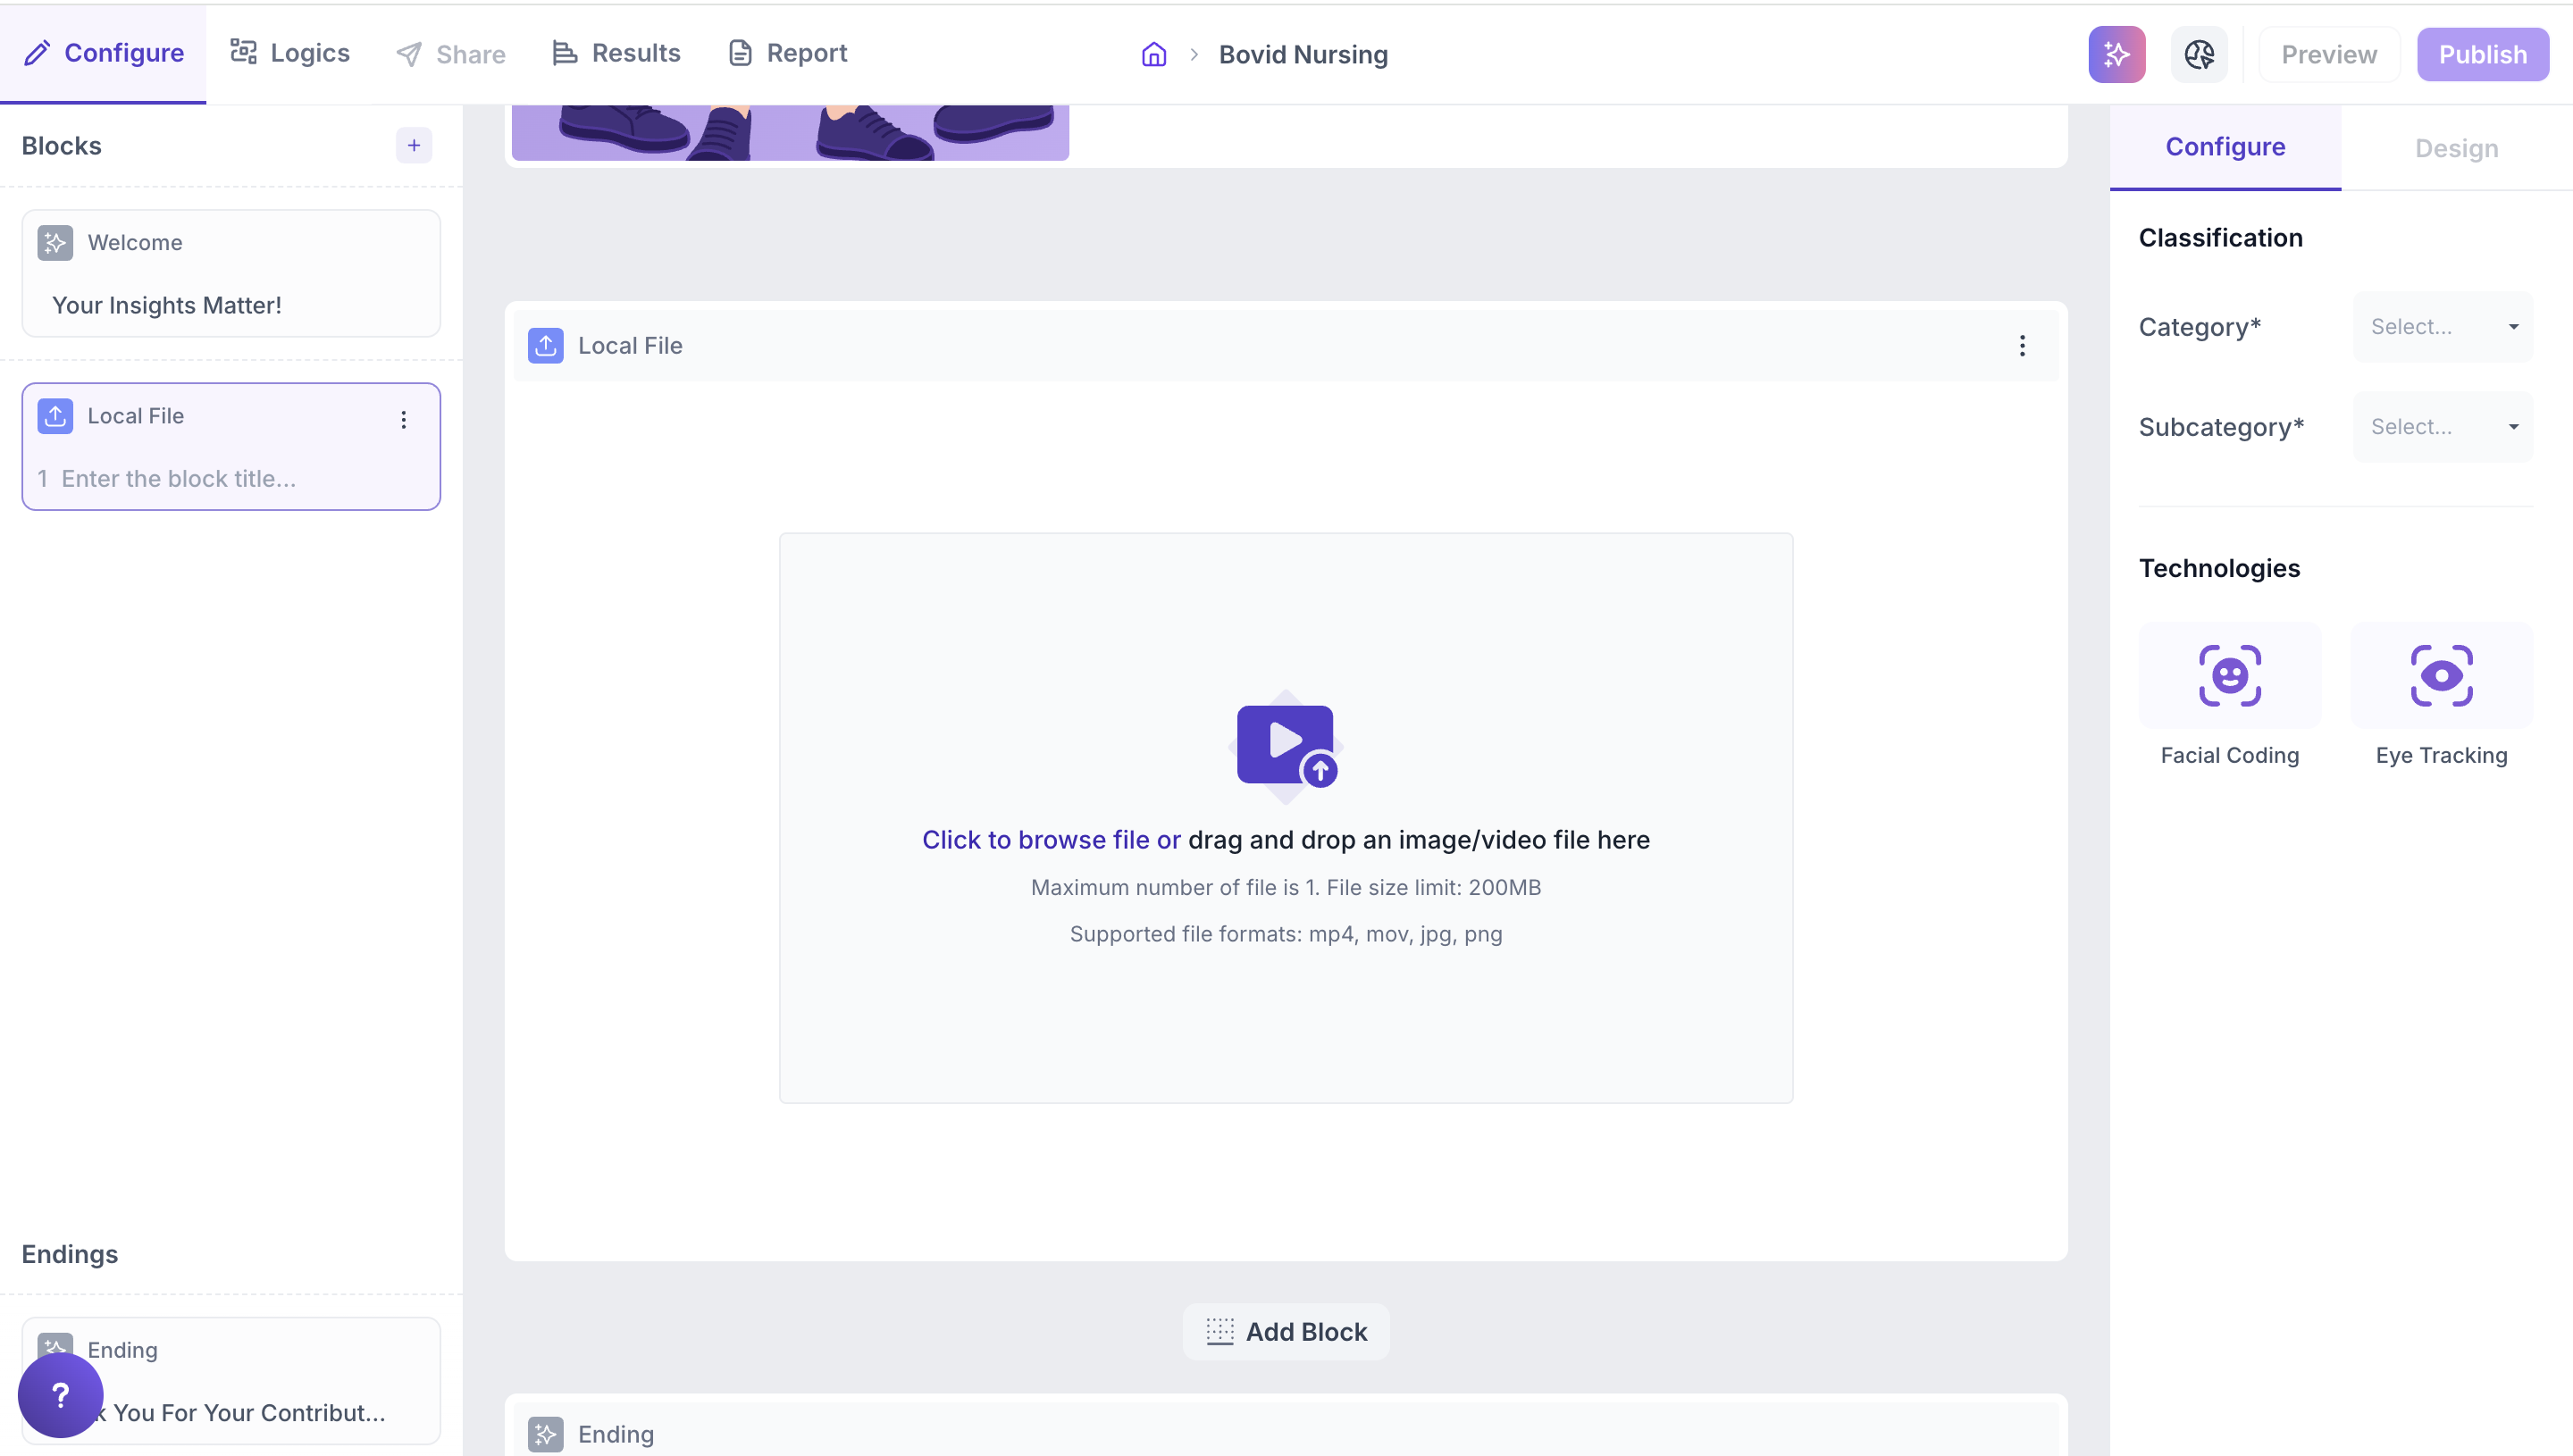
This block is ideal for using locally stored image or video files such as early-stage creative assets, internal test videos, or proprietary visuals. It allows you to present media that isn't hosted online, making it perfect for confidential or unpublished content. Once uploaded, the file is embedded directly into the survey interface, enabling advanced behavior and emotion tracking through Facial Coding and Eye Tracking technologies. This helps uncover deep insights into viewer engagement, emotional response and visual attention.
To add a file
- Click on the 'Click to browse file' text or drag and drop your image/video file into the block area
- Choose the image or video file from your device.
- The file will be embedded and previewed in the block.
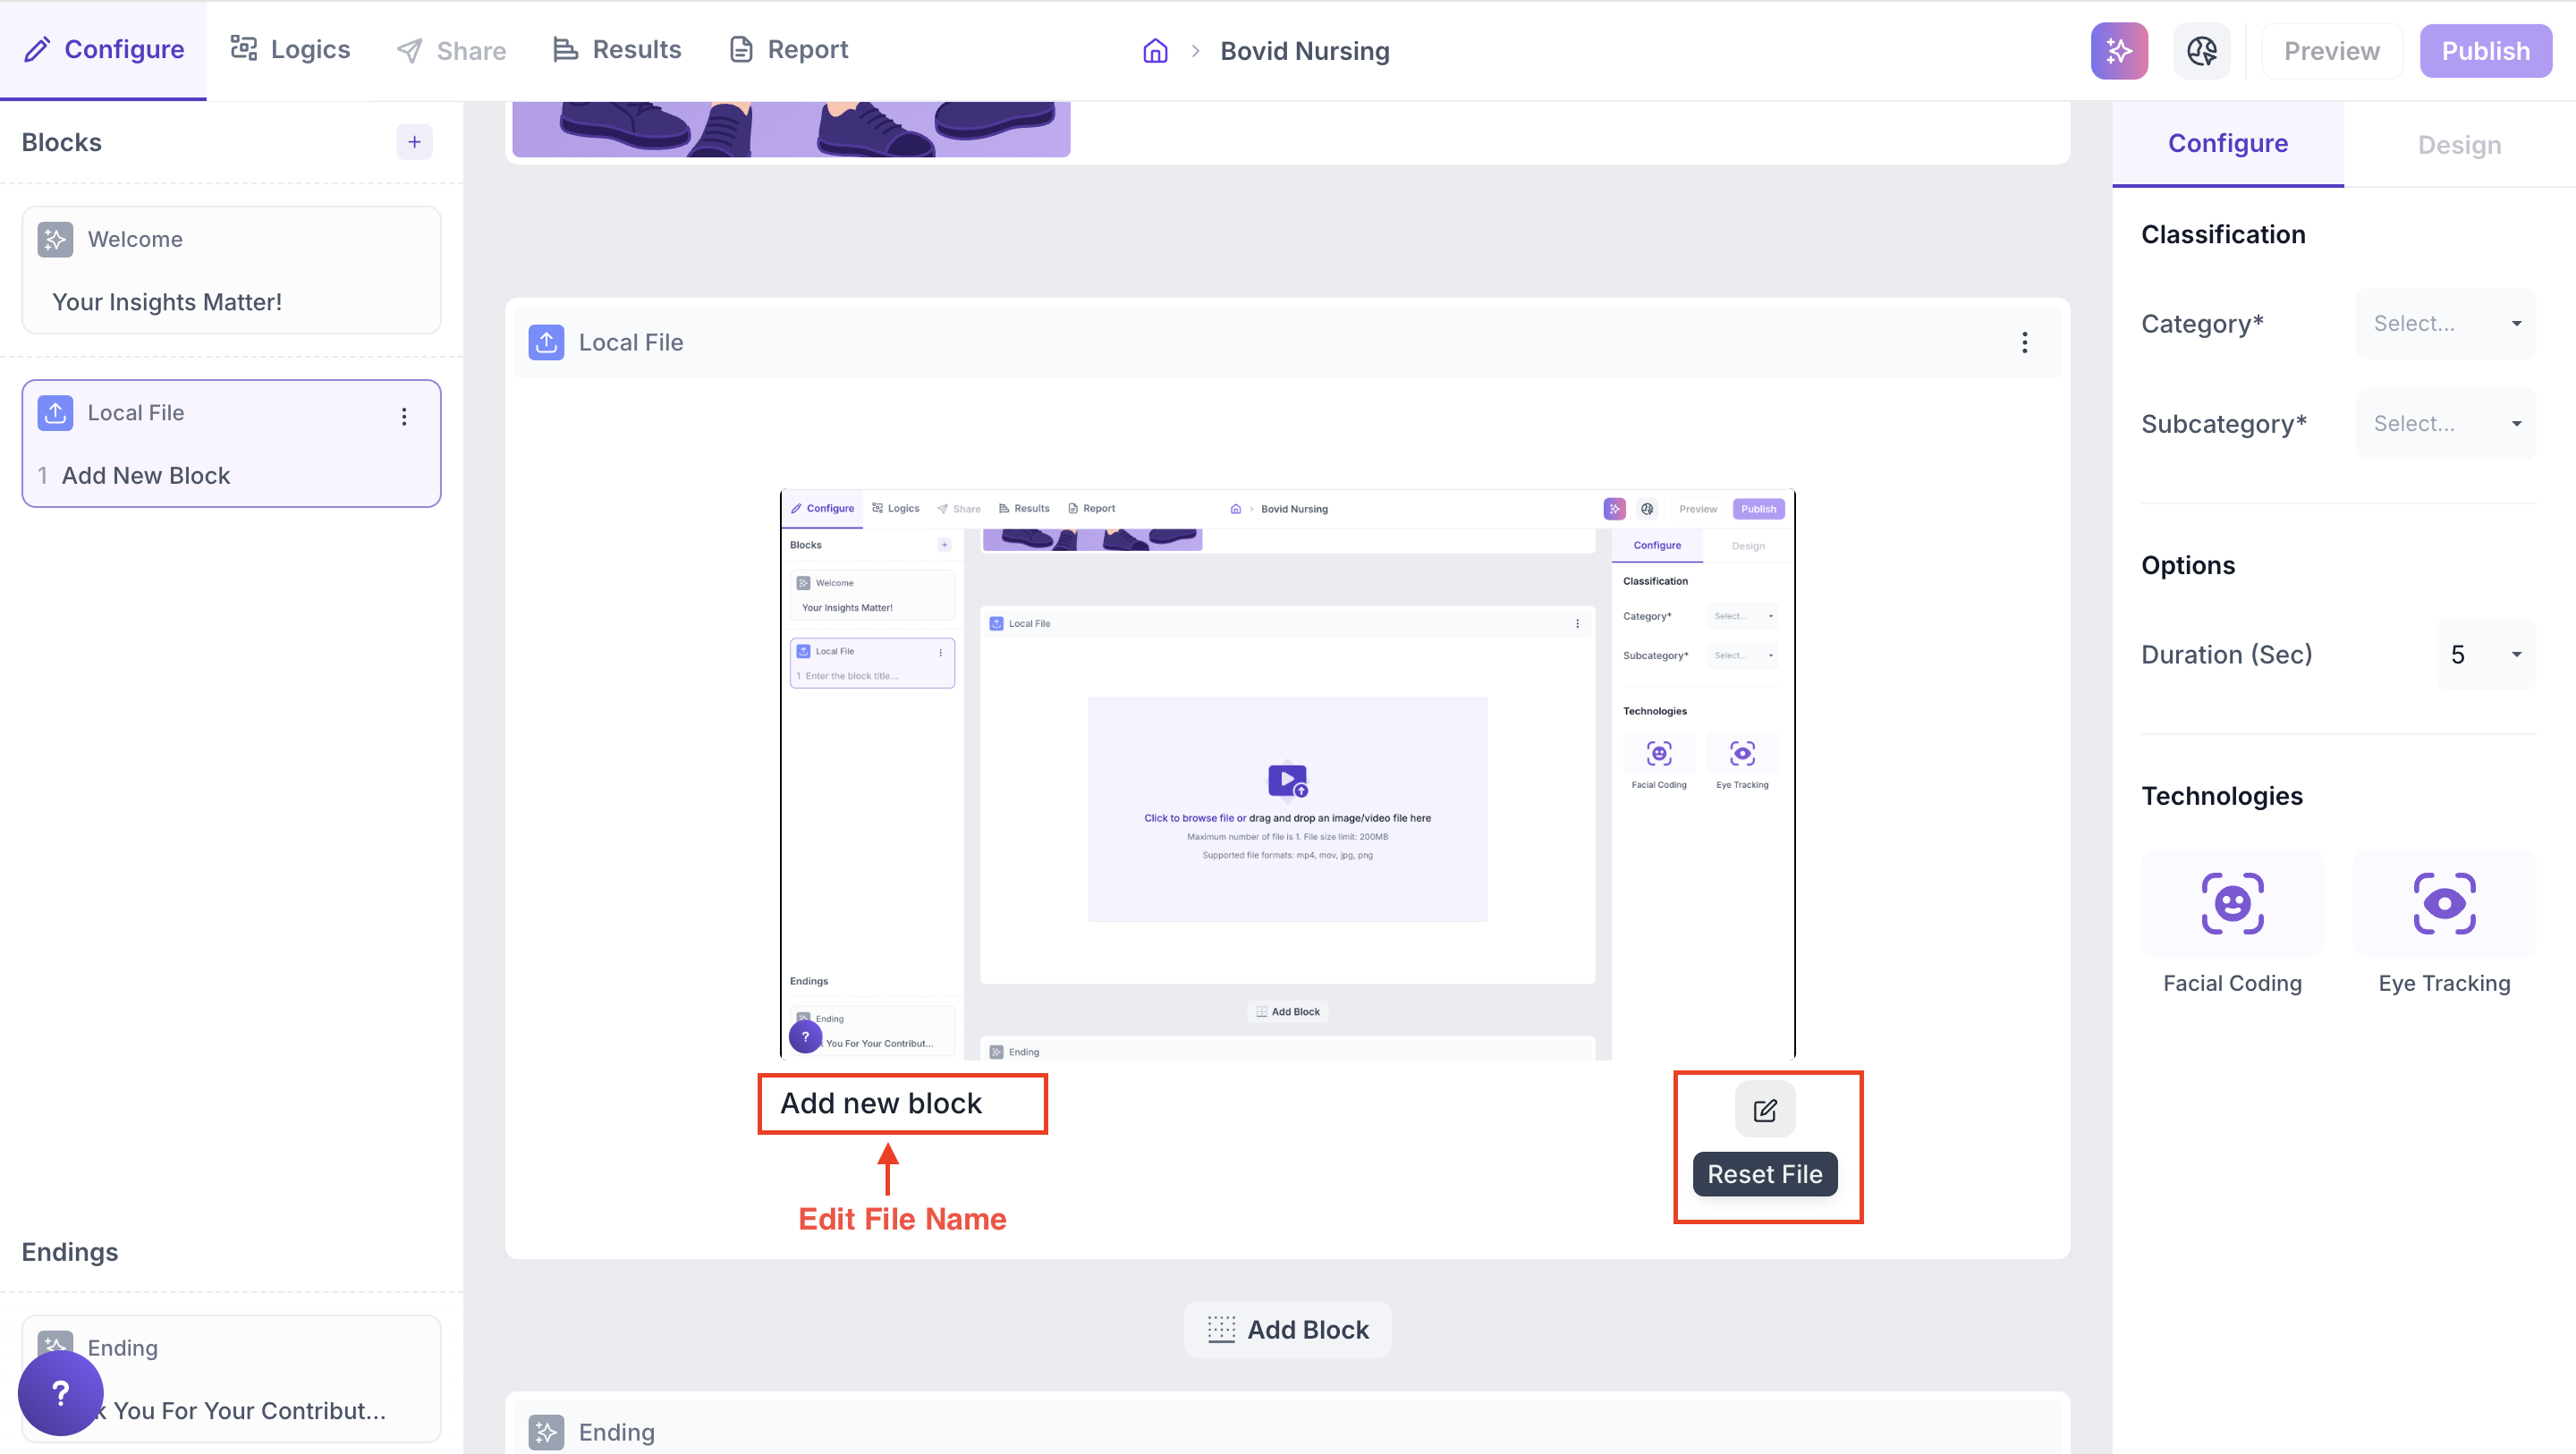
- You can rename the media title for clarity.
- To change the media, click Reset File, then upload a new file.
Note: File Upload Limits
- Maximum number of files: 1
- Maximum file size: 200 MB
- Supported file formats: mp4, mov, jpg and png
Properties
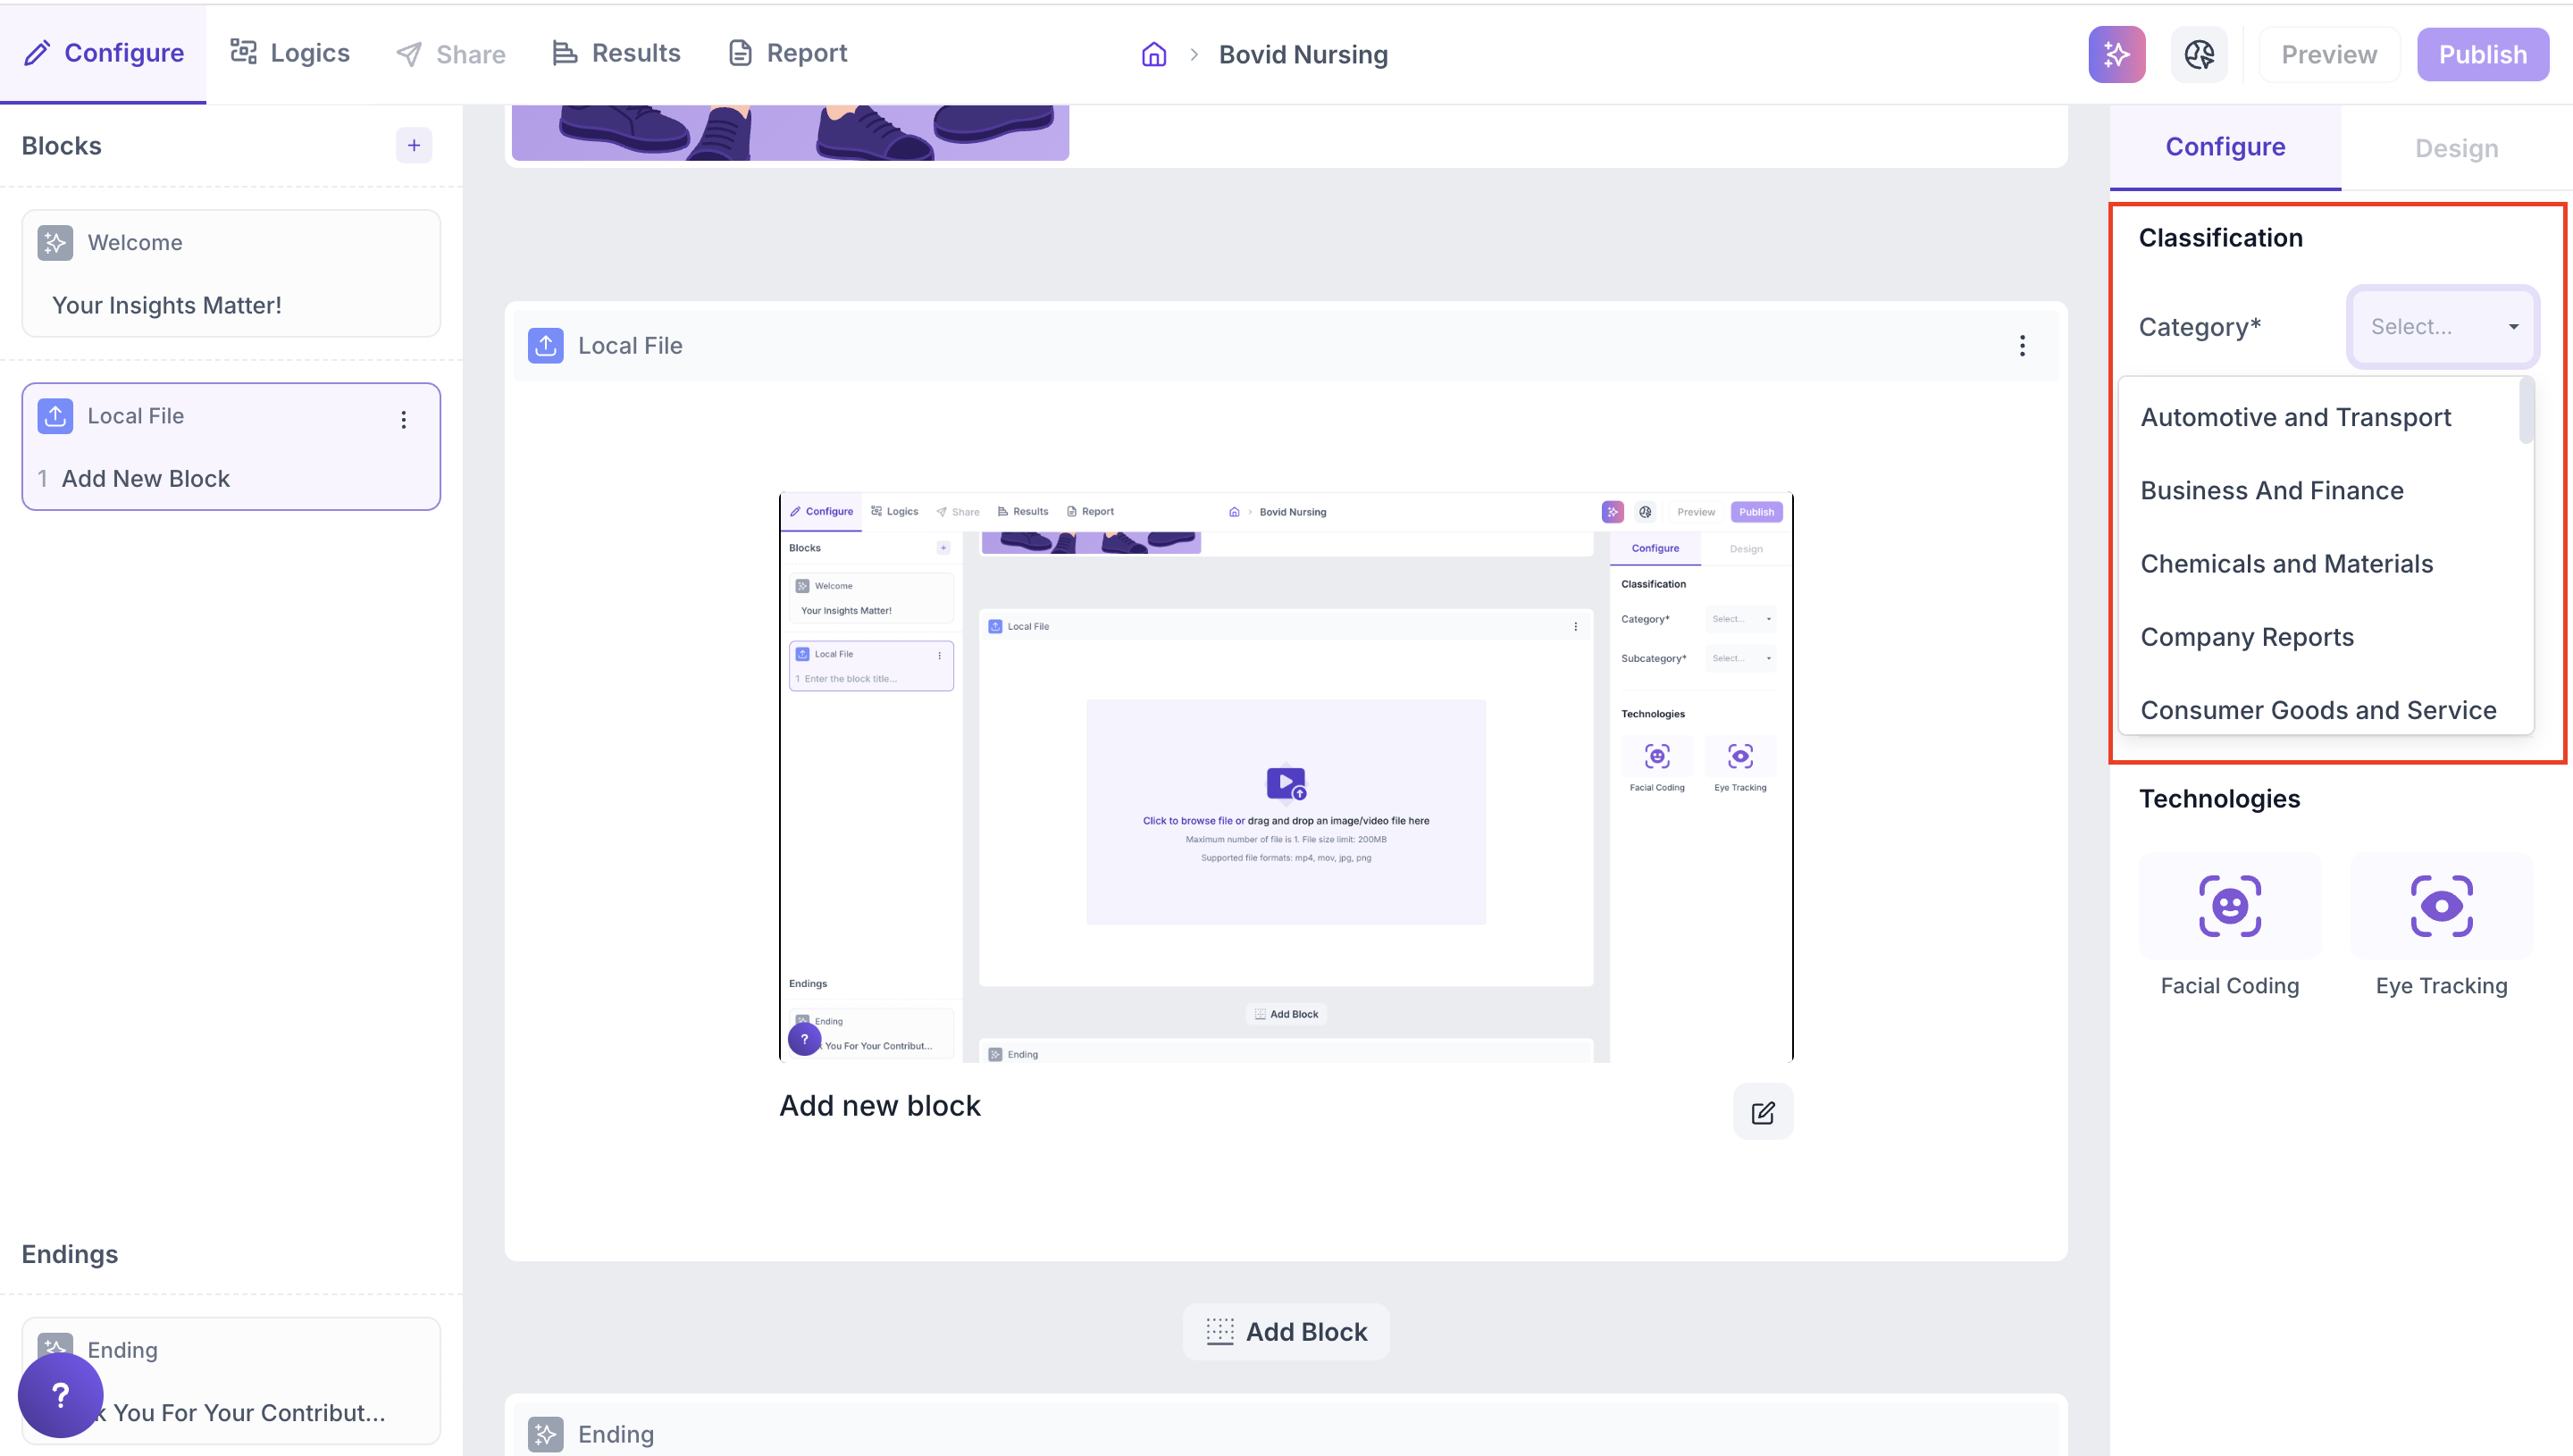
1. Category: Classify the media under a broader group. This helps benchmark your media’s performance against other media in the same category. To select, click the dropdown and choose the relevant category.
2. Subcategory: Further refine your media classification for more granular comparisons. Select the appropriate subcategory from the dropdown.
3. Tracking Technology: Choose how you want to track respondent behavior while they view the video:
- Facial Coding: Tracks facial expressions to identify emotional responses like happiness, surprise, anger, and more. (Requires respondent’s camera to be enabled.)
- Eye Tracking: Monitors eye movement and gaze to understand what parts of the video drew the most attention and how focus shifted over time.
Result
Once respondents have completed viewing your media, the platform automatically analyzes their behavior using Facial Coding and Eye Tracking (if enabled).
Here’s a quick summary of what you’ll find in your media insights:
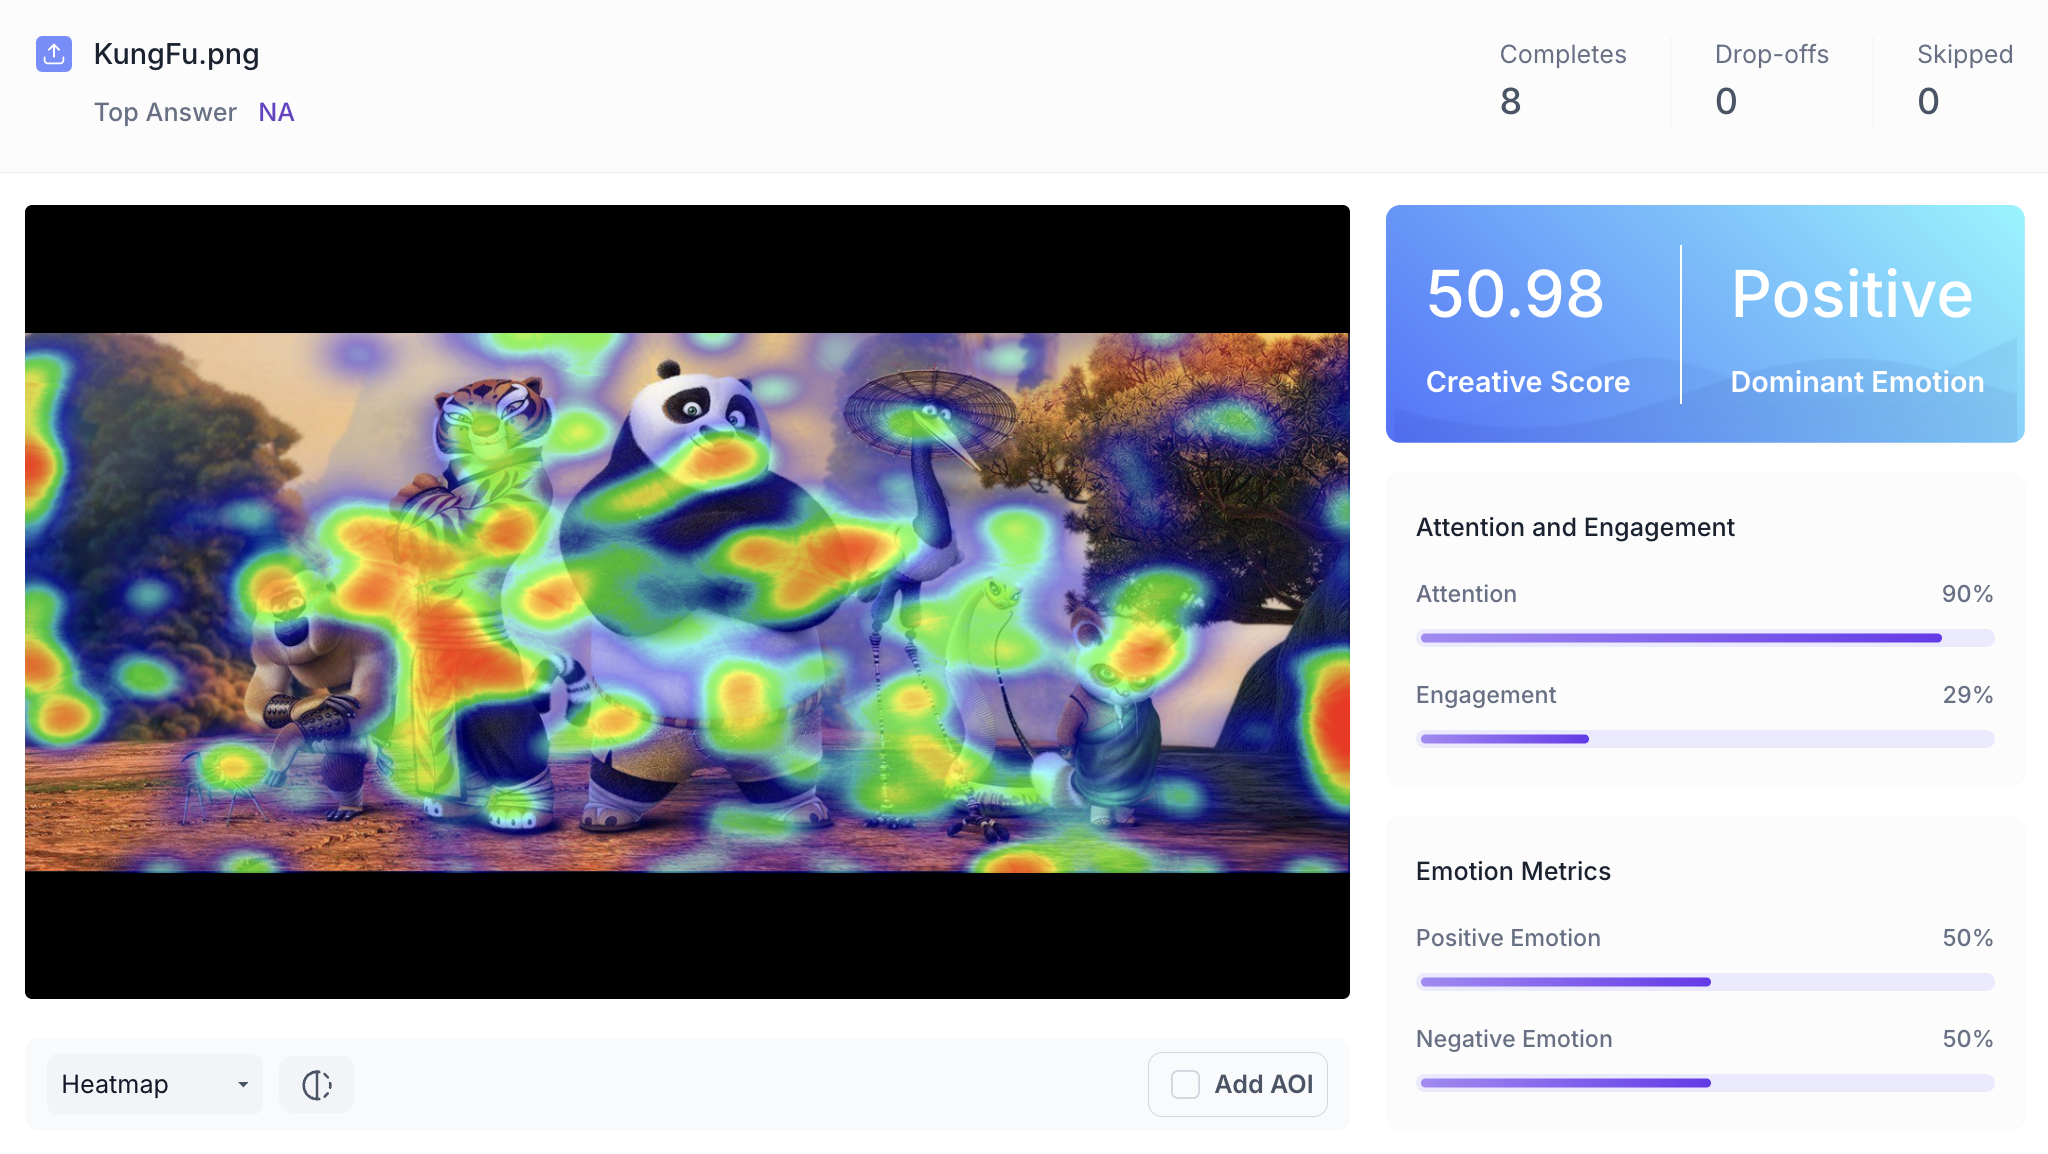
- Creative Score: Overall performance of your media
- Dominant Emotion: The emotion most commonly shown across respondents
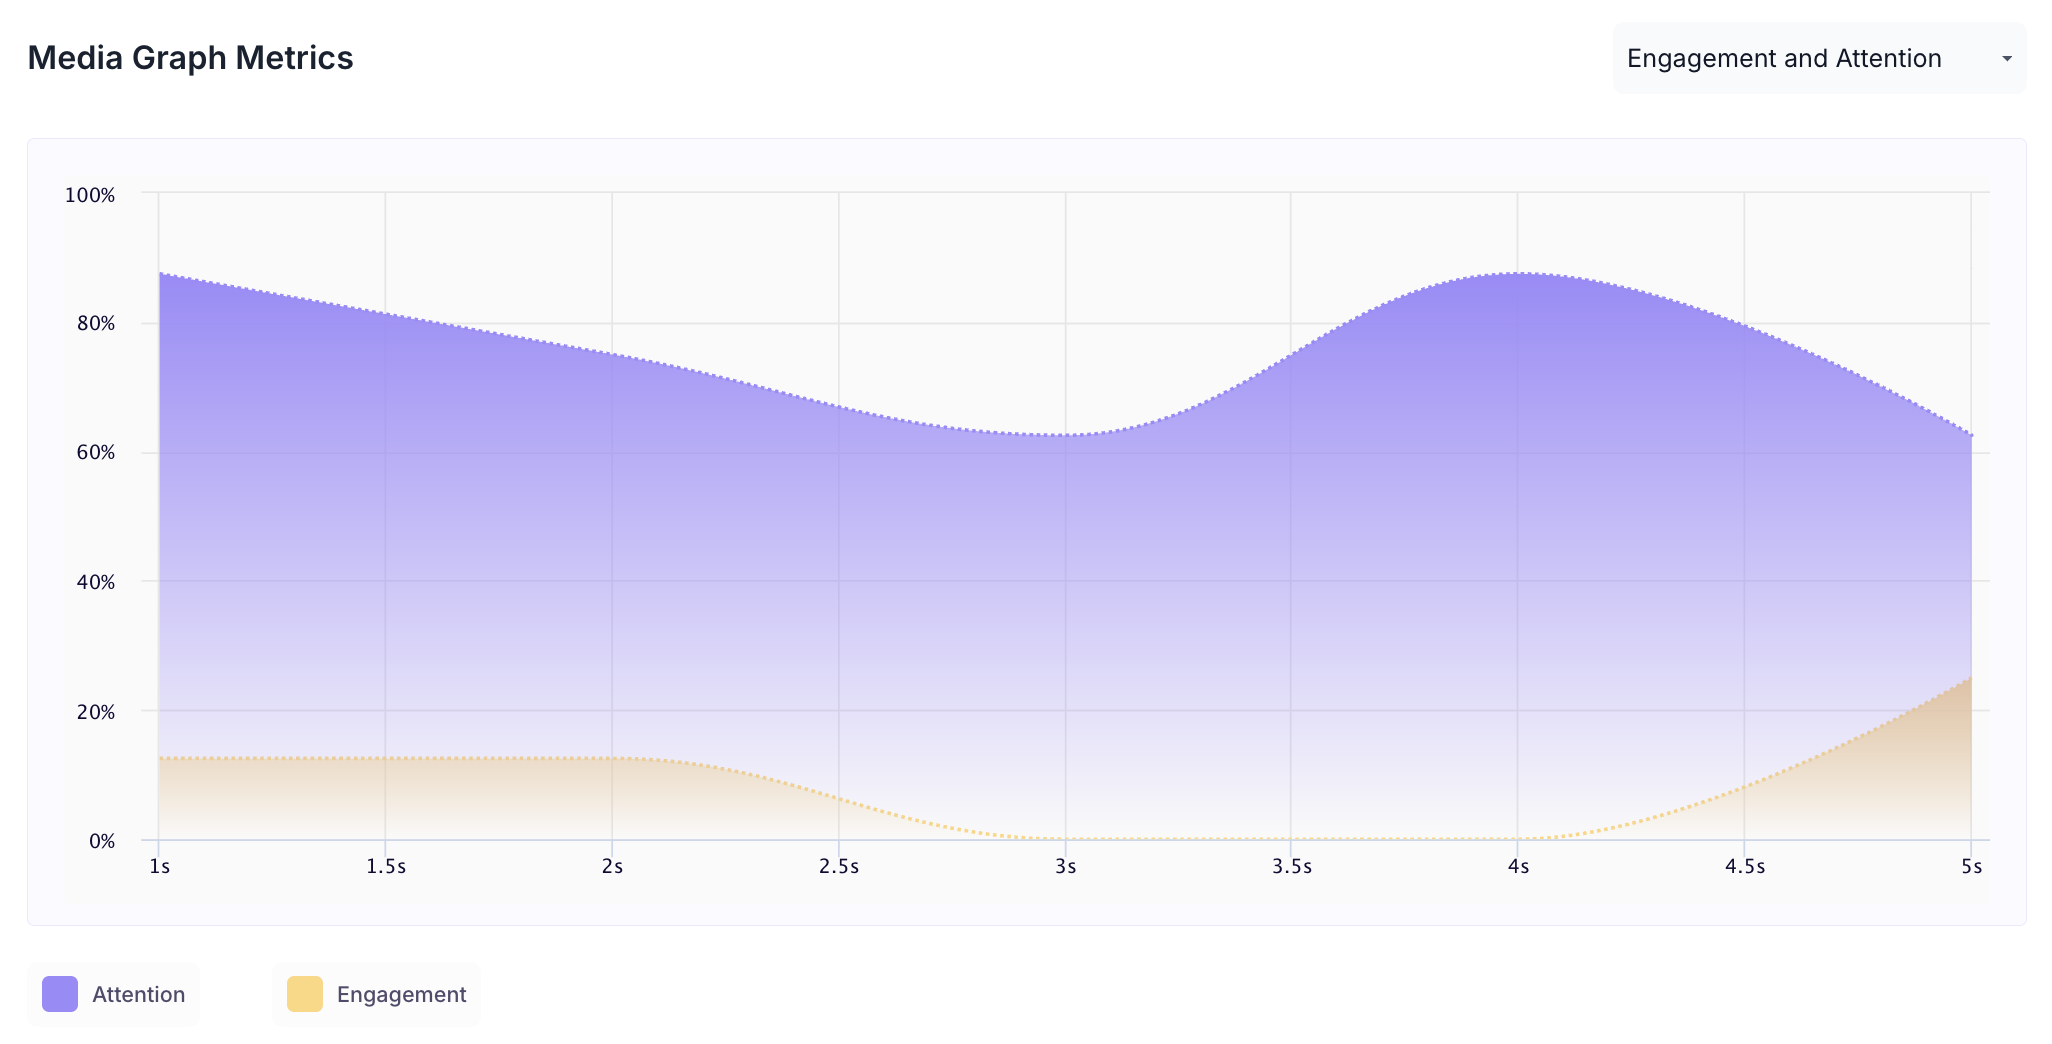
- Attention & Engagement: Measures visual focus and emotional intensity
- Emotion Analysis: Highlights positive (Happiness, Surprise) and negative (Anger, Disgust, Contempt) responses
- Second-by-Second Analysis: Interactive graphs showing how respondents reacted throughout the video or image
- Heatmap & Transparency Map: Visuals that show what areas were viewed the most
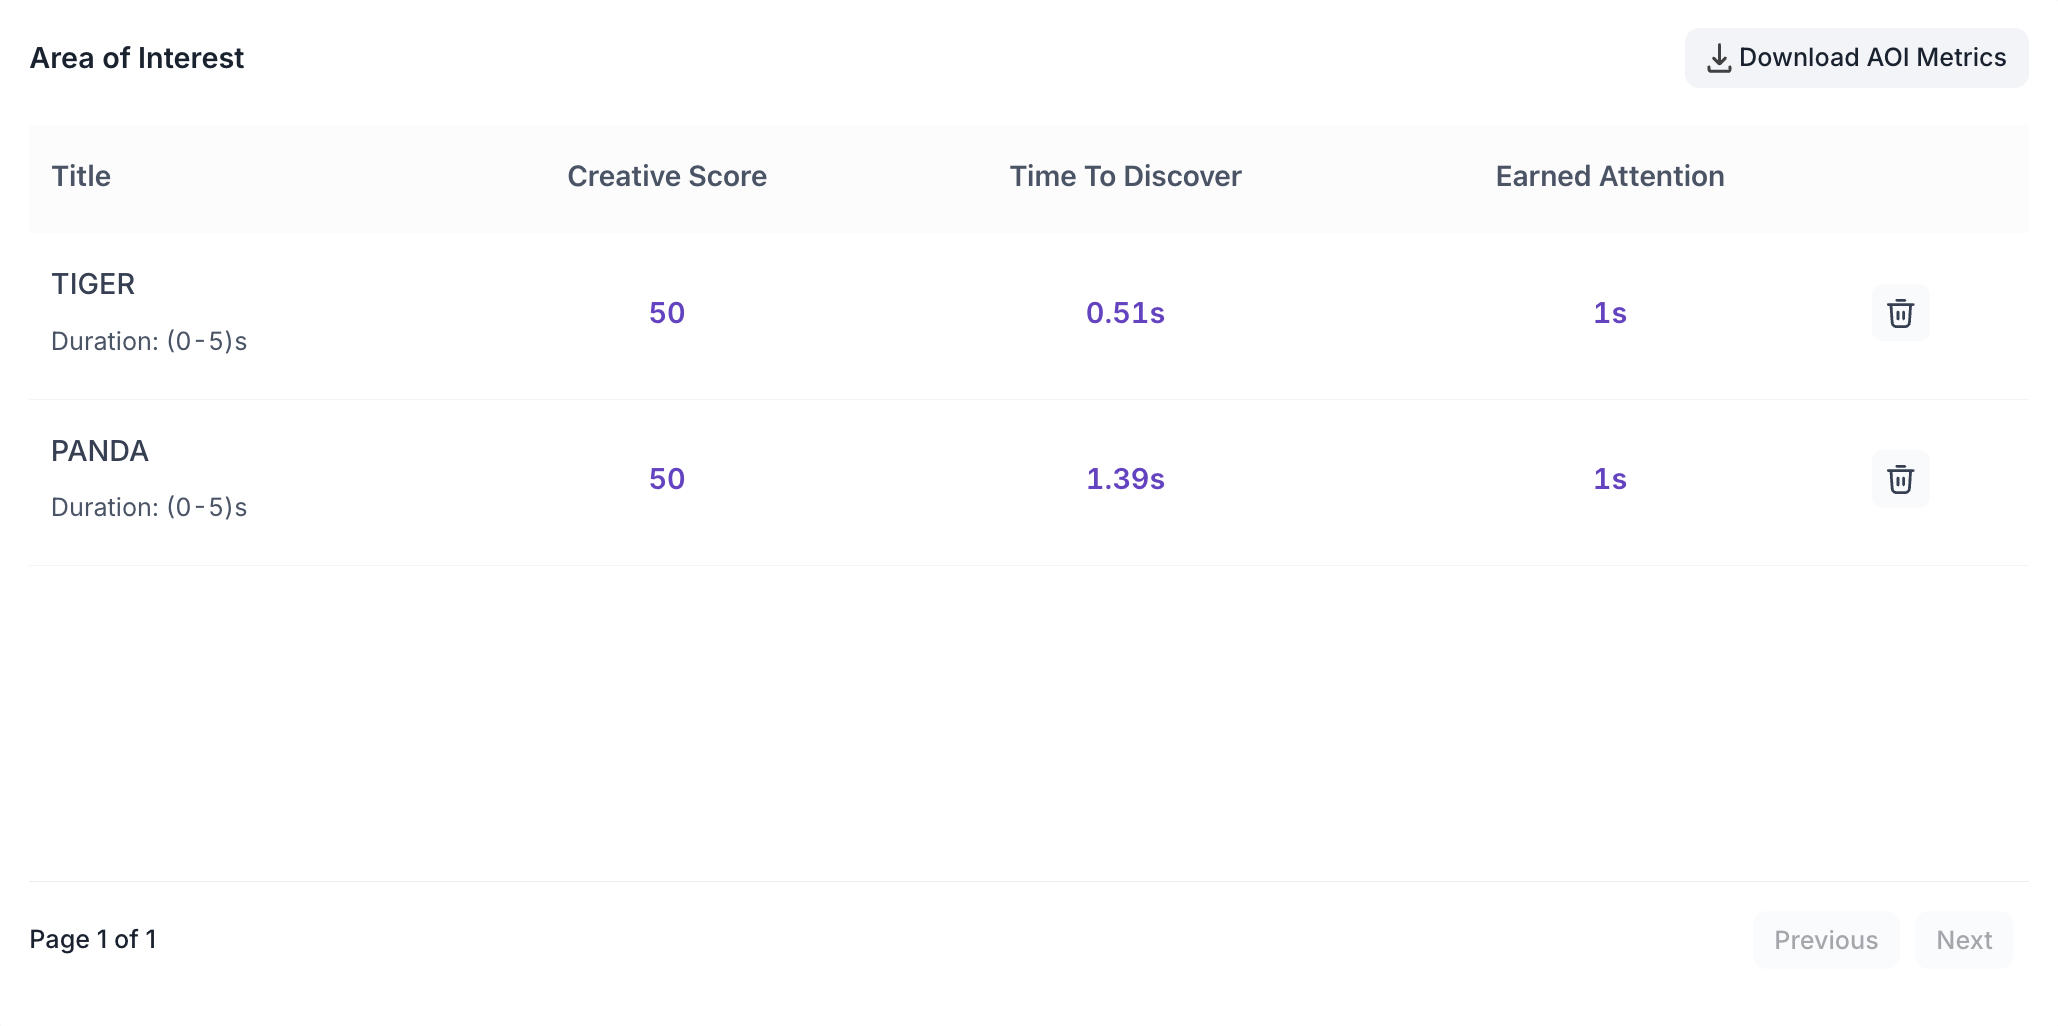
- AOI (Areas of Interest): Track attention and emotion in specific regions of the video or image
Area of Interest ( AOI ) Metrics
Media Graph Metrics