
A/B Test in Decode
Overview
The A/B Test block in Decode presents two images to participants and asks them to select which one they prefer. You can enable tracking technologies such as Facial Coding, Eye Tracking and Mouse Click to capture behavioural and emotional data alongside the stated preference.
How to Set Up an A/B Test
Step 1: Add the Block
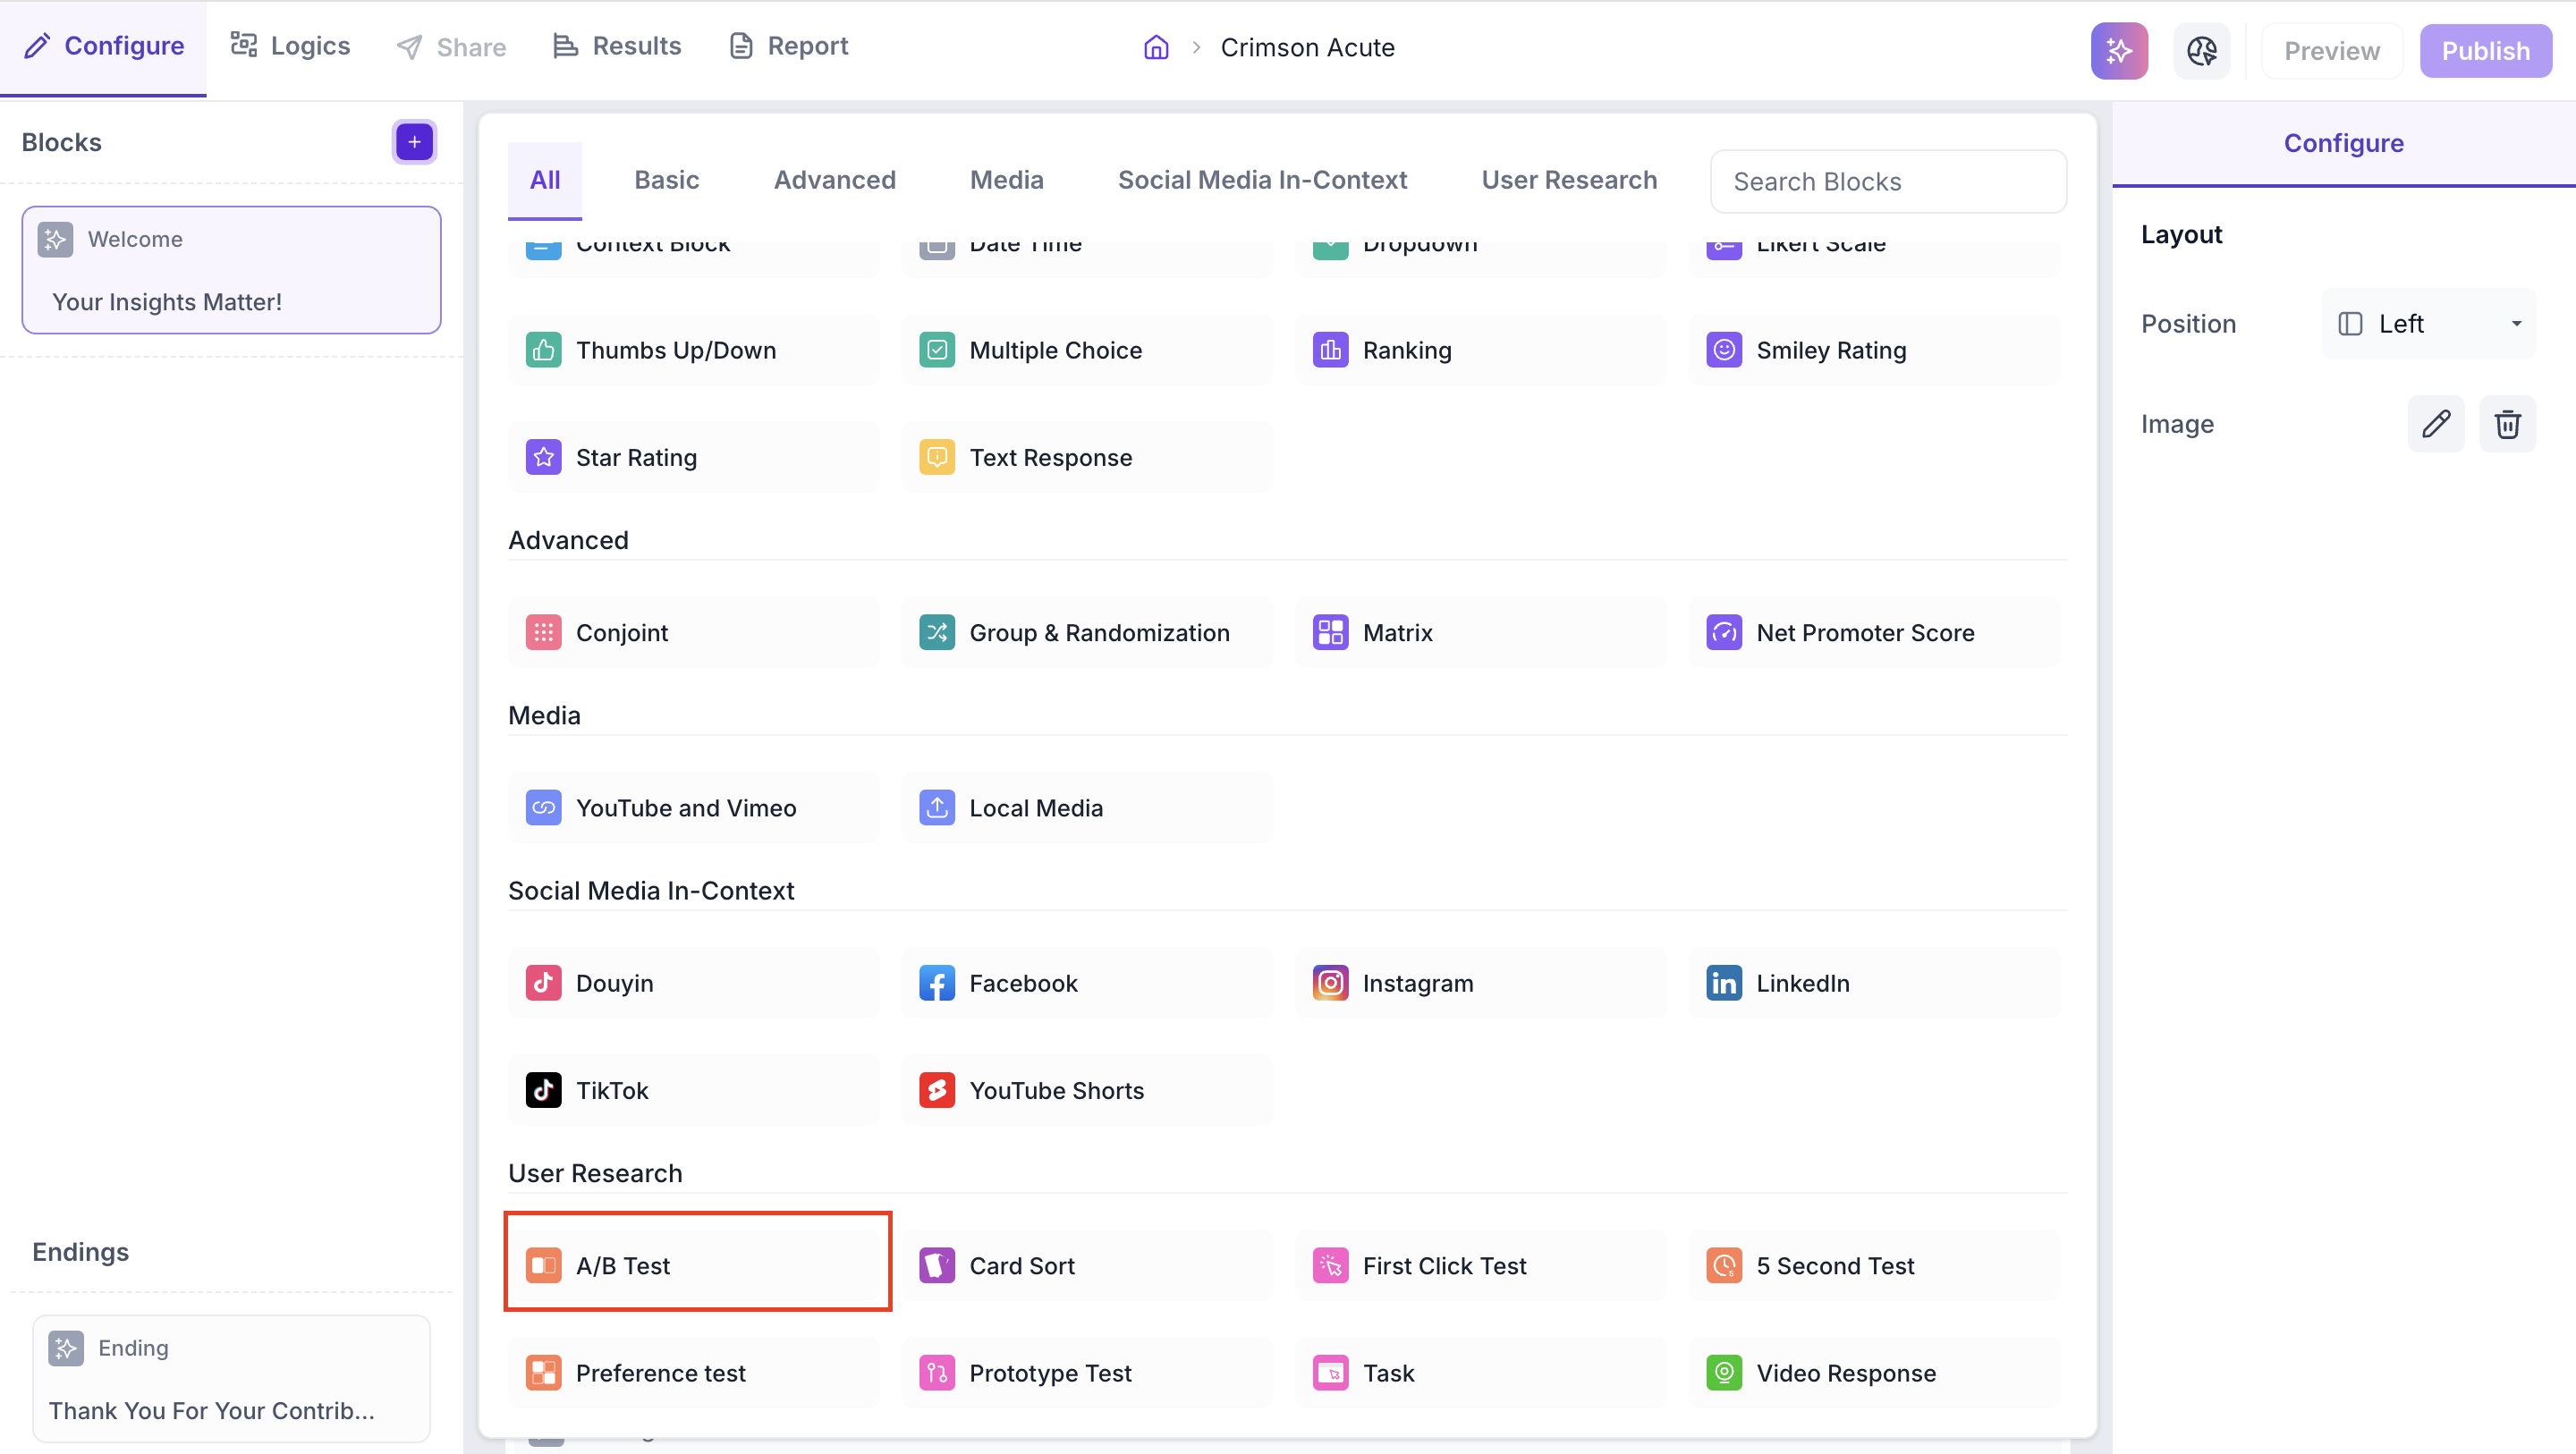
Click the + icon in the left panel to open the block selection panel. Under the User Research section, select A/B Test.
Step 2: Upload Your Images
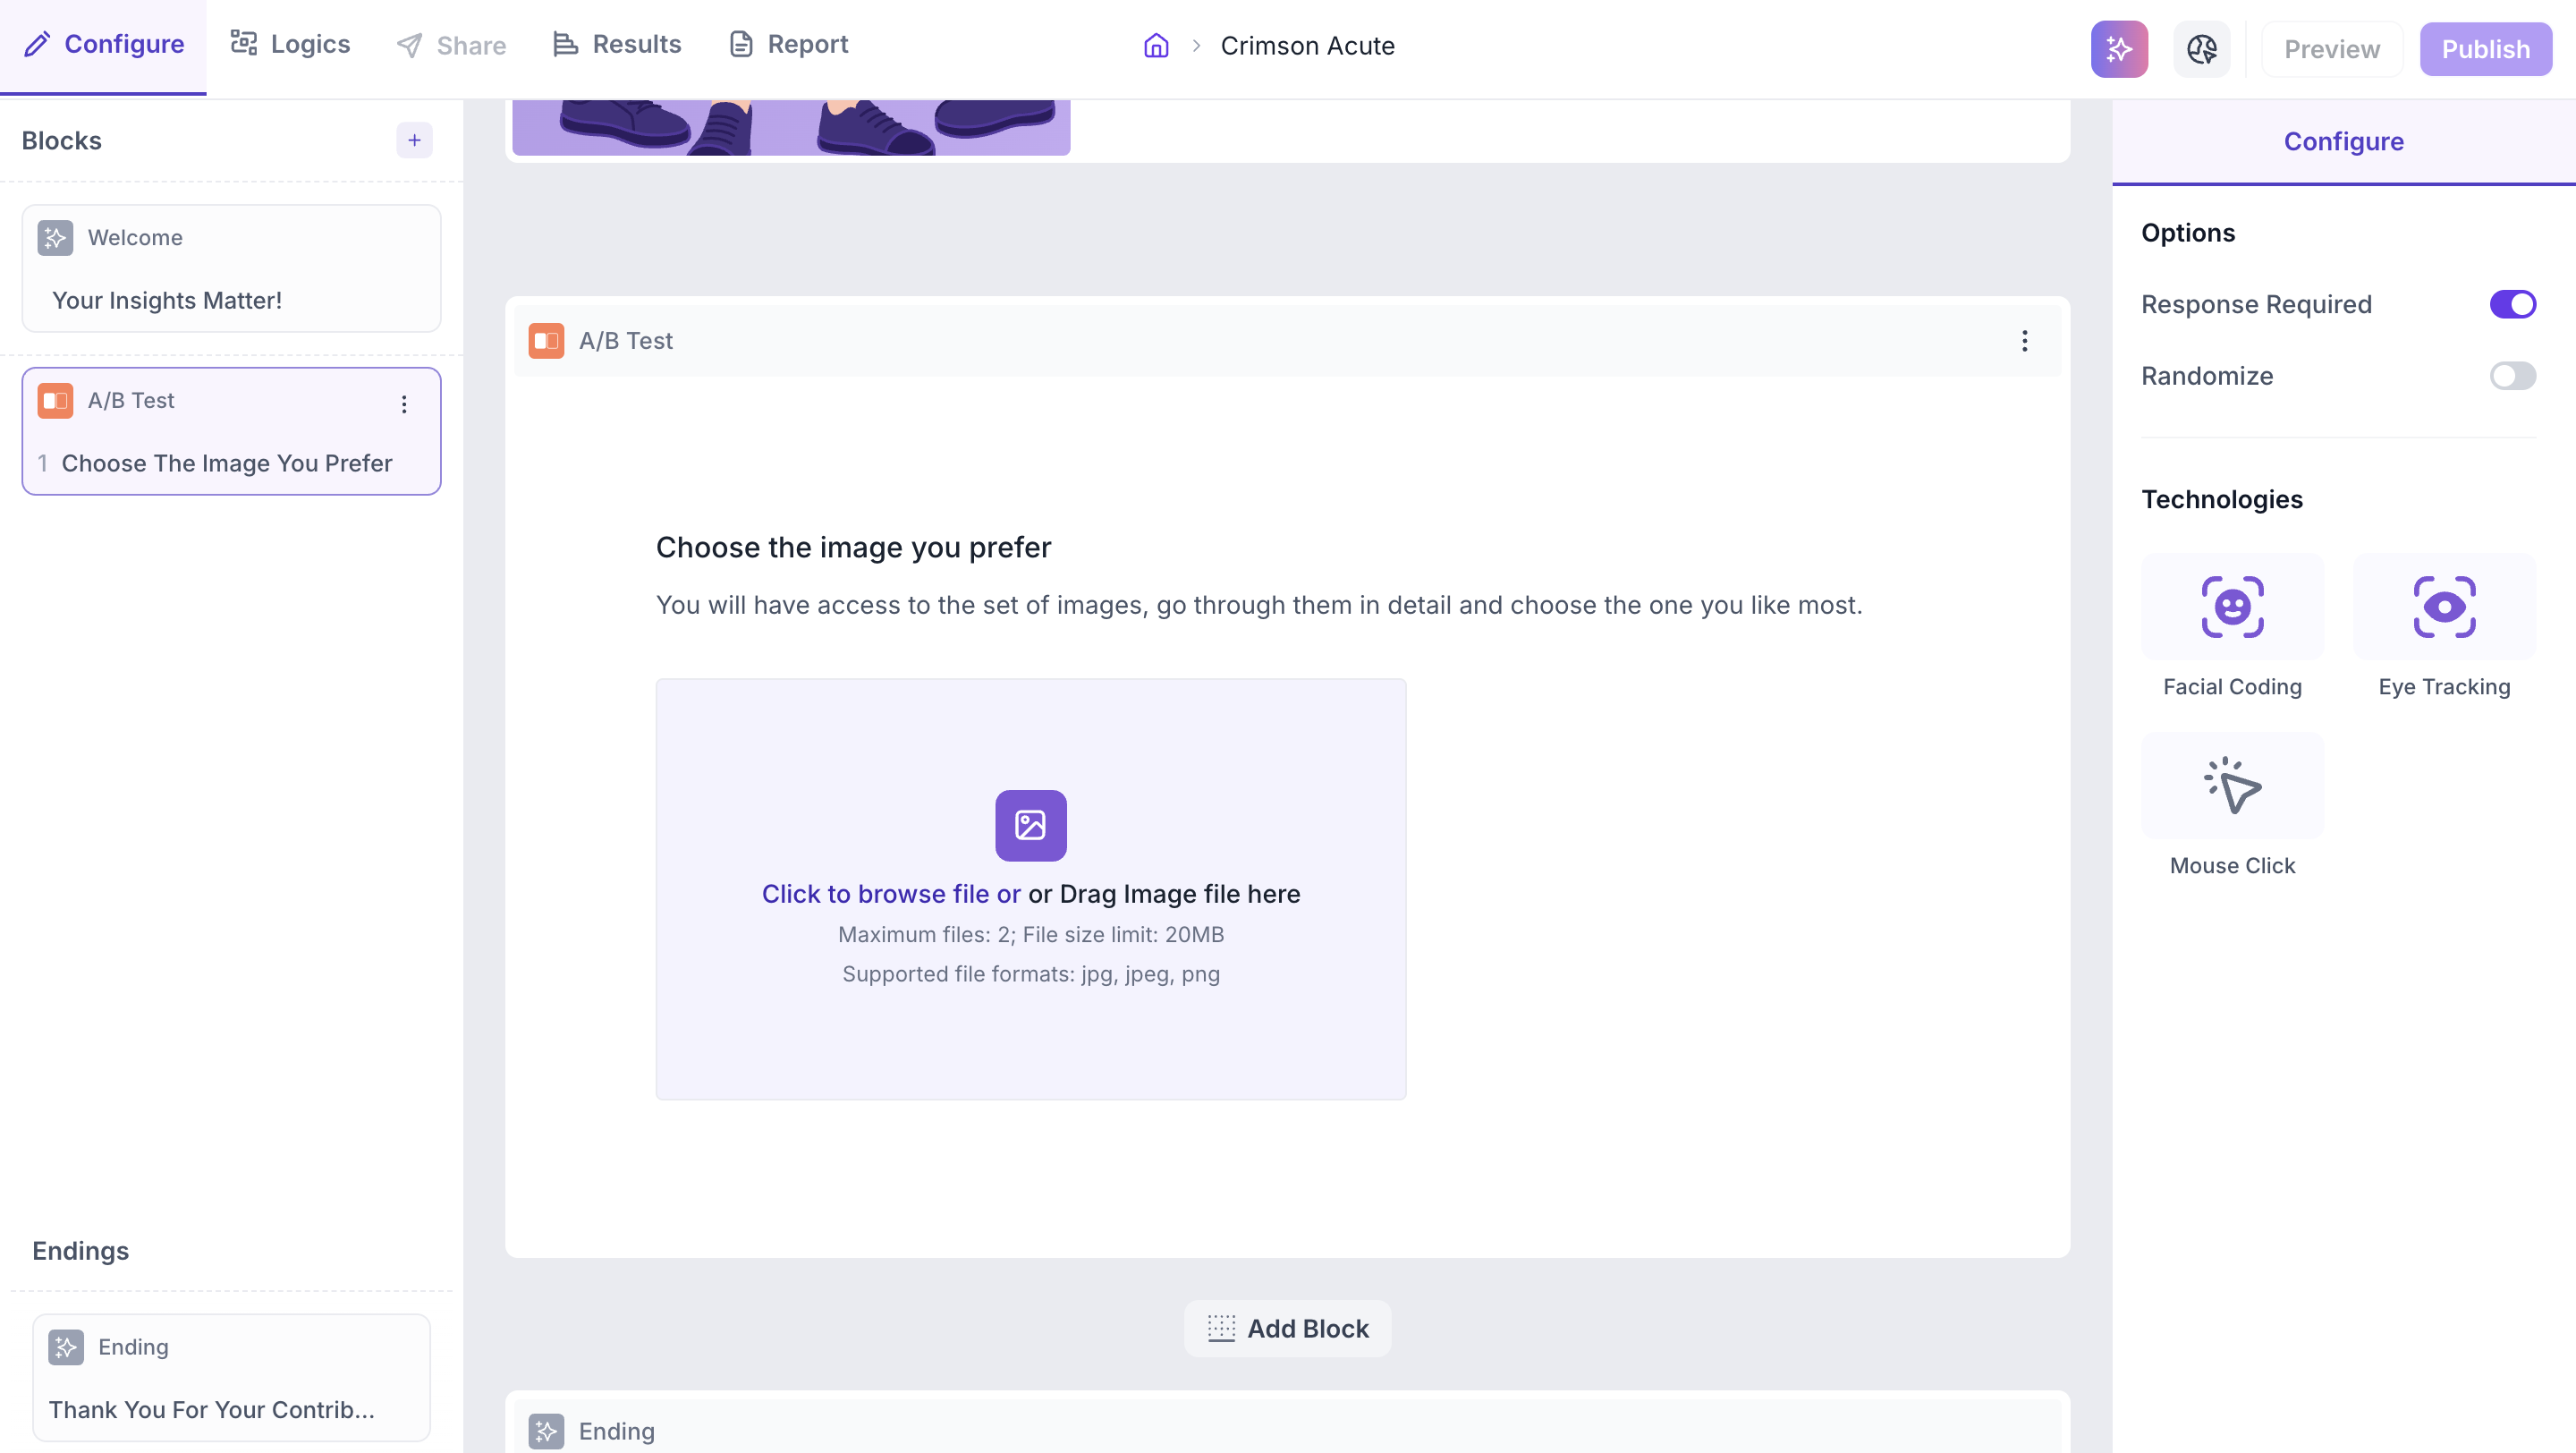
Click the upload area or drag and drop your image files into the block.
File upload limits
Maximum files: 2. File size limit: 20 MB per file. Supported formats: JPG, JPEG, PNG.
Step 3: Configure Properties
Use the Configure panel to set the following properties for this block.
Options
1. Response Required: enabled by default. Participants must select one of the images before proceeding to the next block. Disable this if you want to make the question optional
2. Randomize: shuffles the order in which the two images are displayed to reduce order bias
3. Technologies: Select the tracking technologies to enable for this block.
- Facial Coding: Tracks facial expressions to identify emotional responses such as happiness, surprise and anger. Requires the participant's camera to be enabled
- Eye Tracking: Monitors eye movement and gaze to understand which areas of each image received the most visual attention
- Mouse Click: Records where participants click on the image, providing insights into which elements drew the most interaction
RESULTS
Once the study is live and responses are collected, you can view the results in the Results tab.
Block Level Summary
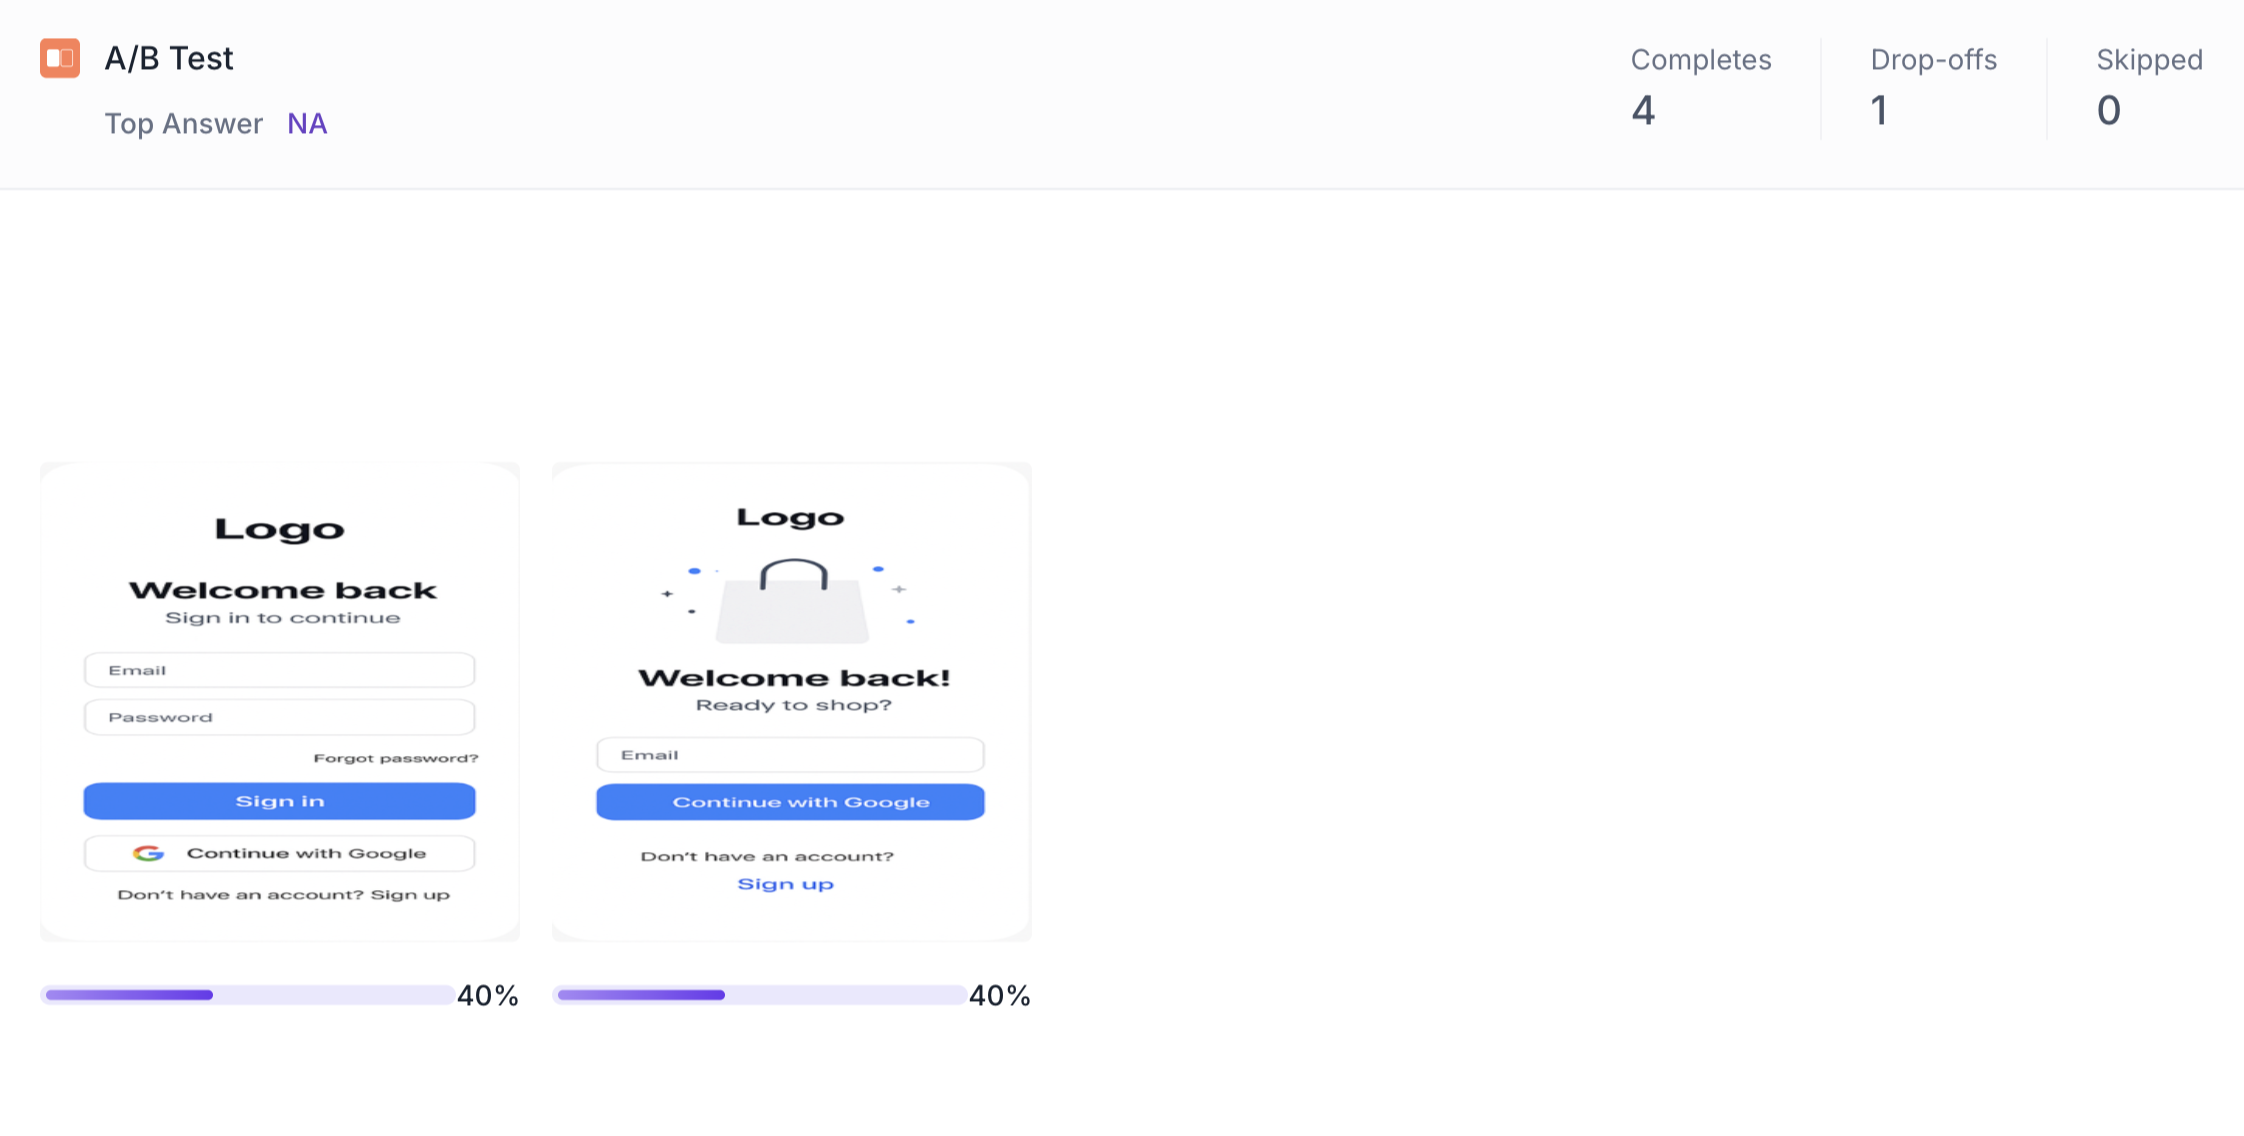
The following metrics are displayed at the top of the A/B Test block results.
- Completes: Number of participants who completed this block
- Drop offs: Participants who exited the study before reaching this block
- Skipped: Participants who viewed the block but did not respond
Image Comparison View
Both images are displayed side by side with a percentage bar below each one showing the proportion of participants who selected it.
Individual Image Results
Use the arrows on either side of the image to move between the two versions and view detailed results for each one. The following data is available for each image.
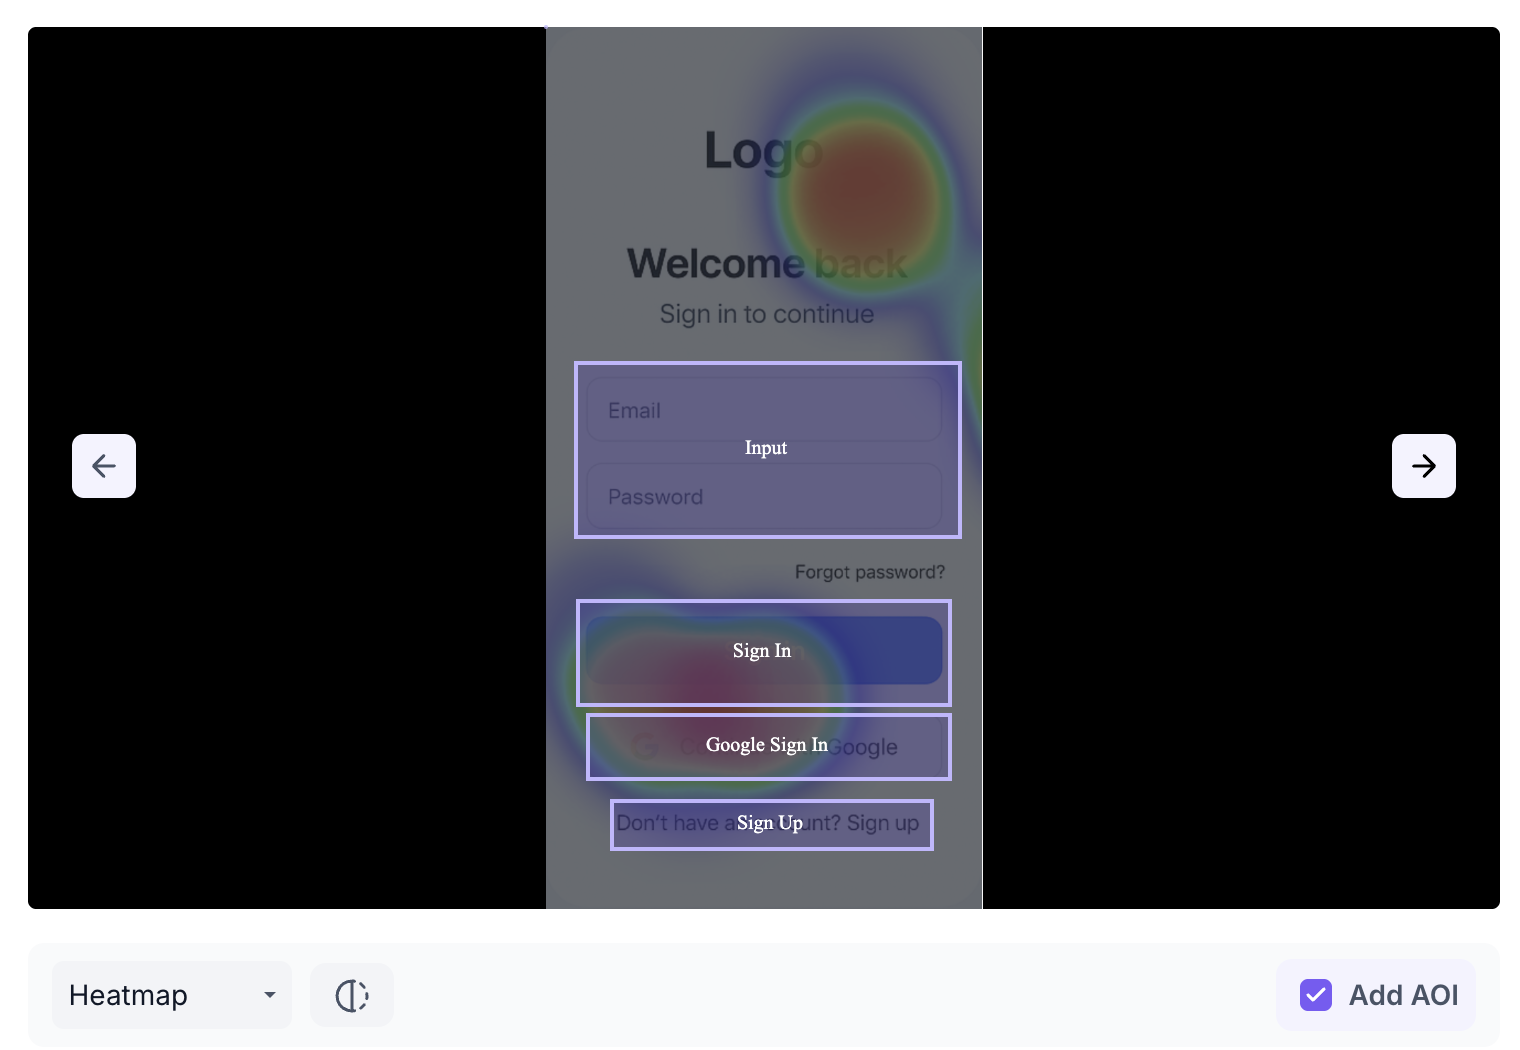
Heatmap and Transparency Map
The image is displayed with a visual overlay showing where participants looked. Switch between Heatmap and Transparency Map views using the view selector below the image.
Heatmap: Displays aggregated gaze intensity using a colour gradient from cool to warm. Warmer colours such as red and orange highlight areas that received the most visual attention. Cooler colours indicate areas that received less attention
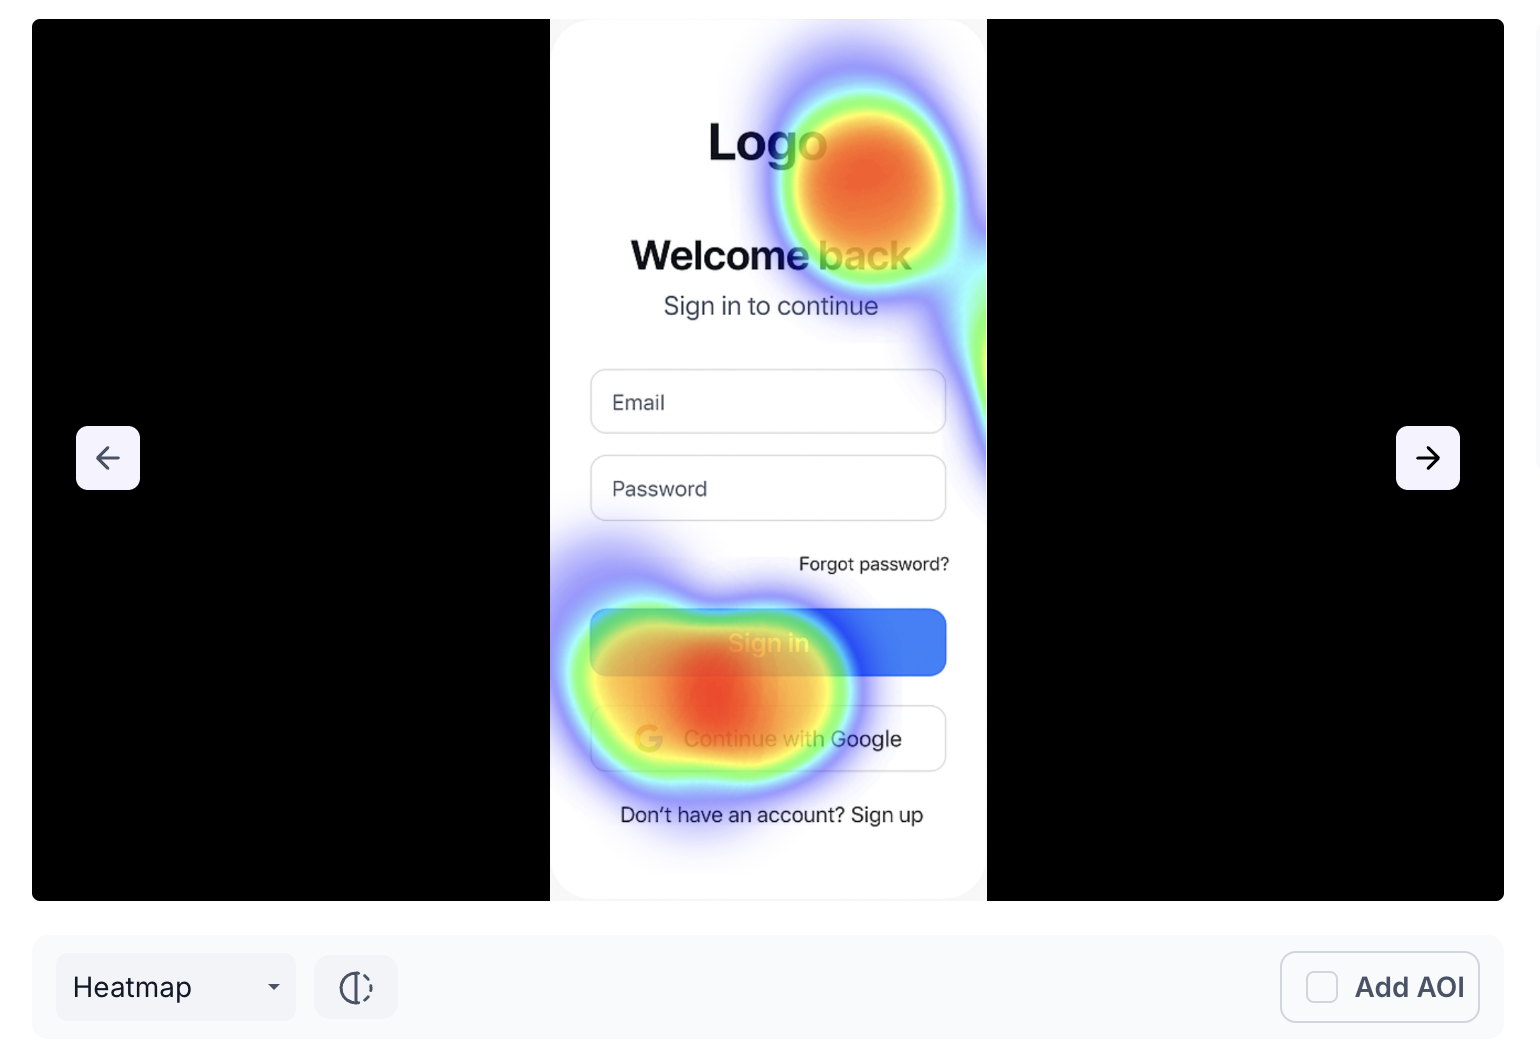
Transparency Map: Makes areas of the image more transparent where participants looked most, providing a clear view of attention distribution without the colour overlay of the heatmap
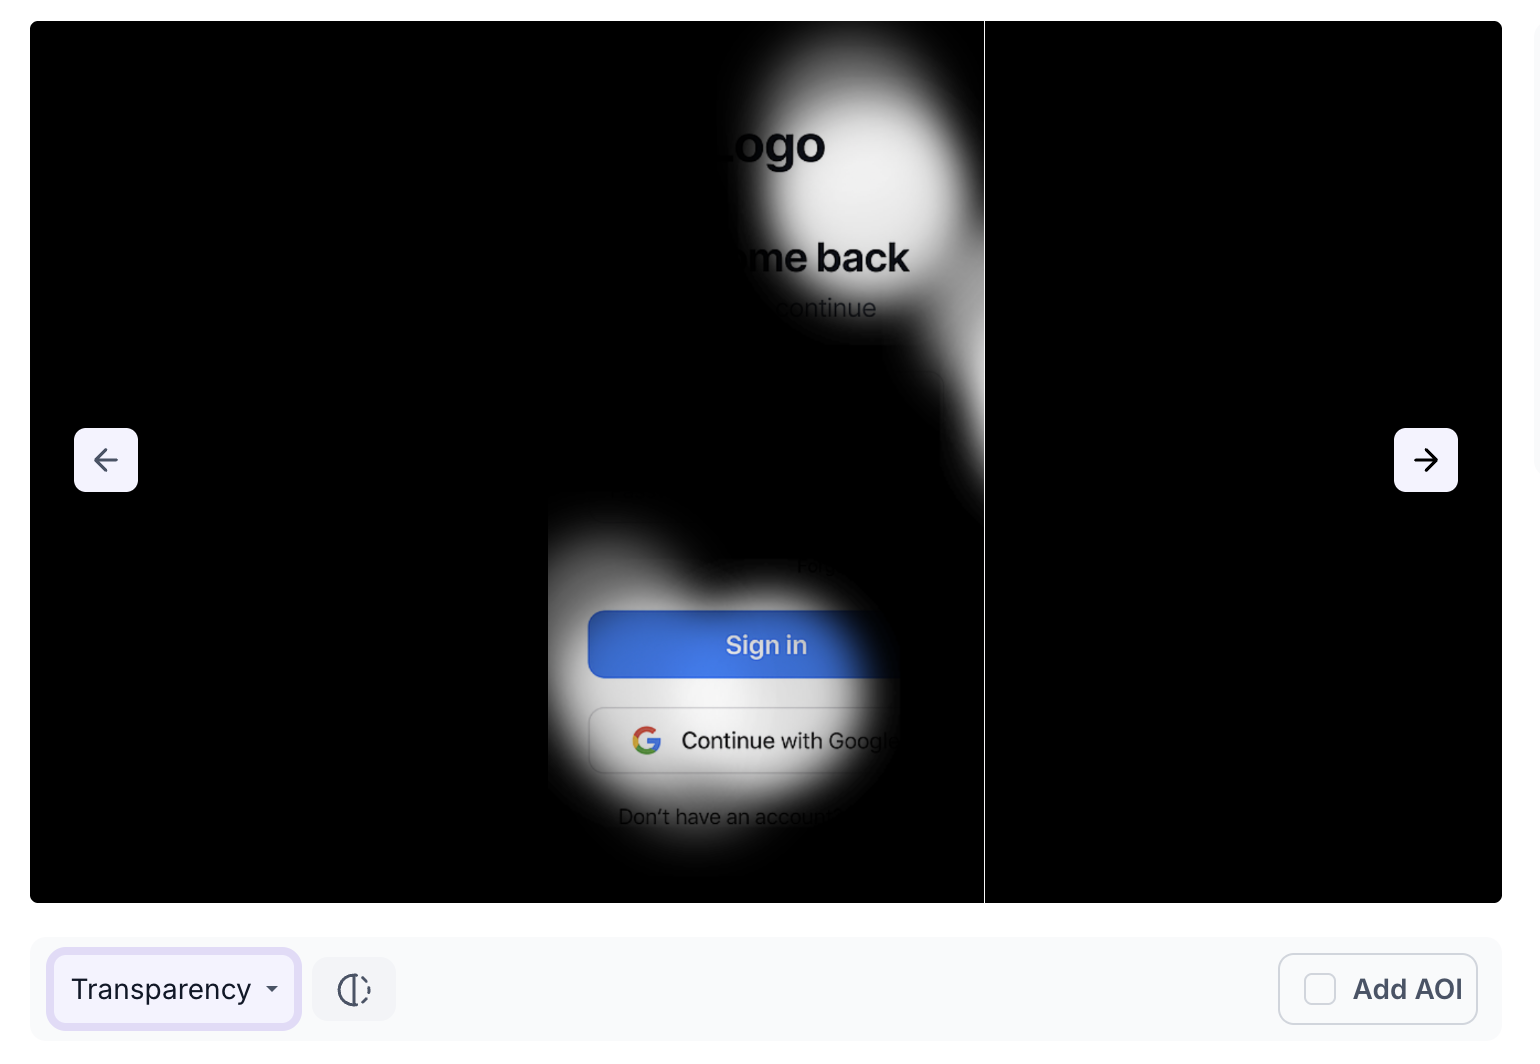
Click: shows X markers on the image indicating where participants clicked, revealing which areas of the image drew the most interaction.
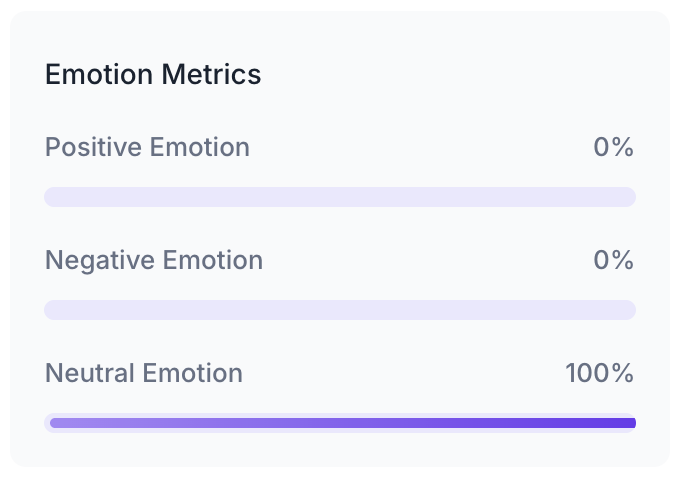
Emotion Metrics
Shows the emotional response of participants while viewing this image. Each metric is shown as a percentage of total participants.
- Positive Emotion: Percentage of participants who expressed a positive emotional response such as happiness or surprise
- Negative Emotion: Percentage of participants who expressed a negative emotional response such as anger or disgust
- Neutral Emotion: Percentage of participants who expressed no strong emotional response
Areas of Interest
Areas of Interest allow you to track participant attention within a specific region of the image, such as a logo, a button or a design element. Click Add AOI to draw a box over the area you want to track. Once saved, each AOI appears in the Area of Interest table with the following metrics.
- Title: The name assigned to the AOI
- Time Spent: Total time participants spent looking at this area
- Avg Time to First Fixation: Average time taken for participants to first notice this area
- Avg Fixation Duration: Average length of time participants held their gaze on this area
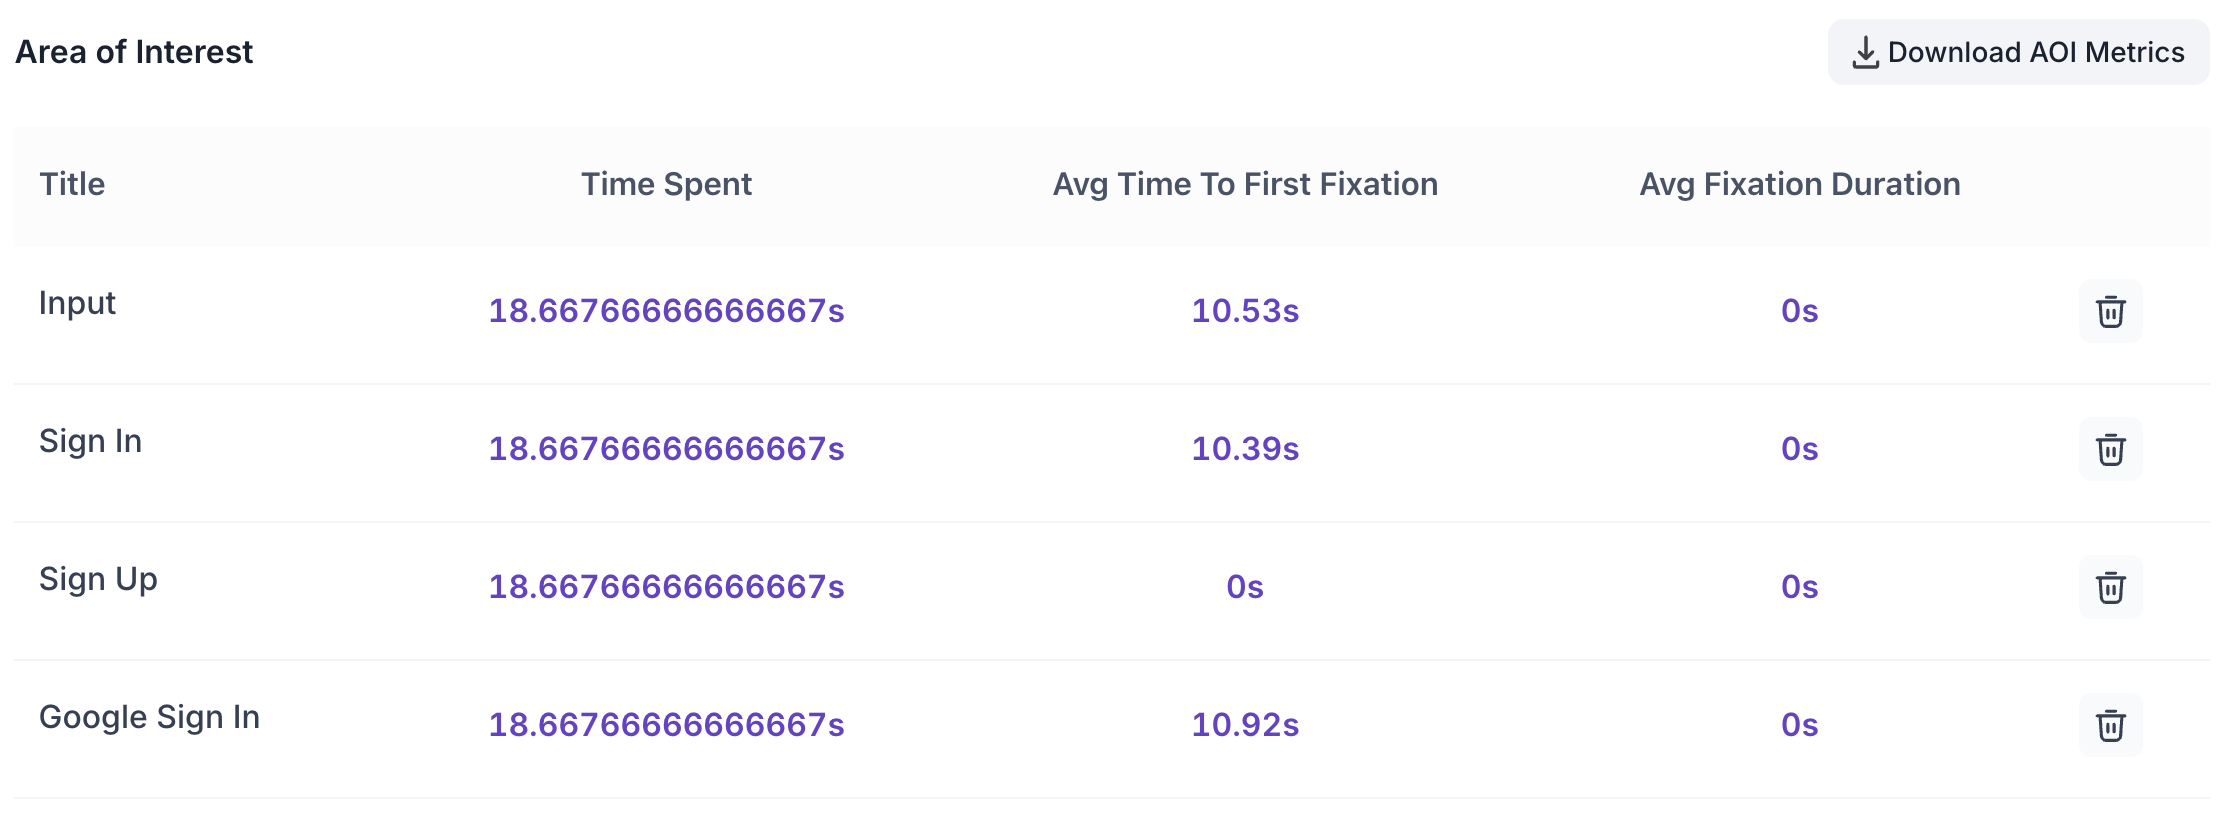
AOI data can be downloaded as a CSV file using the Download AOI Metrics button.