Matrix Block in Decode
Overview
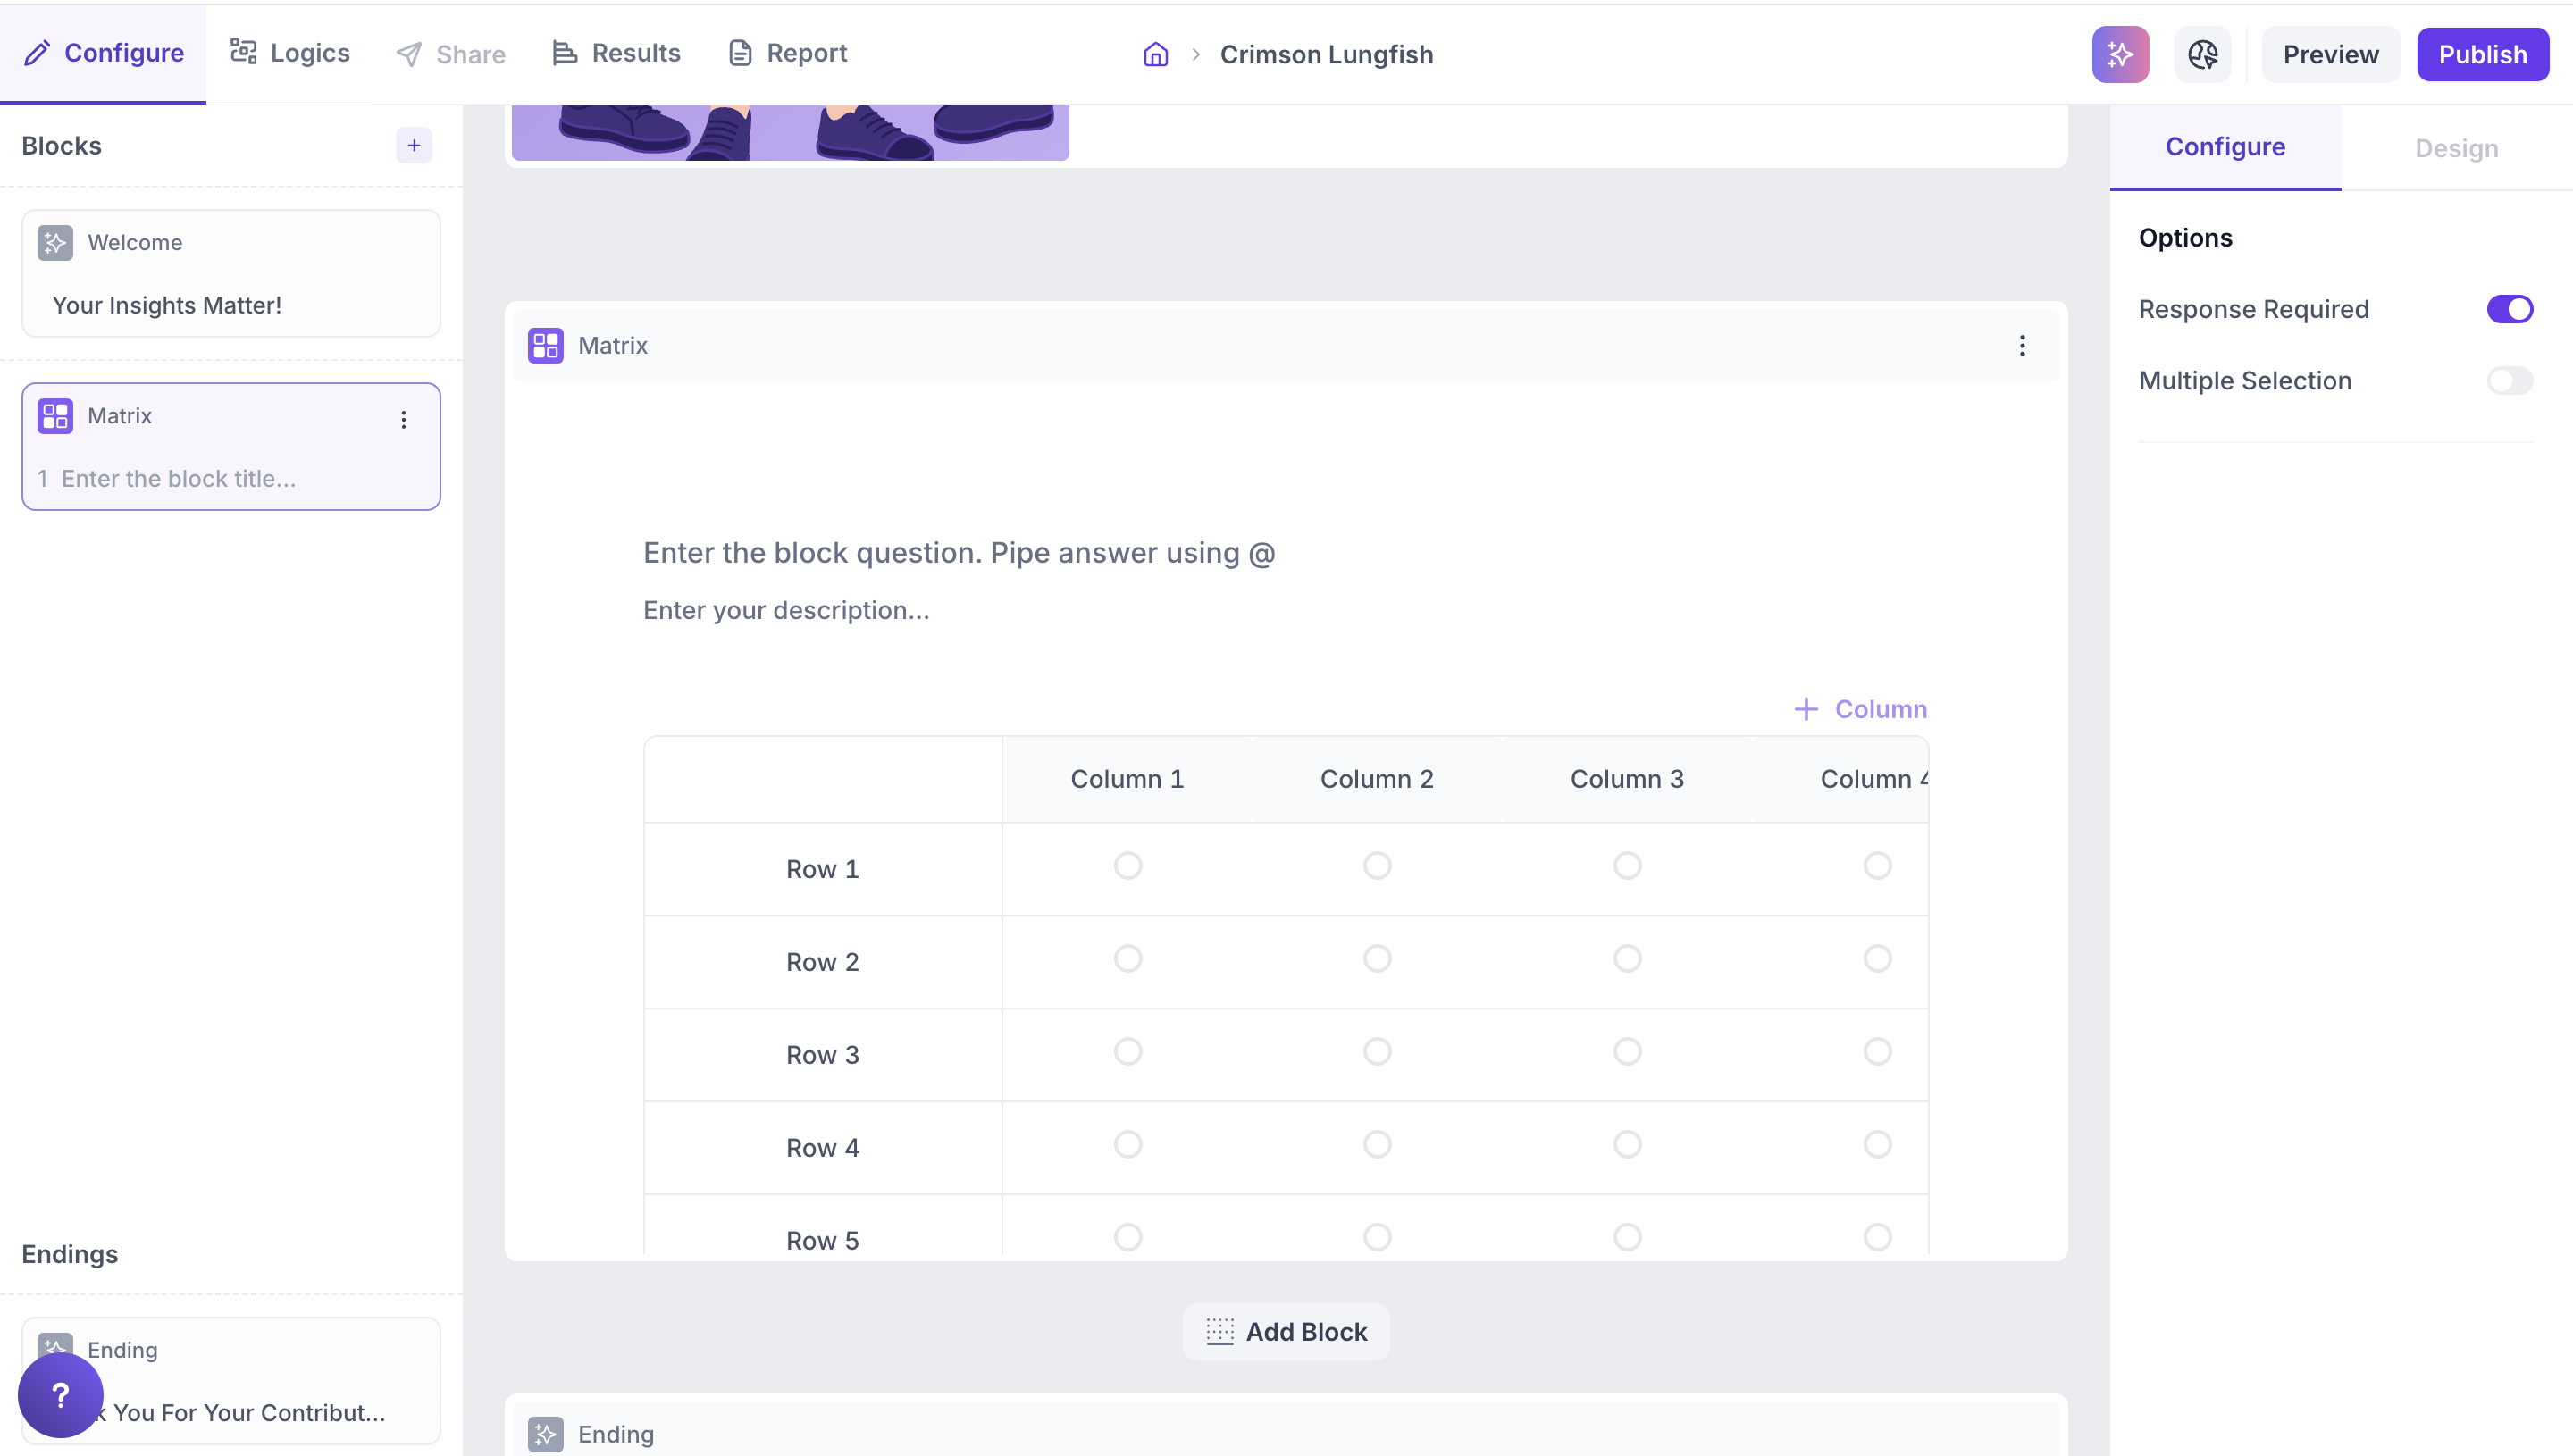
The Matrix block in Decode lets you present multiple items for participants to rate using a consistent scale. Each row is an item and each column is a rating option. Participants rate every row using the same set of column options. The block supports up to 9 rows and 9 columns.
Configuring the Matrix Block
When you add a Matrix block to your study, you can customise the rows and columns to match your research needs.
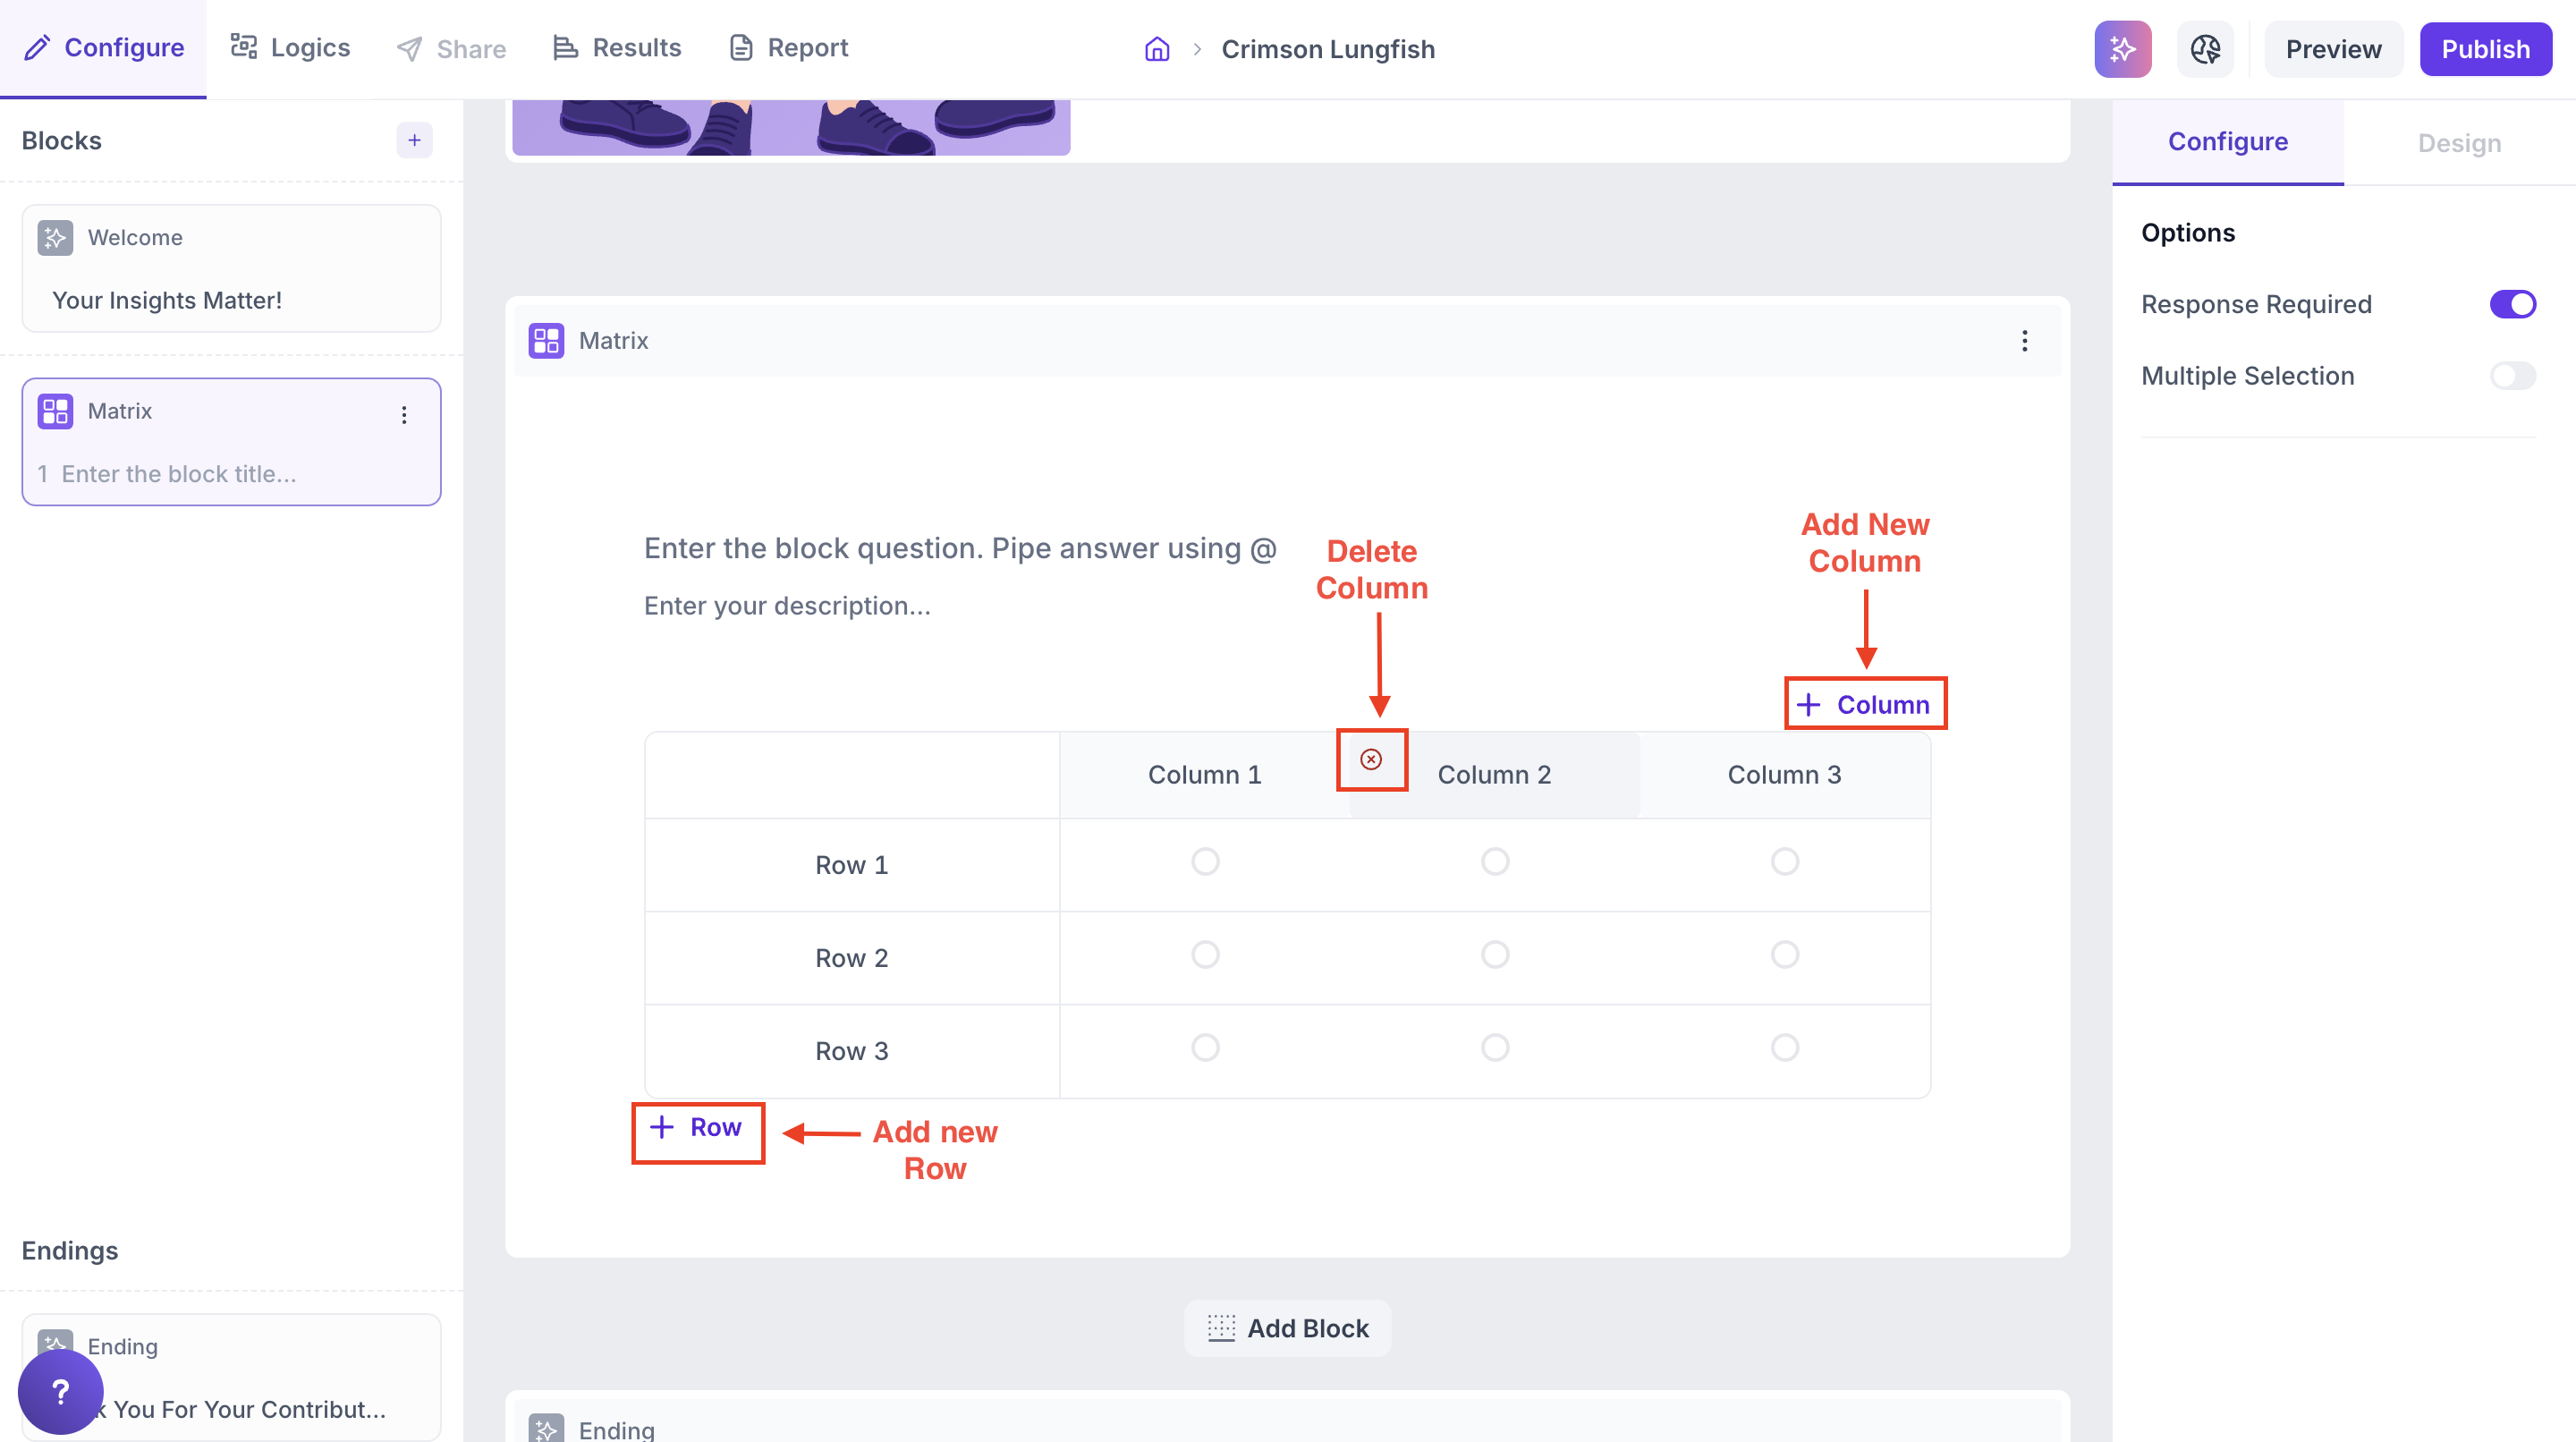
- To add a new column, click the + Column button at the top right of the matrix
- To add a new row, click the + Row button at the bottom of the matrix
- To remove a row or column, hover over it and click the x icon that appears
Properties
Response Required (Enabled by default): This setting ensures respondents must select an option before proceeding to the next question. You can disable it if you want to make the question optional.
Results
Once the study is live and responses are collected, you can view the results in the Results tab.
Overall Results
1. Top Summary
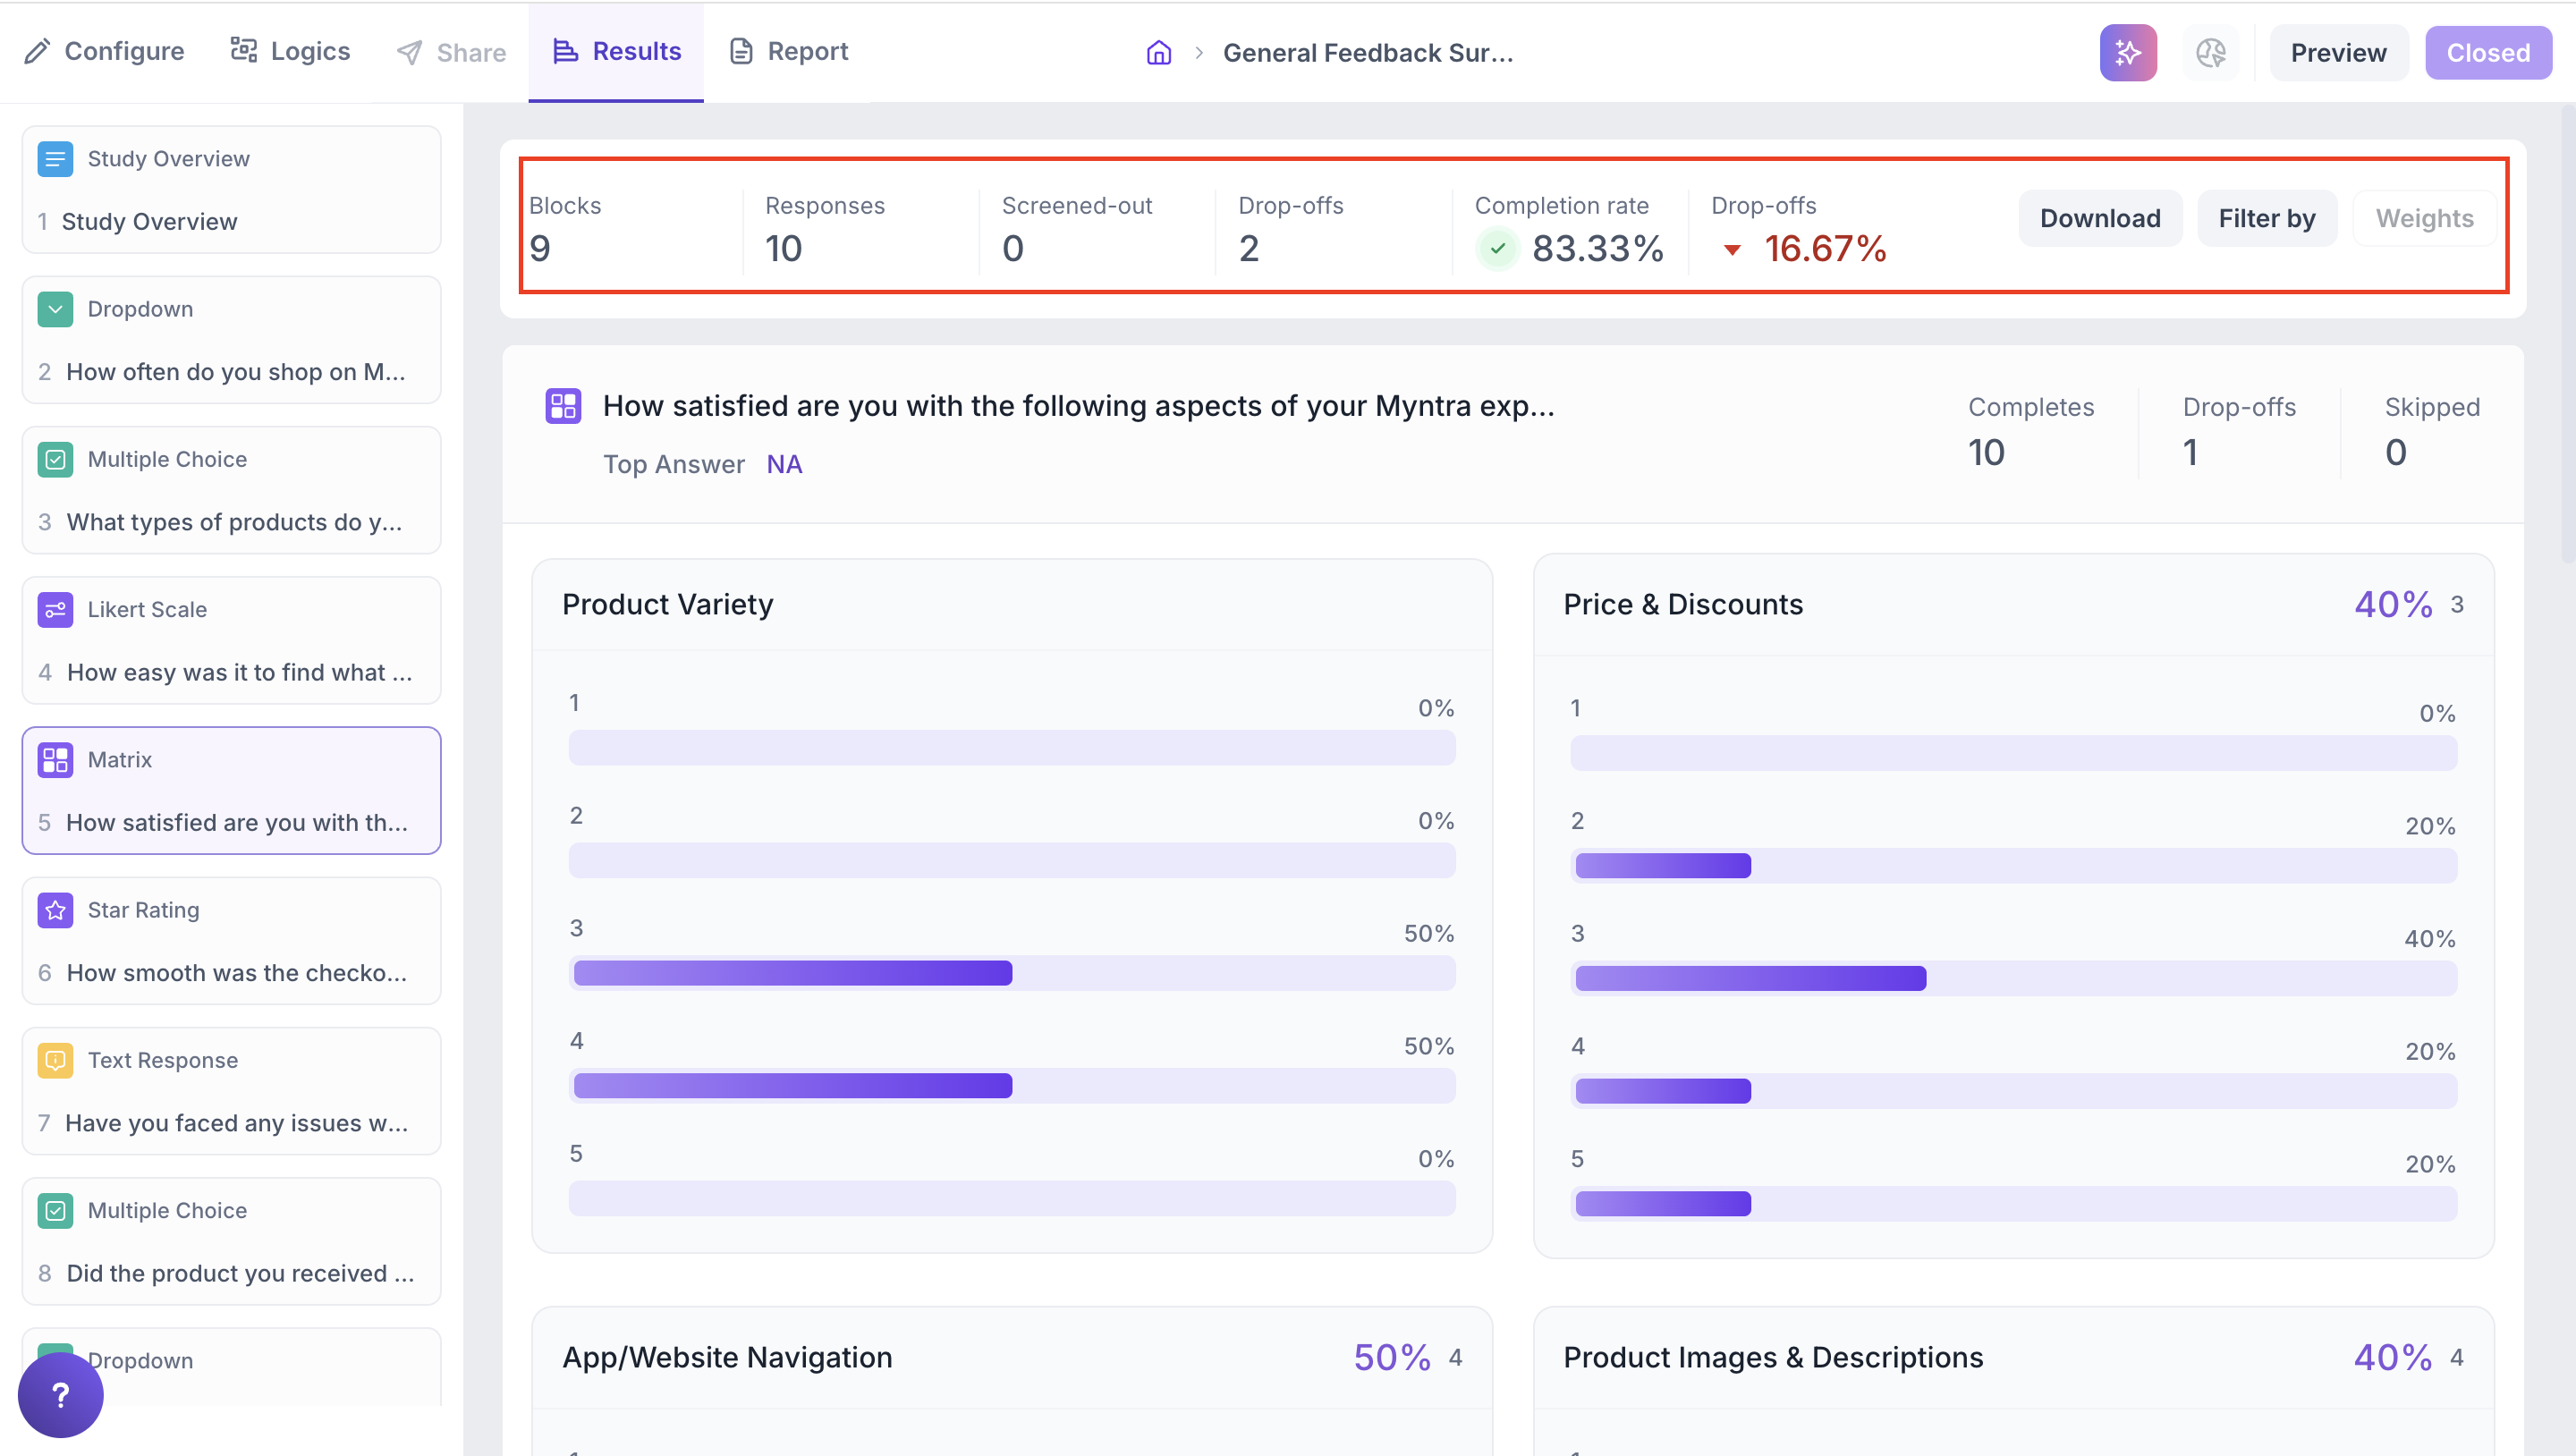
This section provides an overview of how your study performed:
- Total Blocks – Number of question blocks included in the study
- Total Responses – Count of completed responses across all blocks
- Screened Out – Respondents who did not qualify based on screener logic
- Dropped Off – Respondents who exited the study midway
- Completion Rate – Percentage of respondents who completed the full study
- Drop-Off Rate – Percentage of respondents who exited before completion
2. Study-Level Download
- Download all collected response data at the study level, covering every block and question.
3. Filter Responses
Use the filter panel at the top of the results view to analyze specific respondent segments.
You can filter based on:
- Answers from previous questions
- Device type (e.g., mobile, desktop)
- Browser used (e.g., Chrome, Safari)
This helps uncover trends and insights within specific user groups.
Matrix Block Results
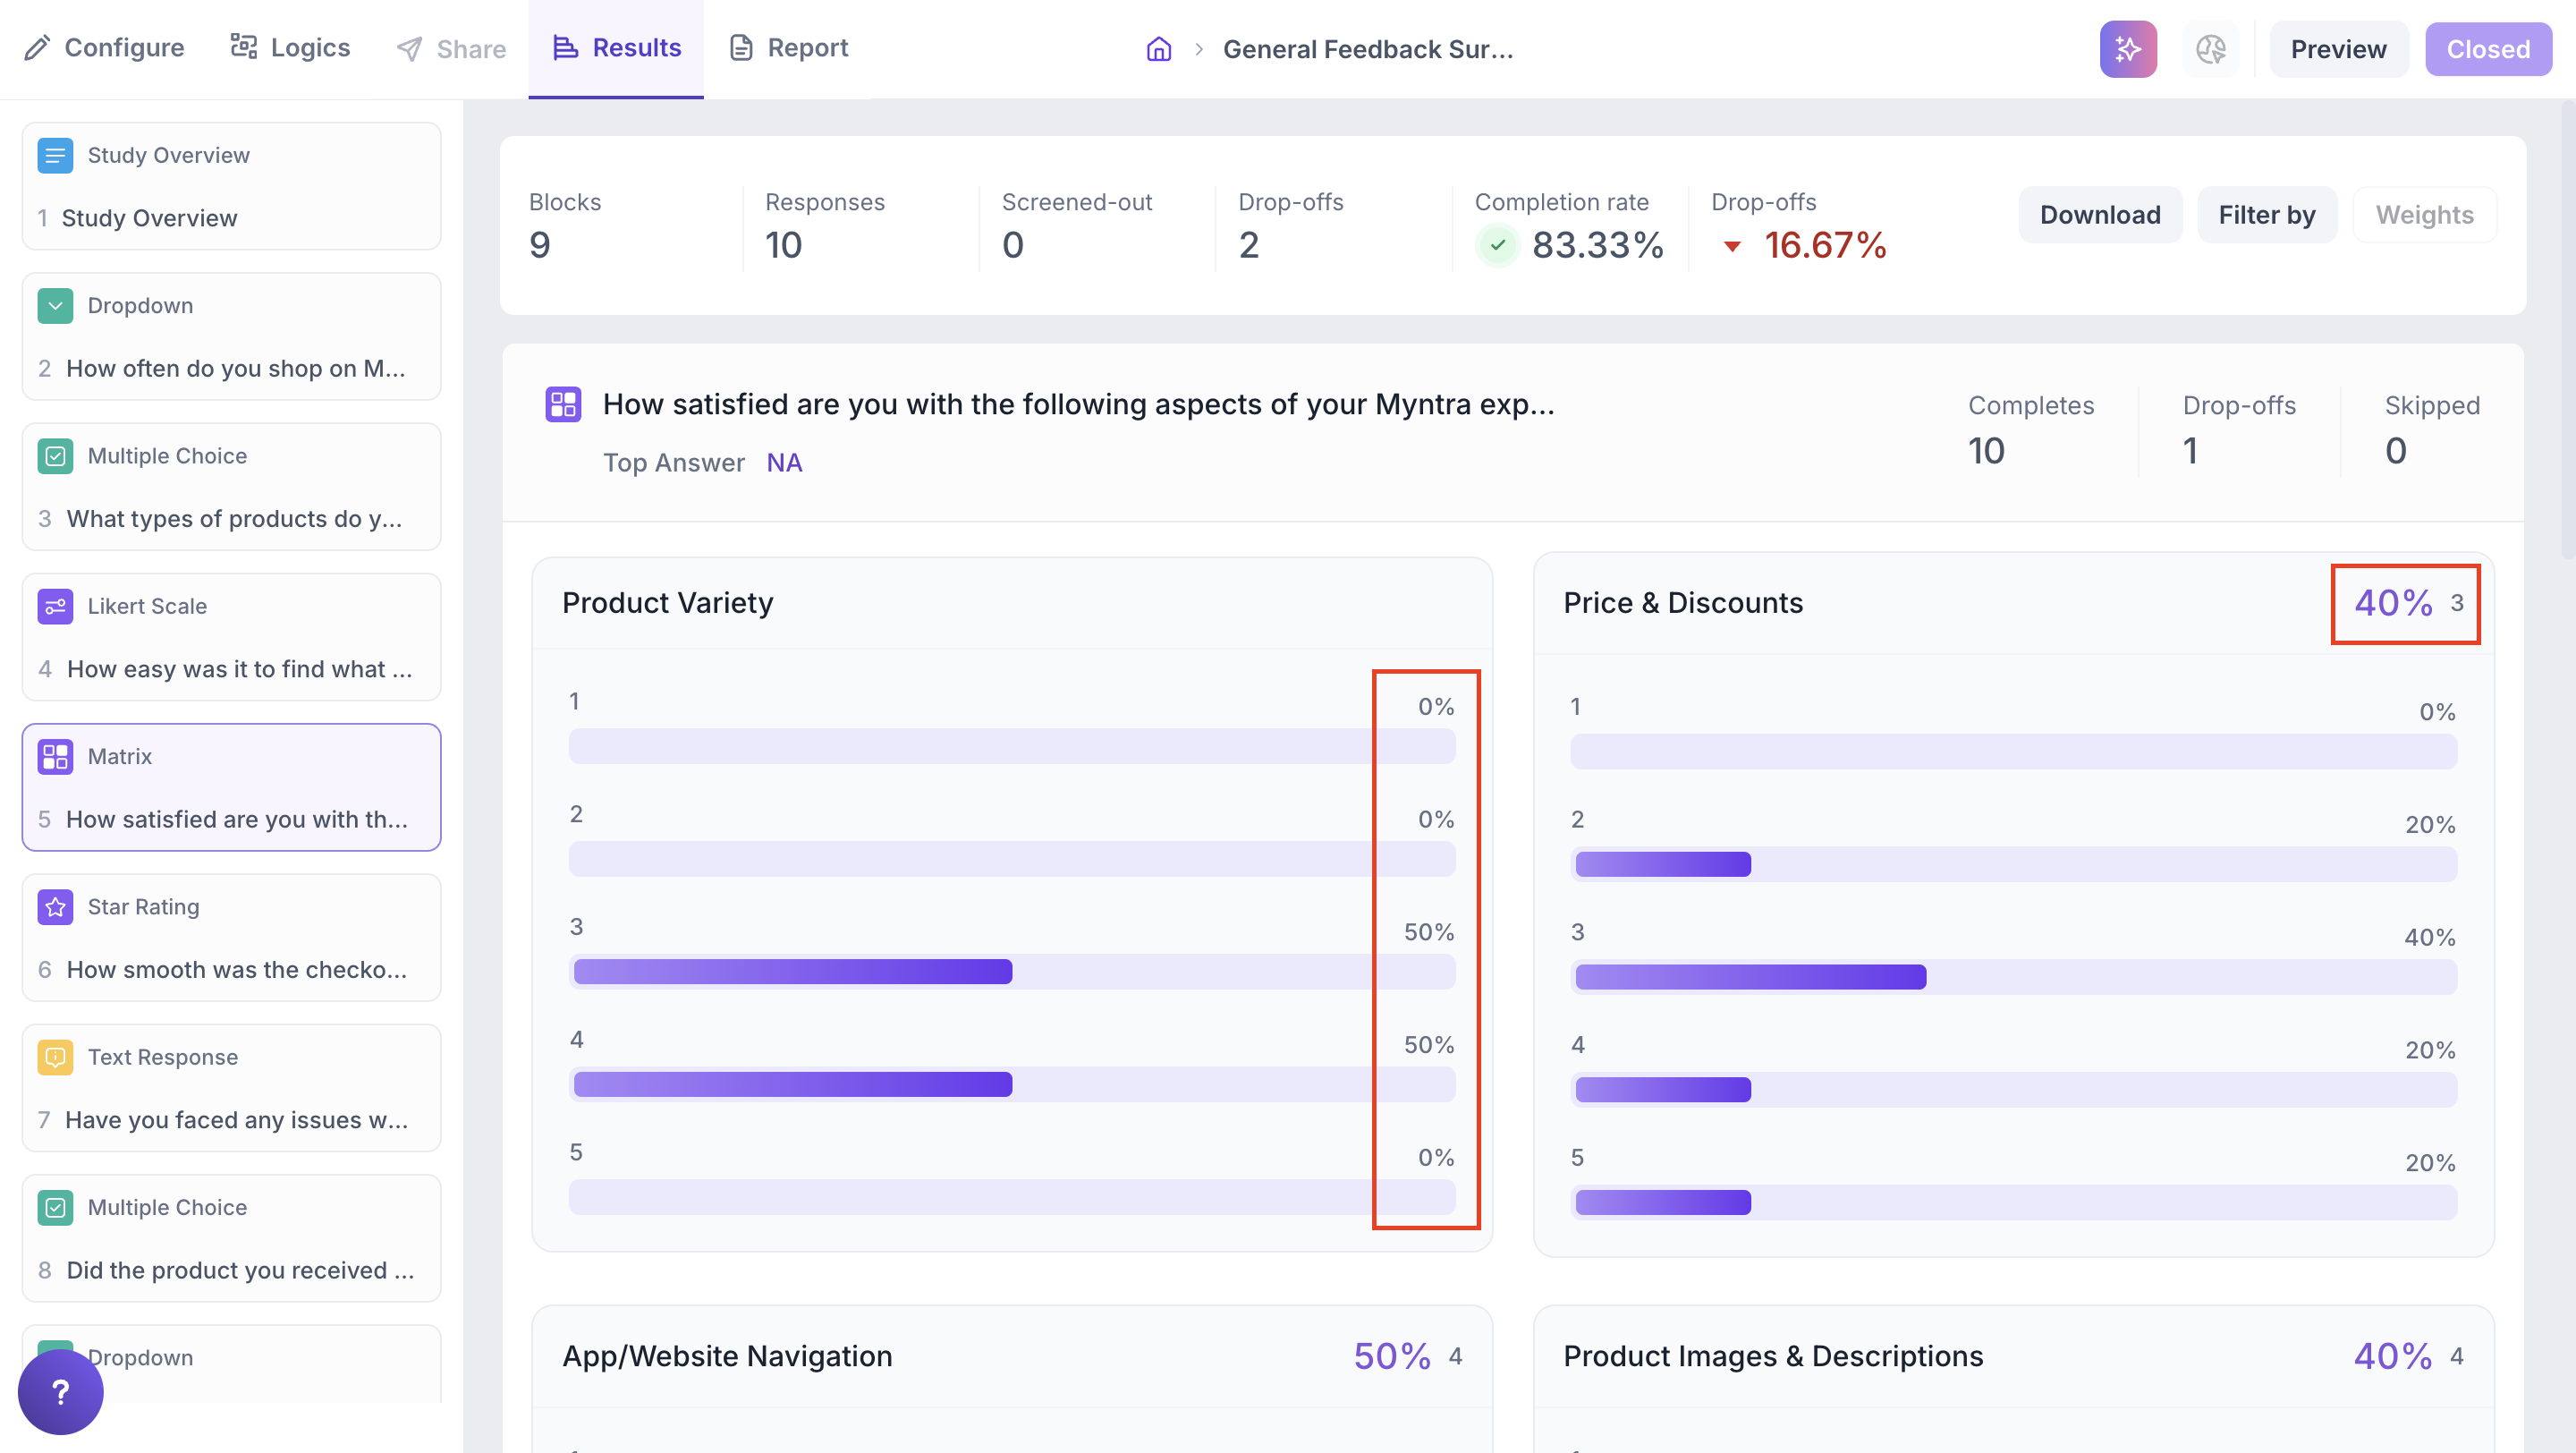
1. Response Summary
- Completed – Number of respondents who answered the question.
- Drop-off – Respondents who exited the study before reaching this block.
- Skipped – Number of respondents who viewed but did not respond.
2. Graph View and Table View
Matrix block results are displayed in two views.
Graph View
- Each row represents a single statement or item, such as Product Variety or App Navigation
- Each column represents a response scale point, such as 1 to 5. The scale can go up to 9 levels
- Inside each cell, a horizontal bar indicates the percentage of respondents who selected that rating for that item
- Color intensity represents how popular the rating was, the more filled the bar, the higher the percentage
At the top of each card, the most selected rating and its percentage are displayed.
Example
For Price and Discounts, 40% of respondents chose rating 3.
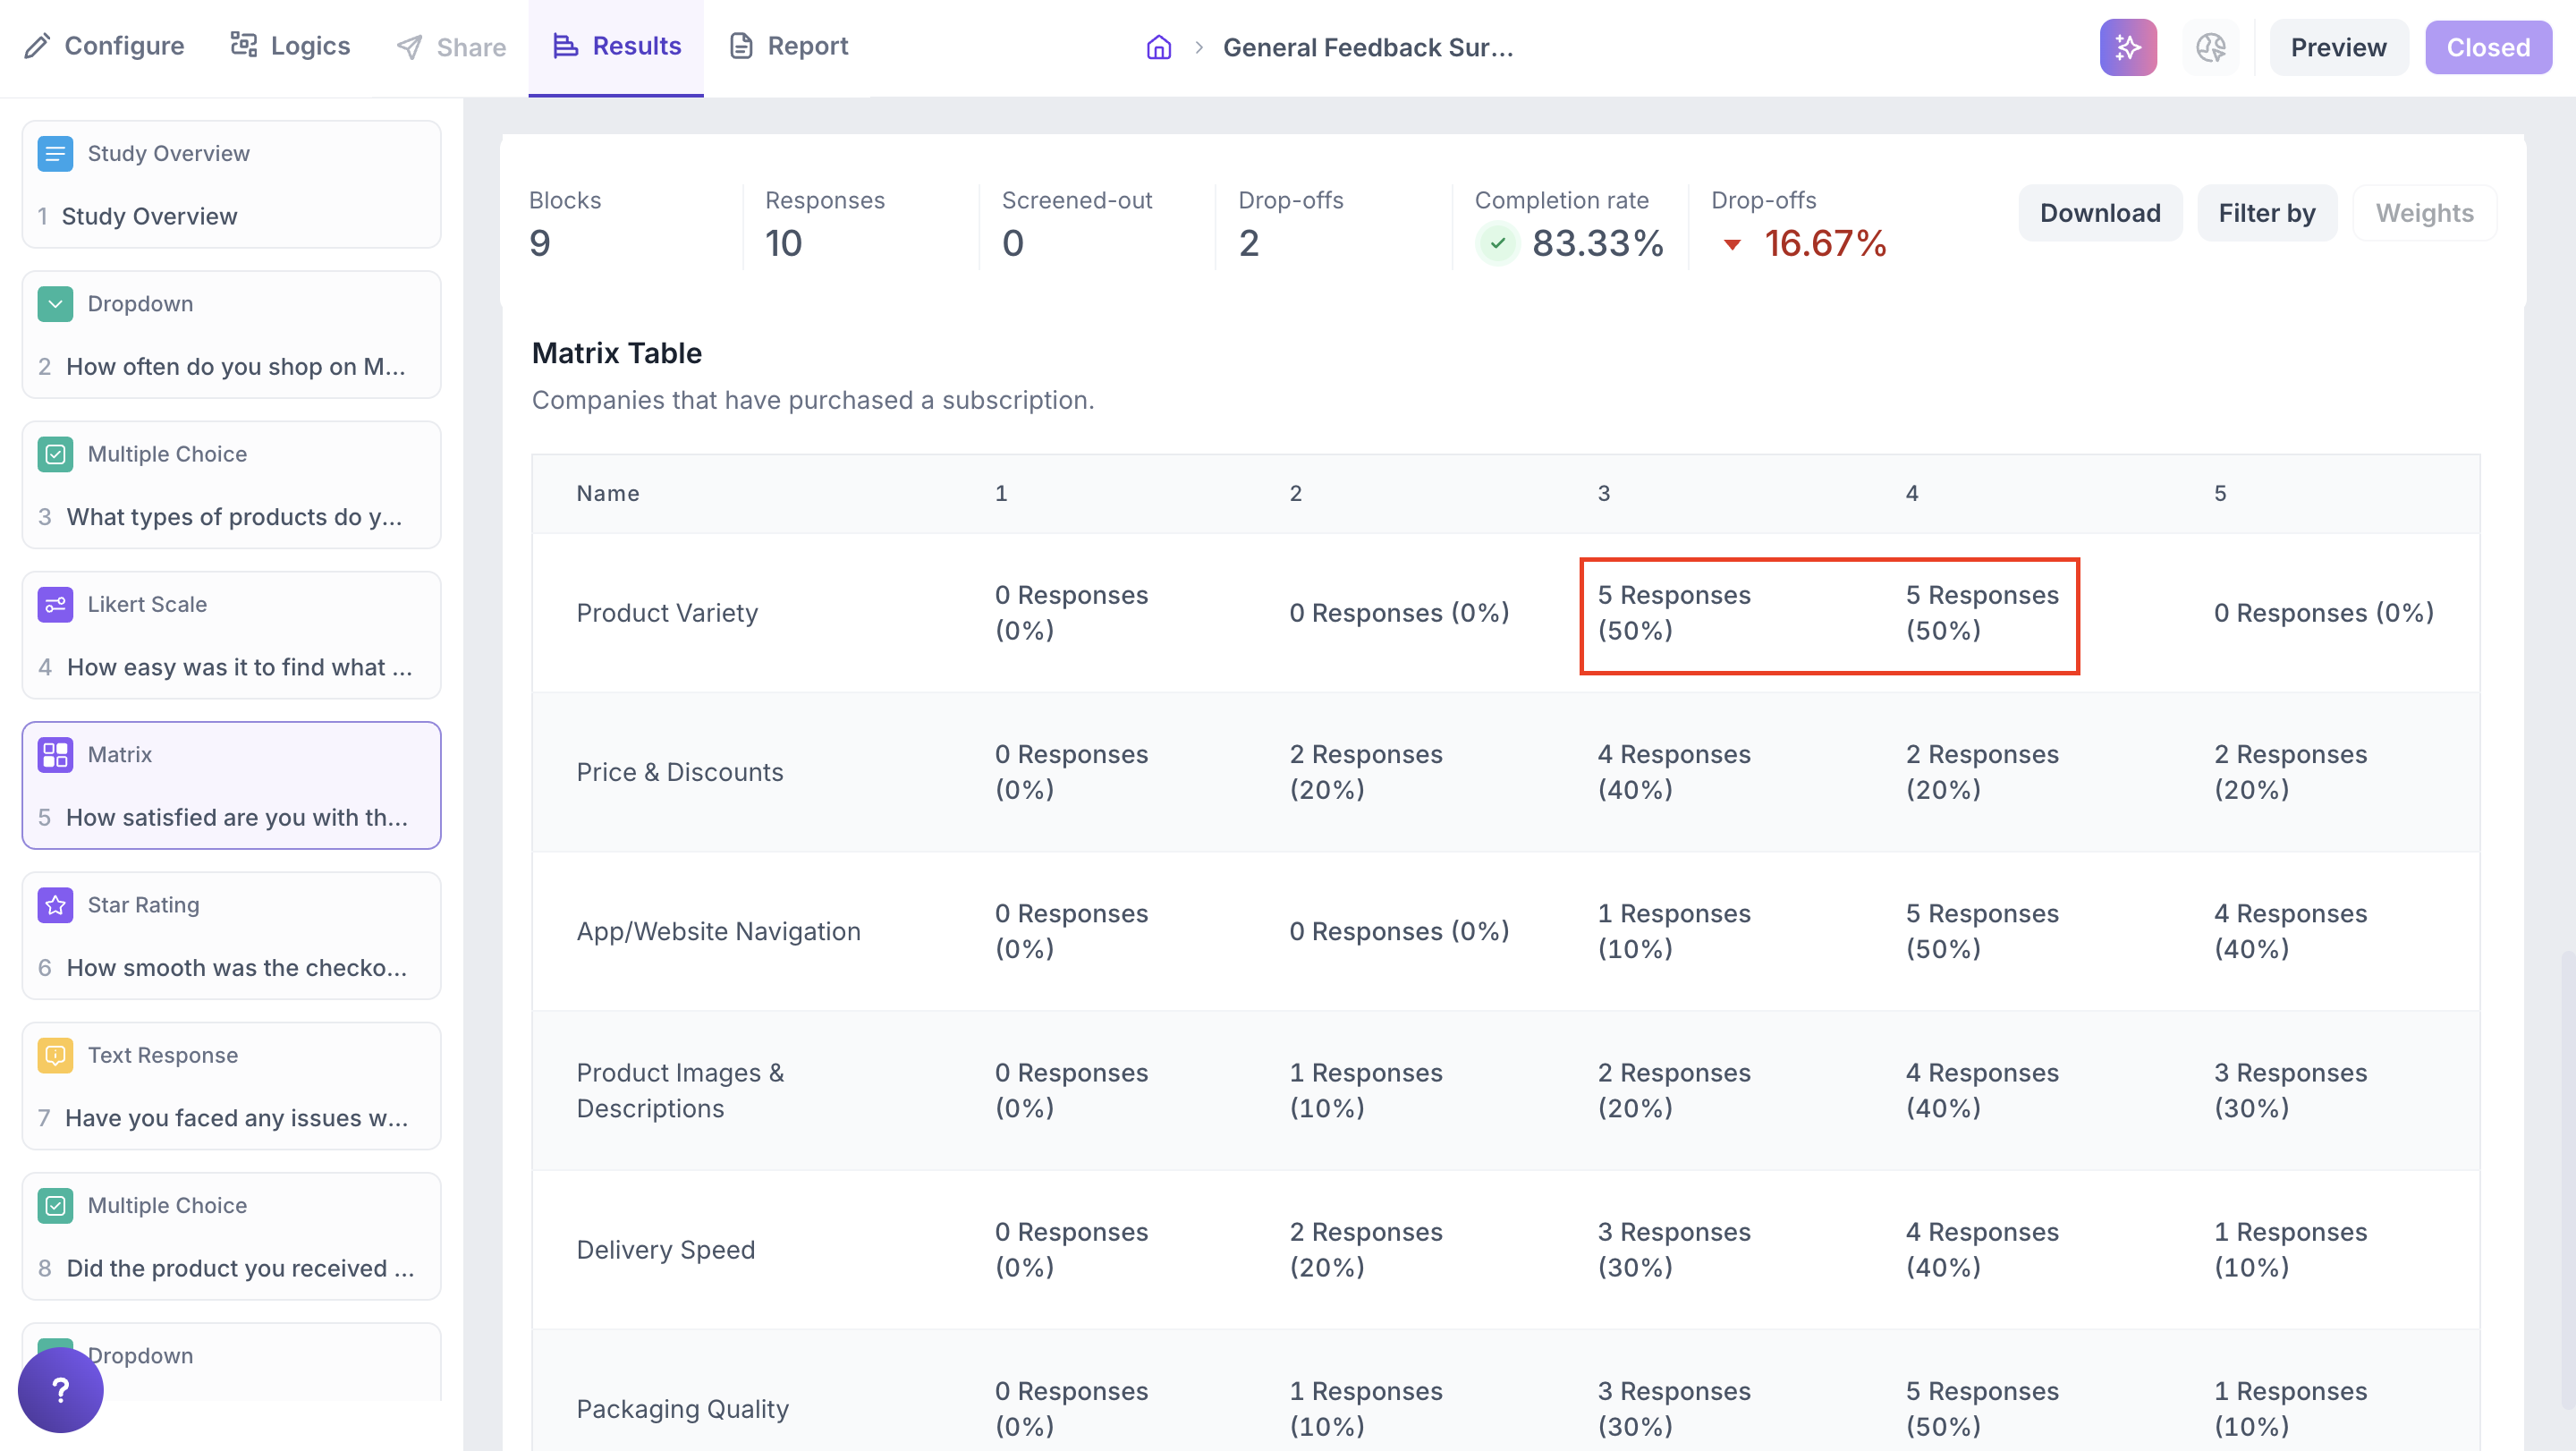
4. Matrix Table View
Below the graph, a detailed table displays the full response data. Each row is an item and each column is a scale point. Each cell shows the number of responses and the percentage of total responses for that rating.