
Ad Creative Testing
Ad creative testing covers advertising assessed before it goes into market, across both static layouts and video. This article explains what to upload and which parts of the results carry the answer for advertising.
WHAT TO UPLOAD
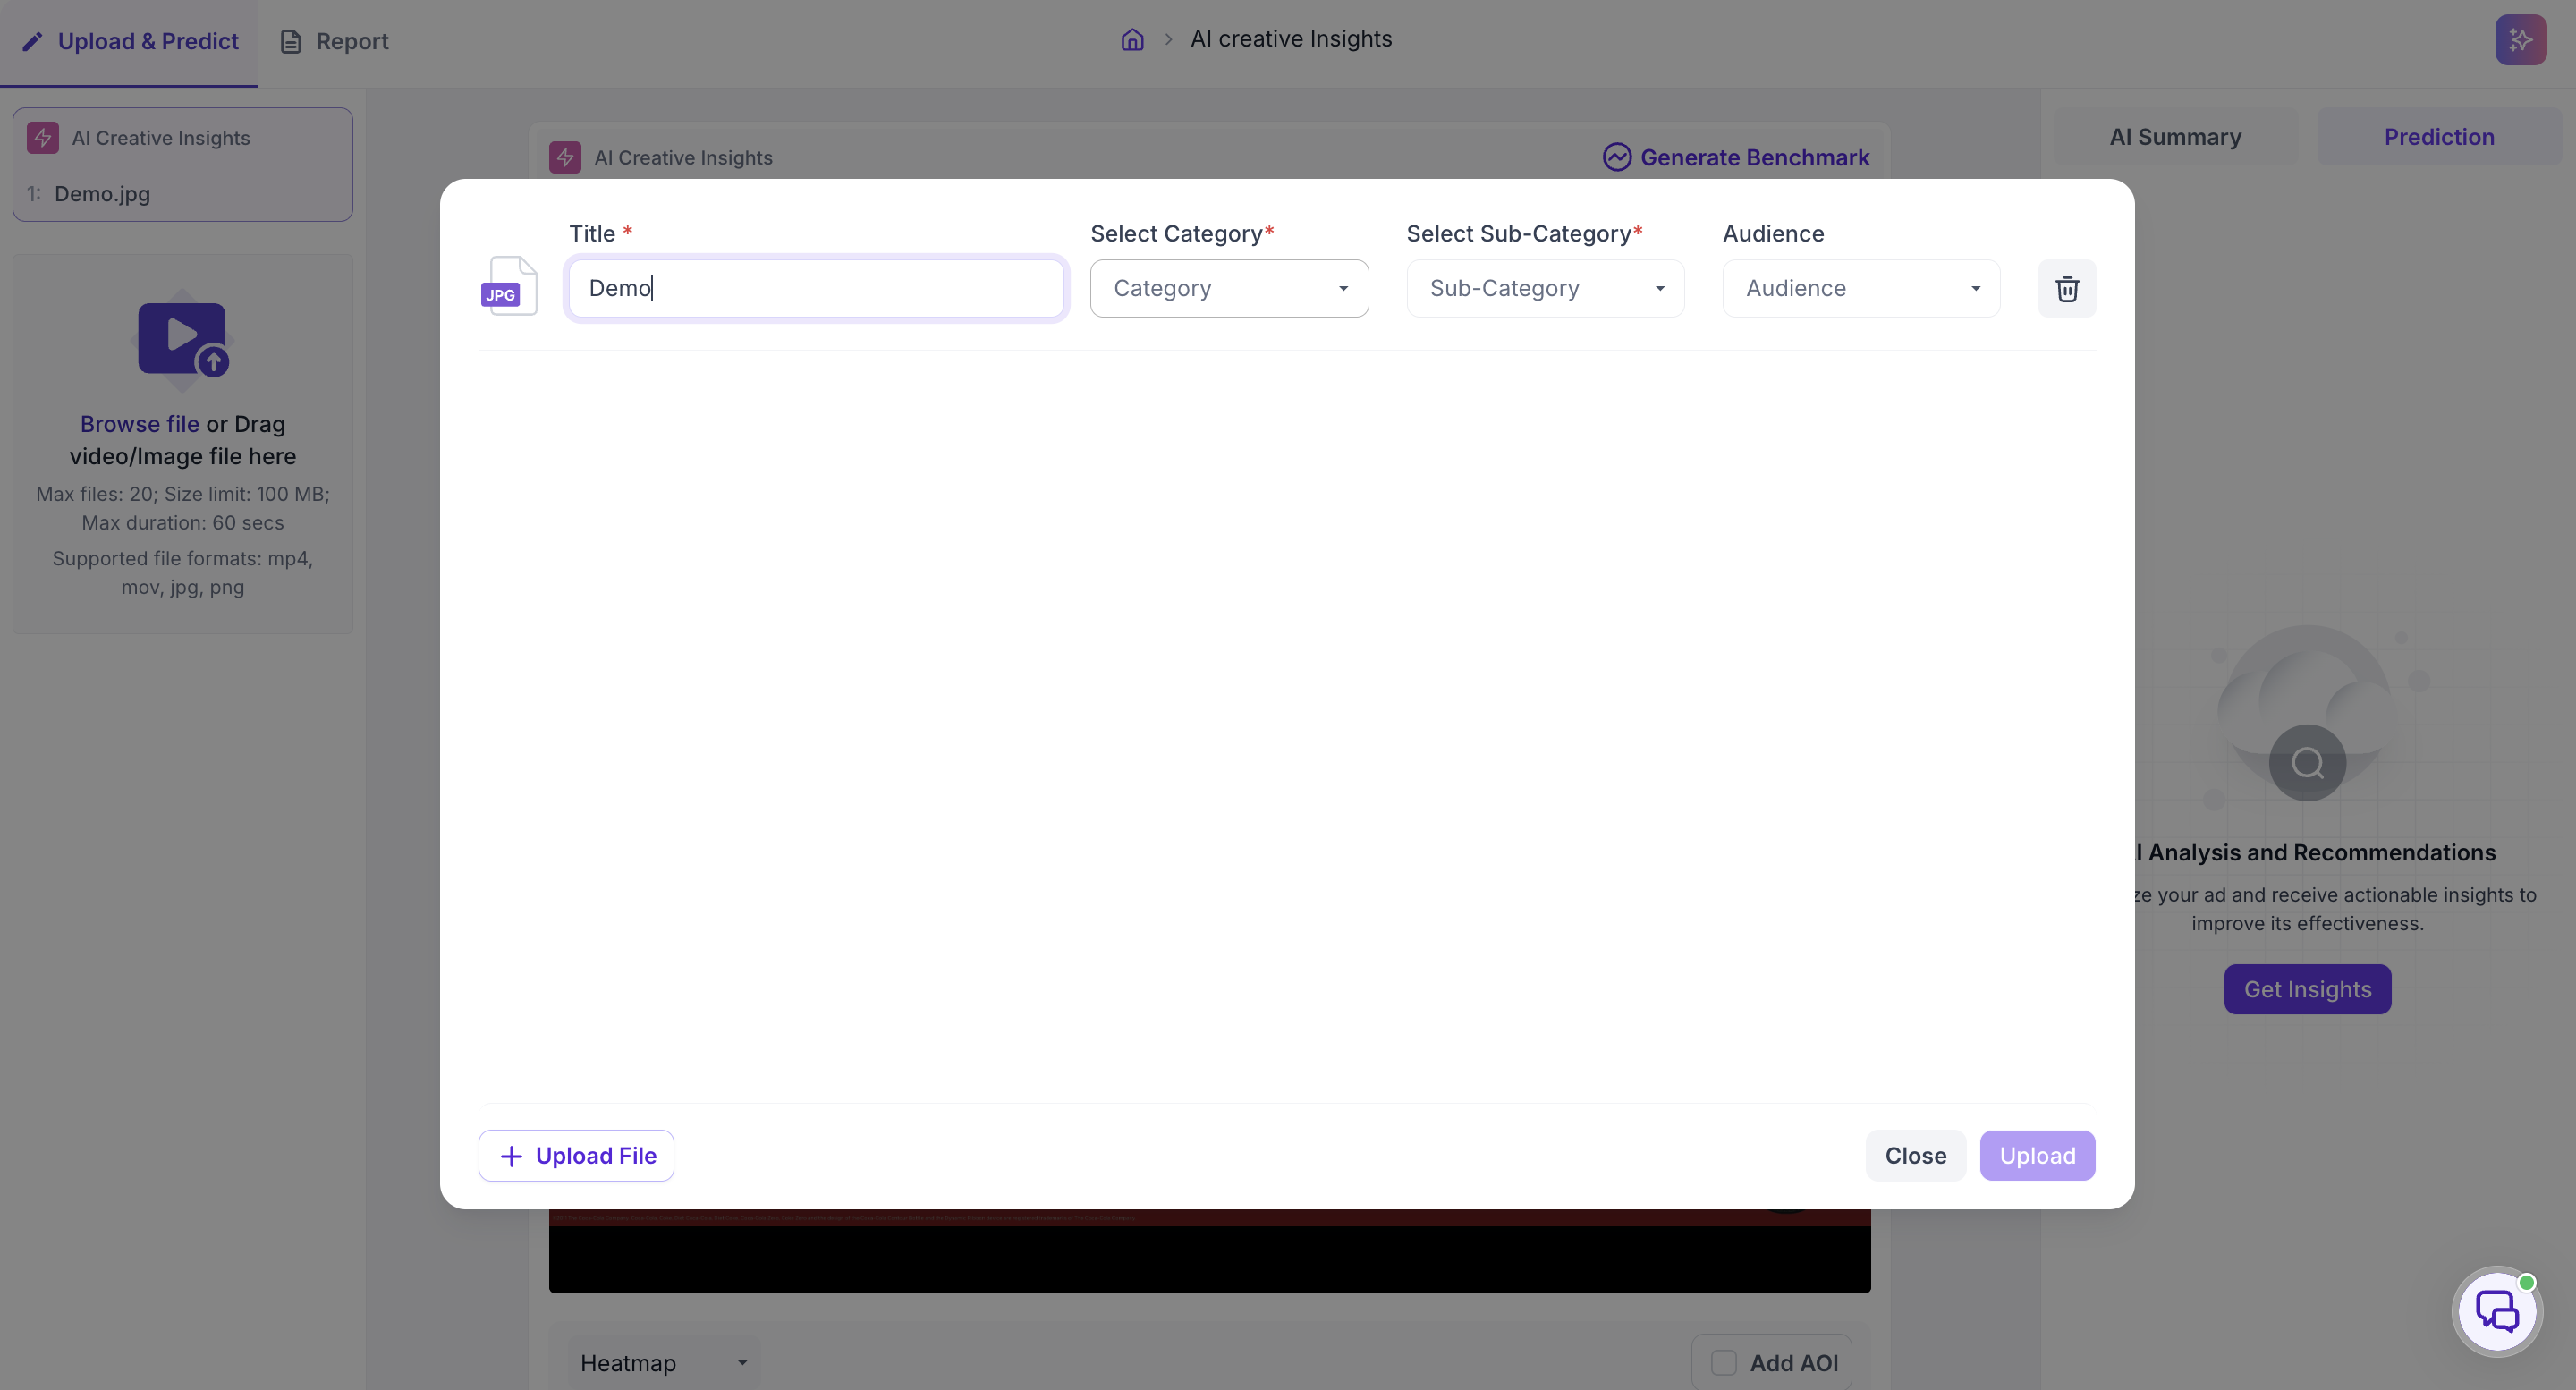
Upload the finished layout or the finished cut. Each size and each cutdown is a separate upload, since layout and pacing change between them and the results will not agree with each other.
Set the Category, Sub-Category and Type of Creative so the analysis is benchmarked against the right kind of advertising. The Benchmark Score under each metric is the average for creatives in the same category and sub category, so these selections decide what your creative is being compared against. See Generate Benchmark.
HOW TO READ IT
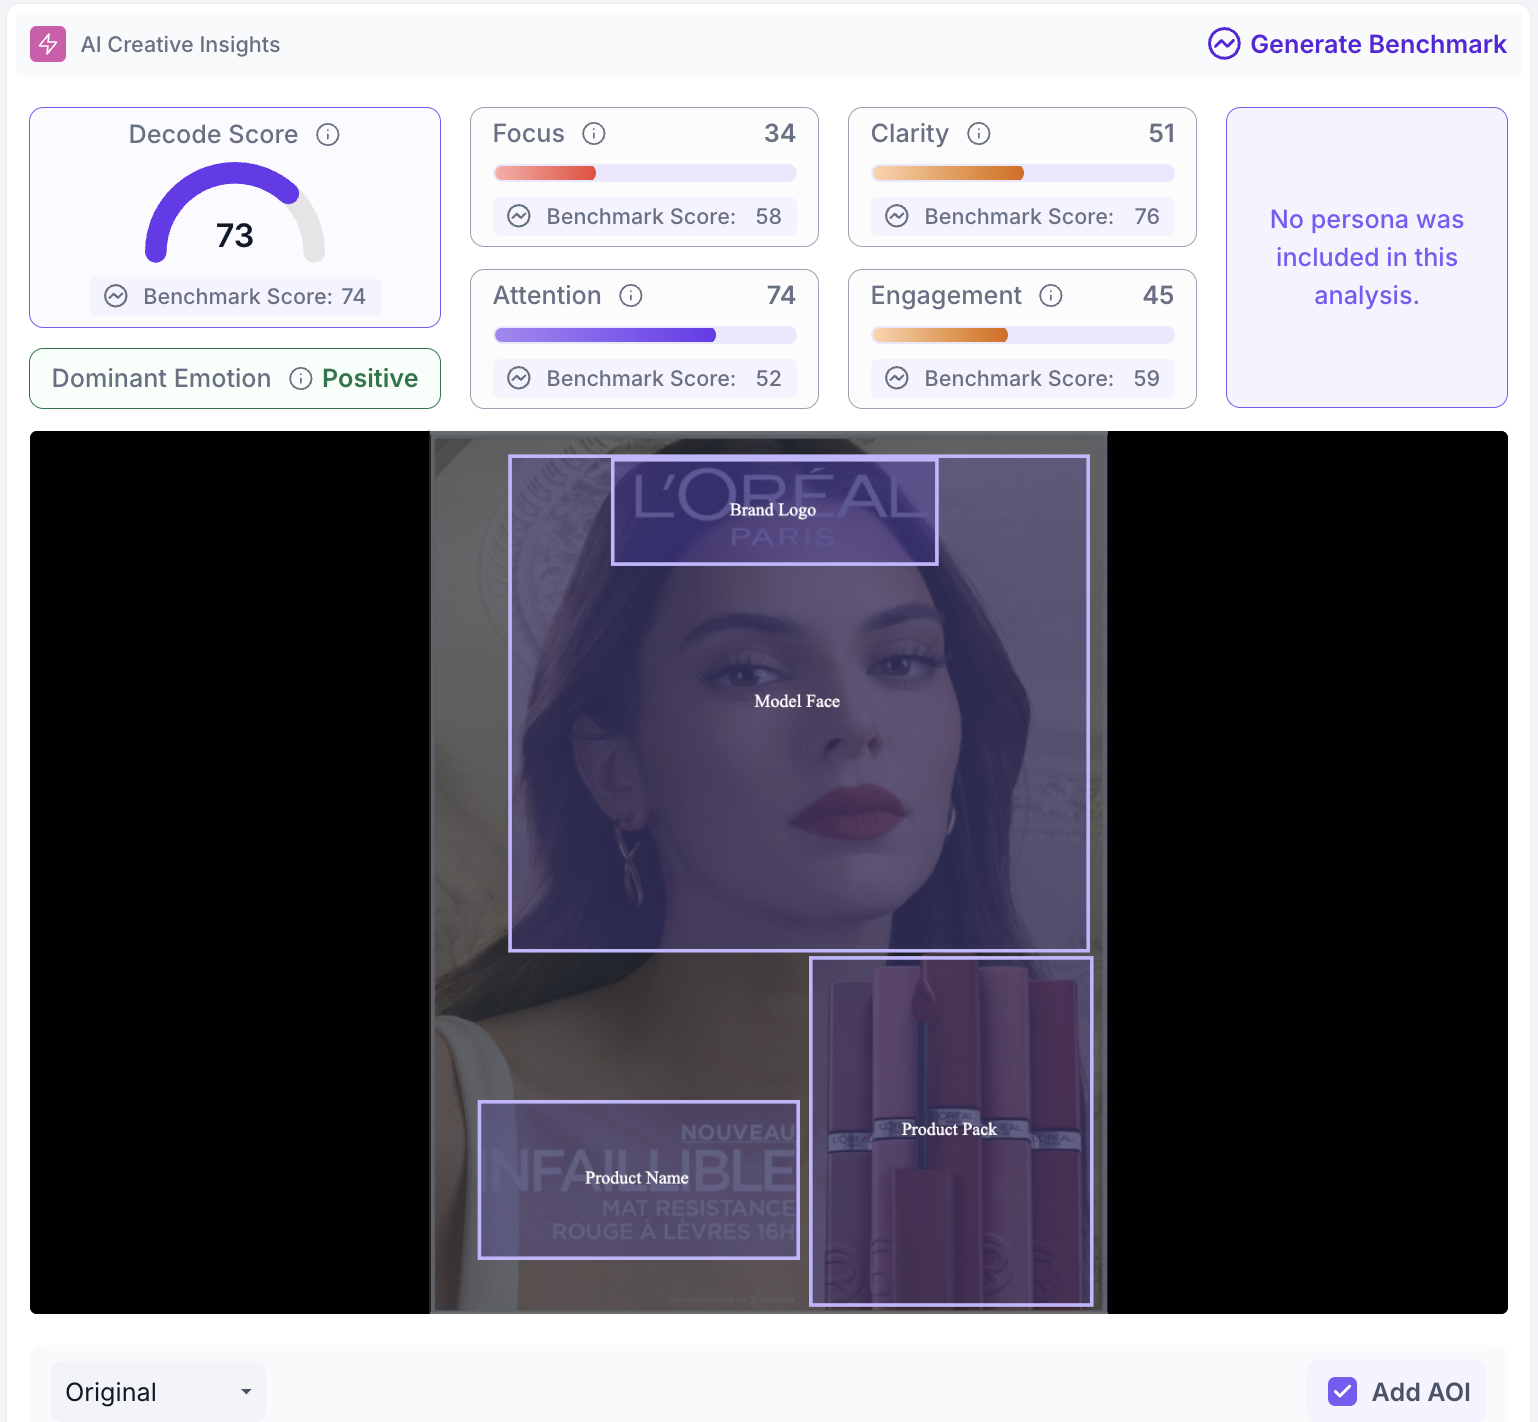
Start with the Decode Score against the benchmark to see whether the creative is performing overall, then use the individual metrics to find where it is falling short.
Attention and Engagement together answer whether the ad works. Attention tells you whether it stops the viewer. Engagement tells you whether it holds them after that. A high Attention score with a low Engagement score is an ad that gets noticed without landing its message.
Focus tells you whether attention is reaching the brand and the call to action rather than the imagery around them. Where Focus is below the benchmark, switch the visual view to Heatmap to see where attention has gone instead.
Check Dominant Emotion against the tone the campaign was built for. An ad intended to feel reassuring that predicts a different dominant emotion needs revisiting regardless of how the other scores read.
READ IT WITH AREA OF INTEREST
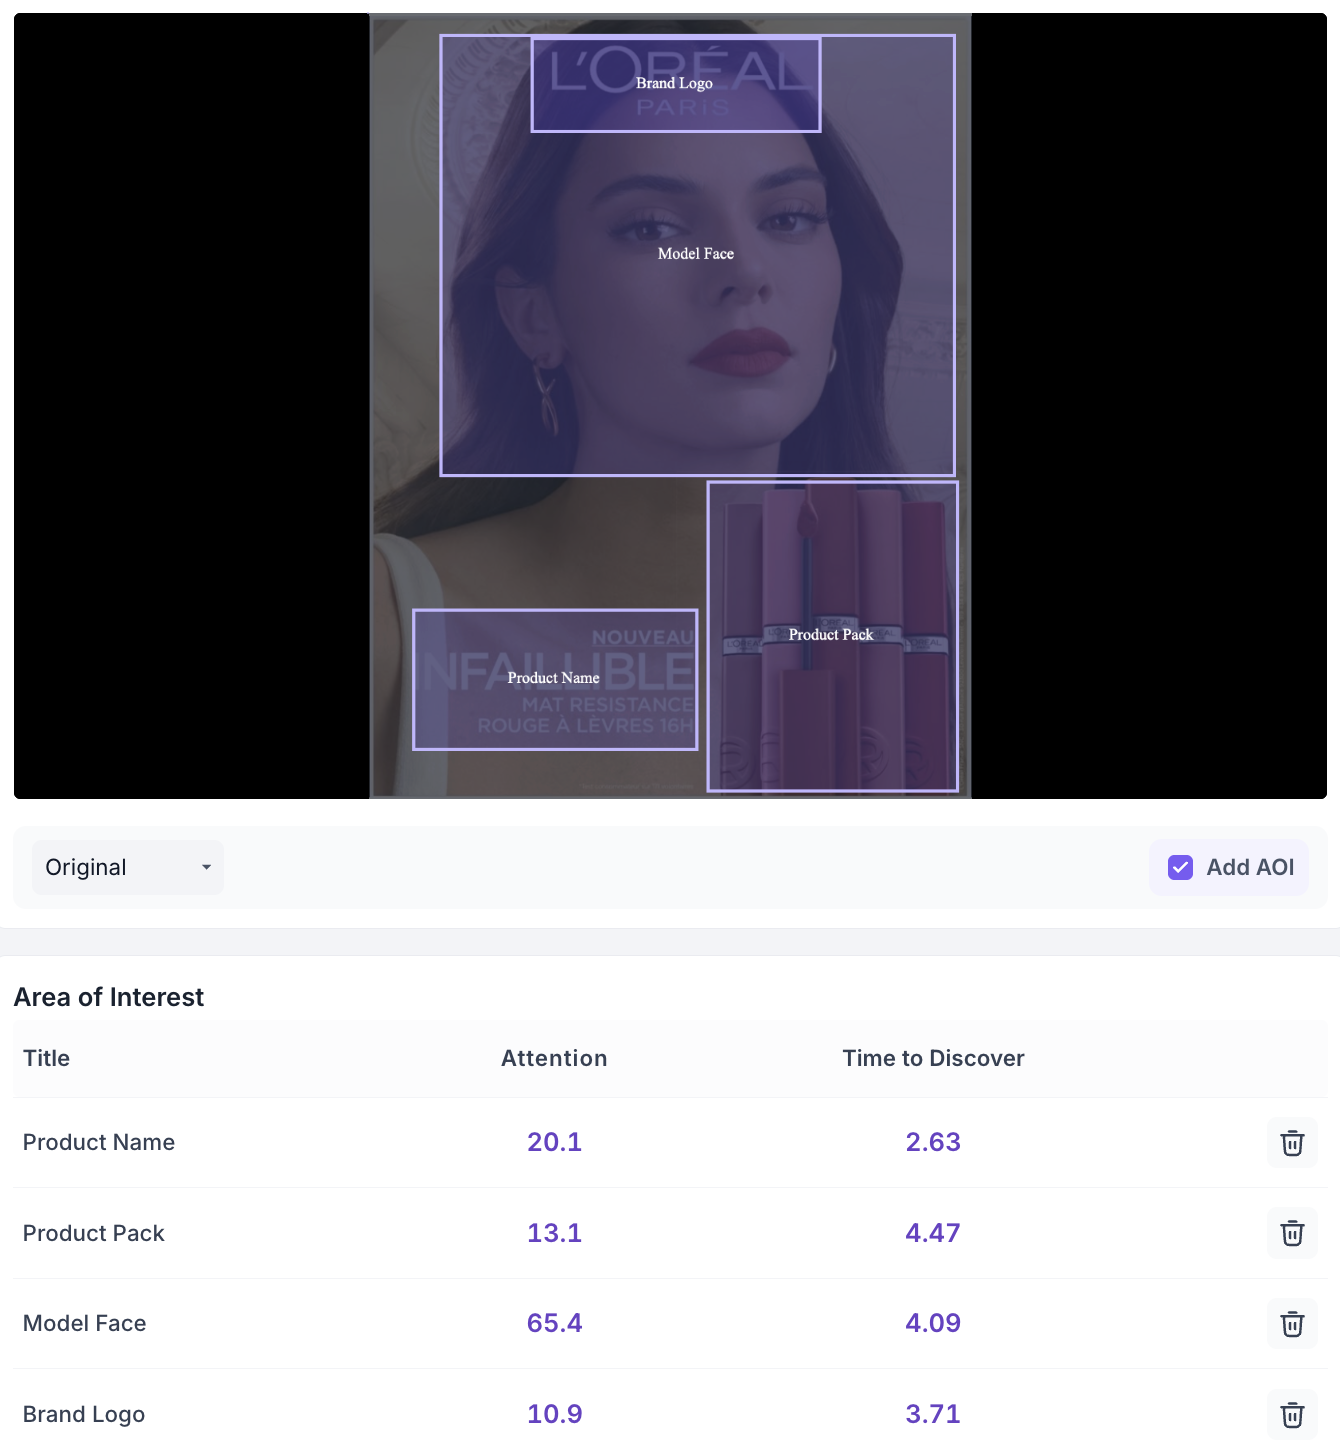
On advertising, the brand and the call to action usually carry the whole question, so mark both as areas of interest to get figures rather than an impression.
Time to Discover on the call to action matters most where the exposure is short. On a display ad or a social post, a CTA found after several seconds will not be found at all. See Time to Discover.
FOR VIDEO ADS
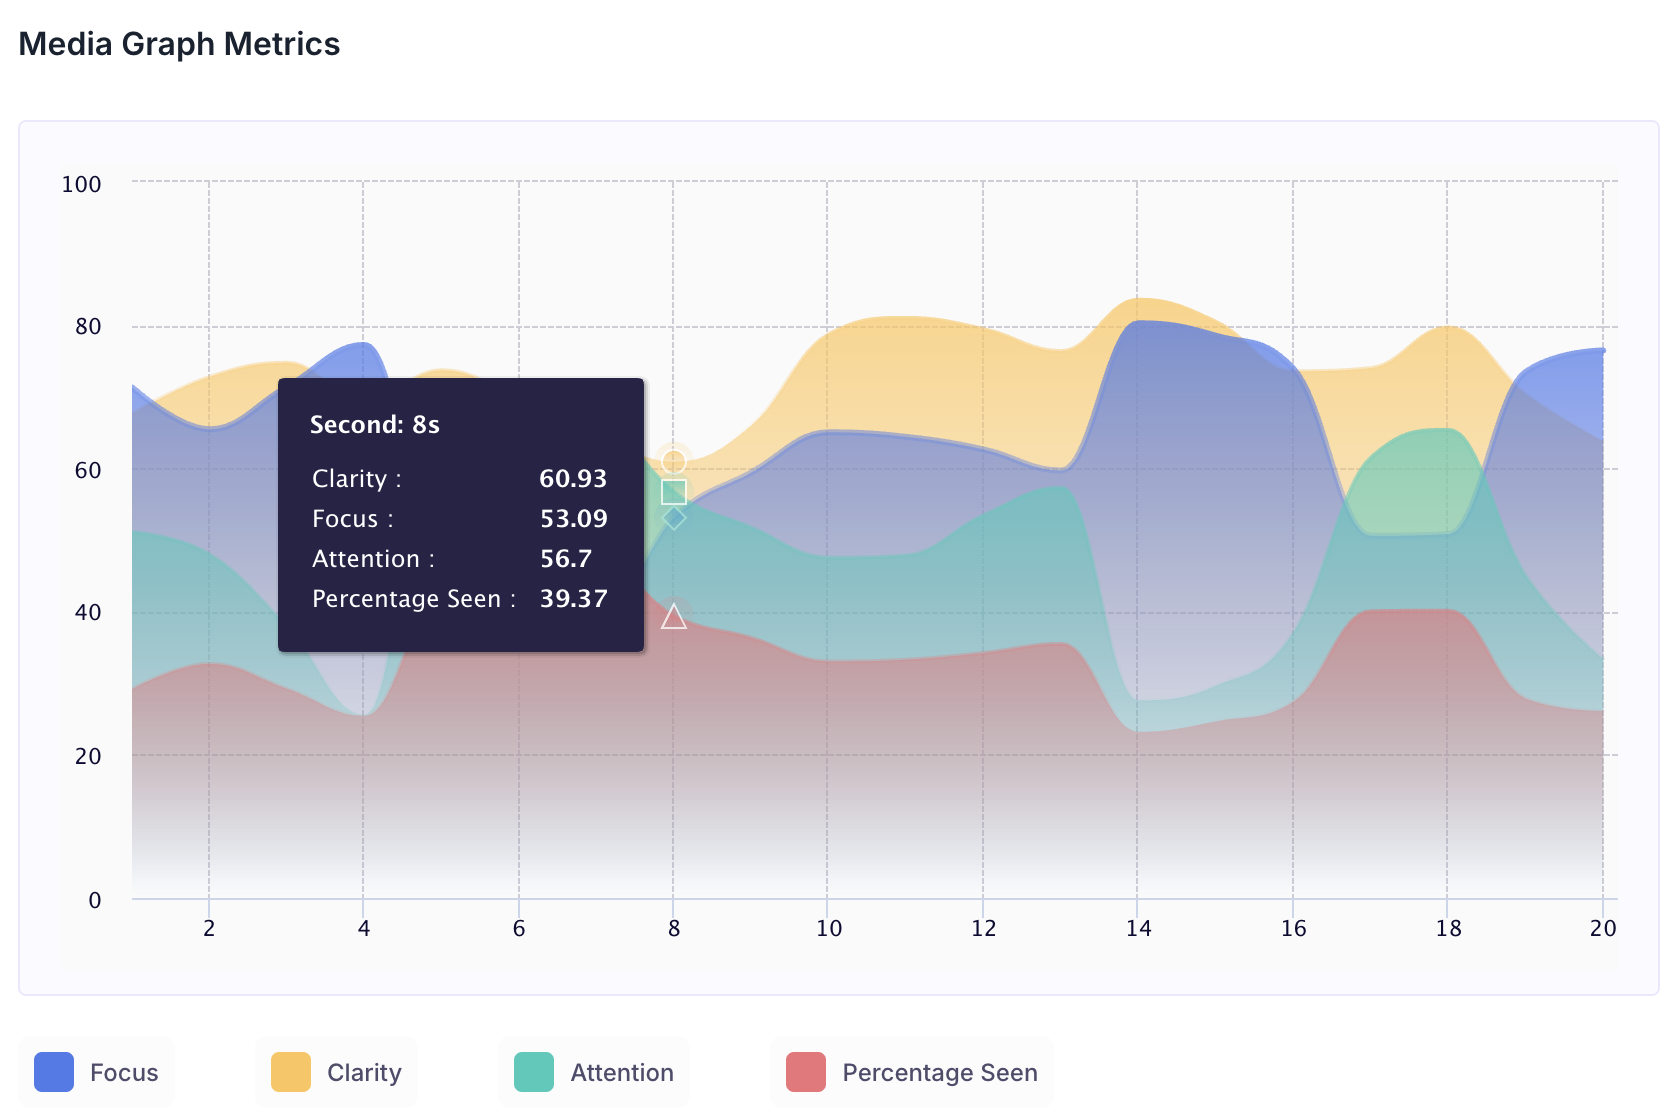
A video creative also produces the Media Graph Metrics chart, which plots Focus, Clarity, Attention and Percentage Seen for every second of the cut.
Use it to find which part of the film is underperforming rather than judging the ad as a whole. Check where your brand moment, product shot and end frame sit against the shape of the lines. A brand reveal placed in a stretch where Focus and Attention are falling is a scheduling decision rather than a design one. See Video creative analysis.
COMPARING EXECUTIONS
To choose between executions, upload each one and assess them all against the same objective with the same areas of interest marked. See A/B creative testing using predictive AI.