
AI Insights
AI Insights is available on each block in your Results tab. It reads the data for that block and returns the main finding, the evidence behind it, the trends in the data, and a recommended next step. This article explains what each section shows and how to use it.
OPENING AI INSIGHTS
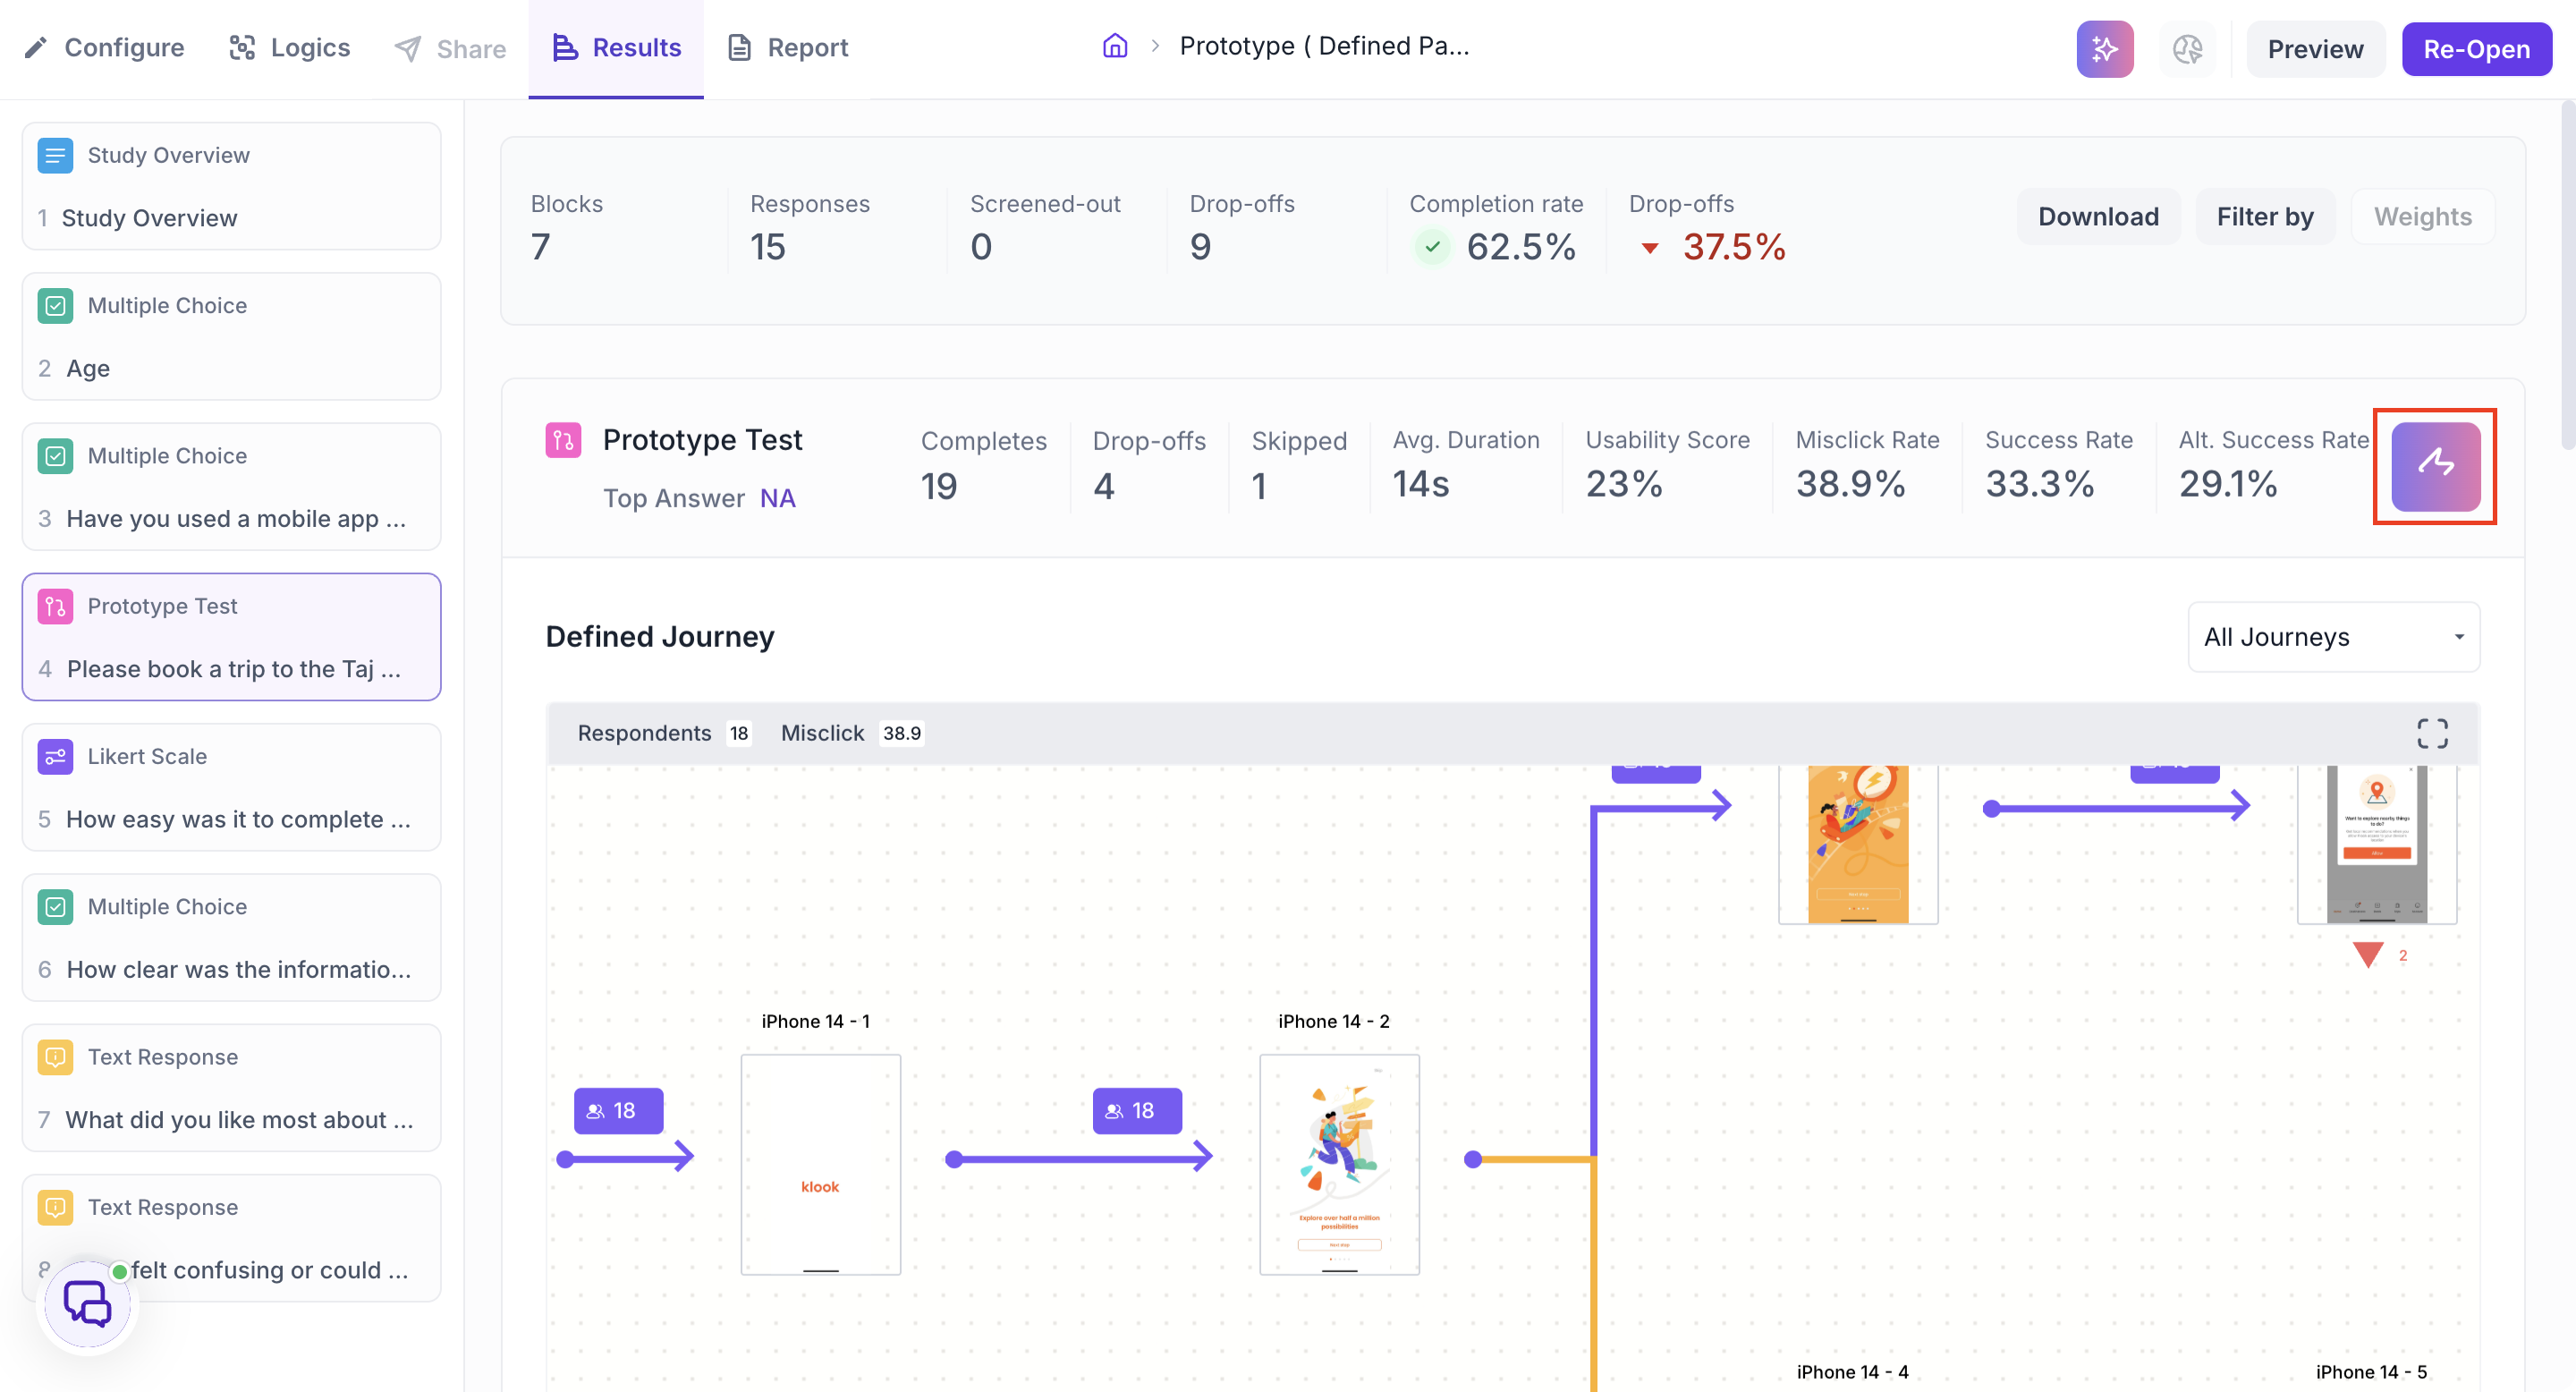
Go to the Results tab and select a block from the left panel, then open AI Insights.
The panel header shows the block type and the block itself, so you can confirm which part of the study is being analysed.
THE HEADLINE FINDING
At the top of the panel is a single sentence stating what the data shows for this block.
This is the conclusion. Everything below it is the evidence behind that statement and what to do about it.
KEY RESPONSE
The headline figures for the block: the Top Answer, Total Responses and Completion Rate.
Read this alongside the headline. Total Responses tells you how many people the finding rests on, which determines how much weight to give everything else in the panel. A clear finding drawn from a small number of responses is directional rather than conclusive.
KEY FINDINGS
A written explanation of what the data shows across the block, connecting the separate measures into a single account.
Where a block produces several measures, this is where they are read against each other rather than reported individually. A drop-off rate is linked to the misclick rate on the same screen. A neutral emotion signal is noted so you know which measures the analysis is actually driven by.
This is the section to read when you need to understand why the headline says what it says.
PATTERNS AND TRENDS
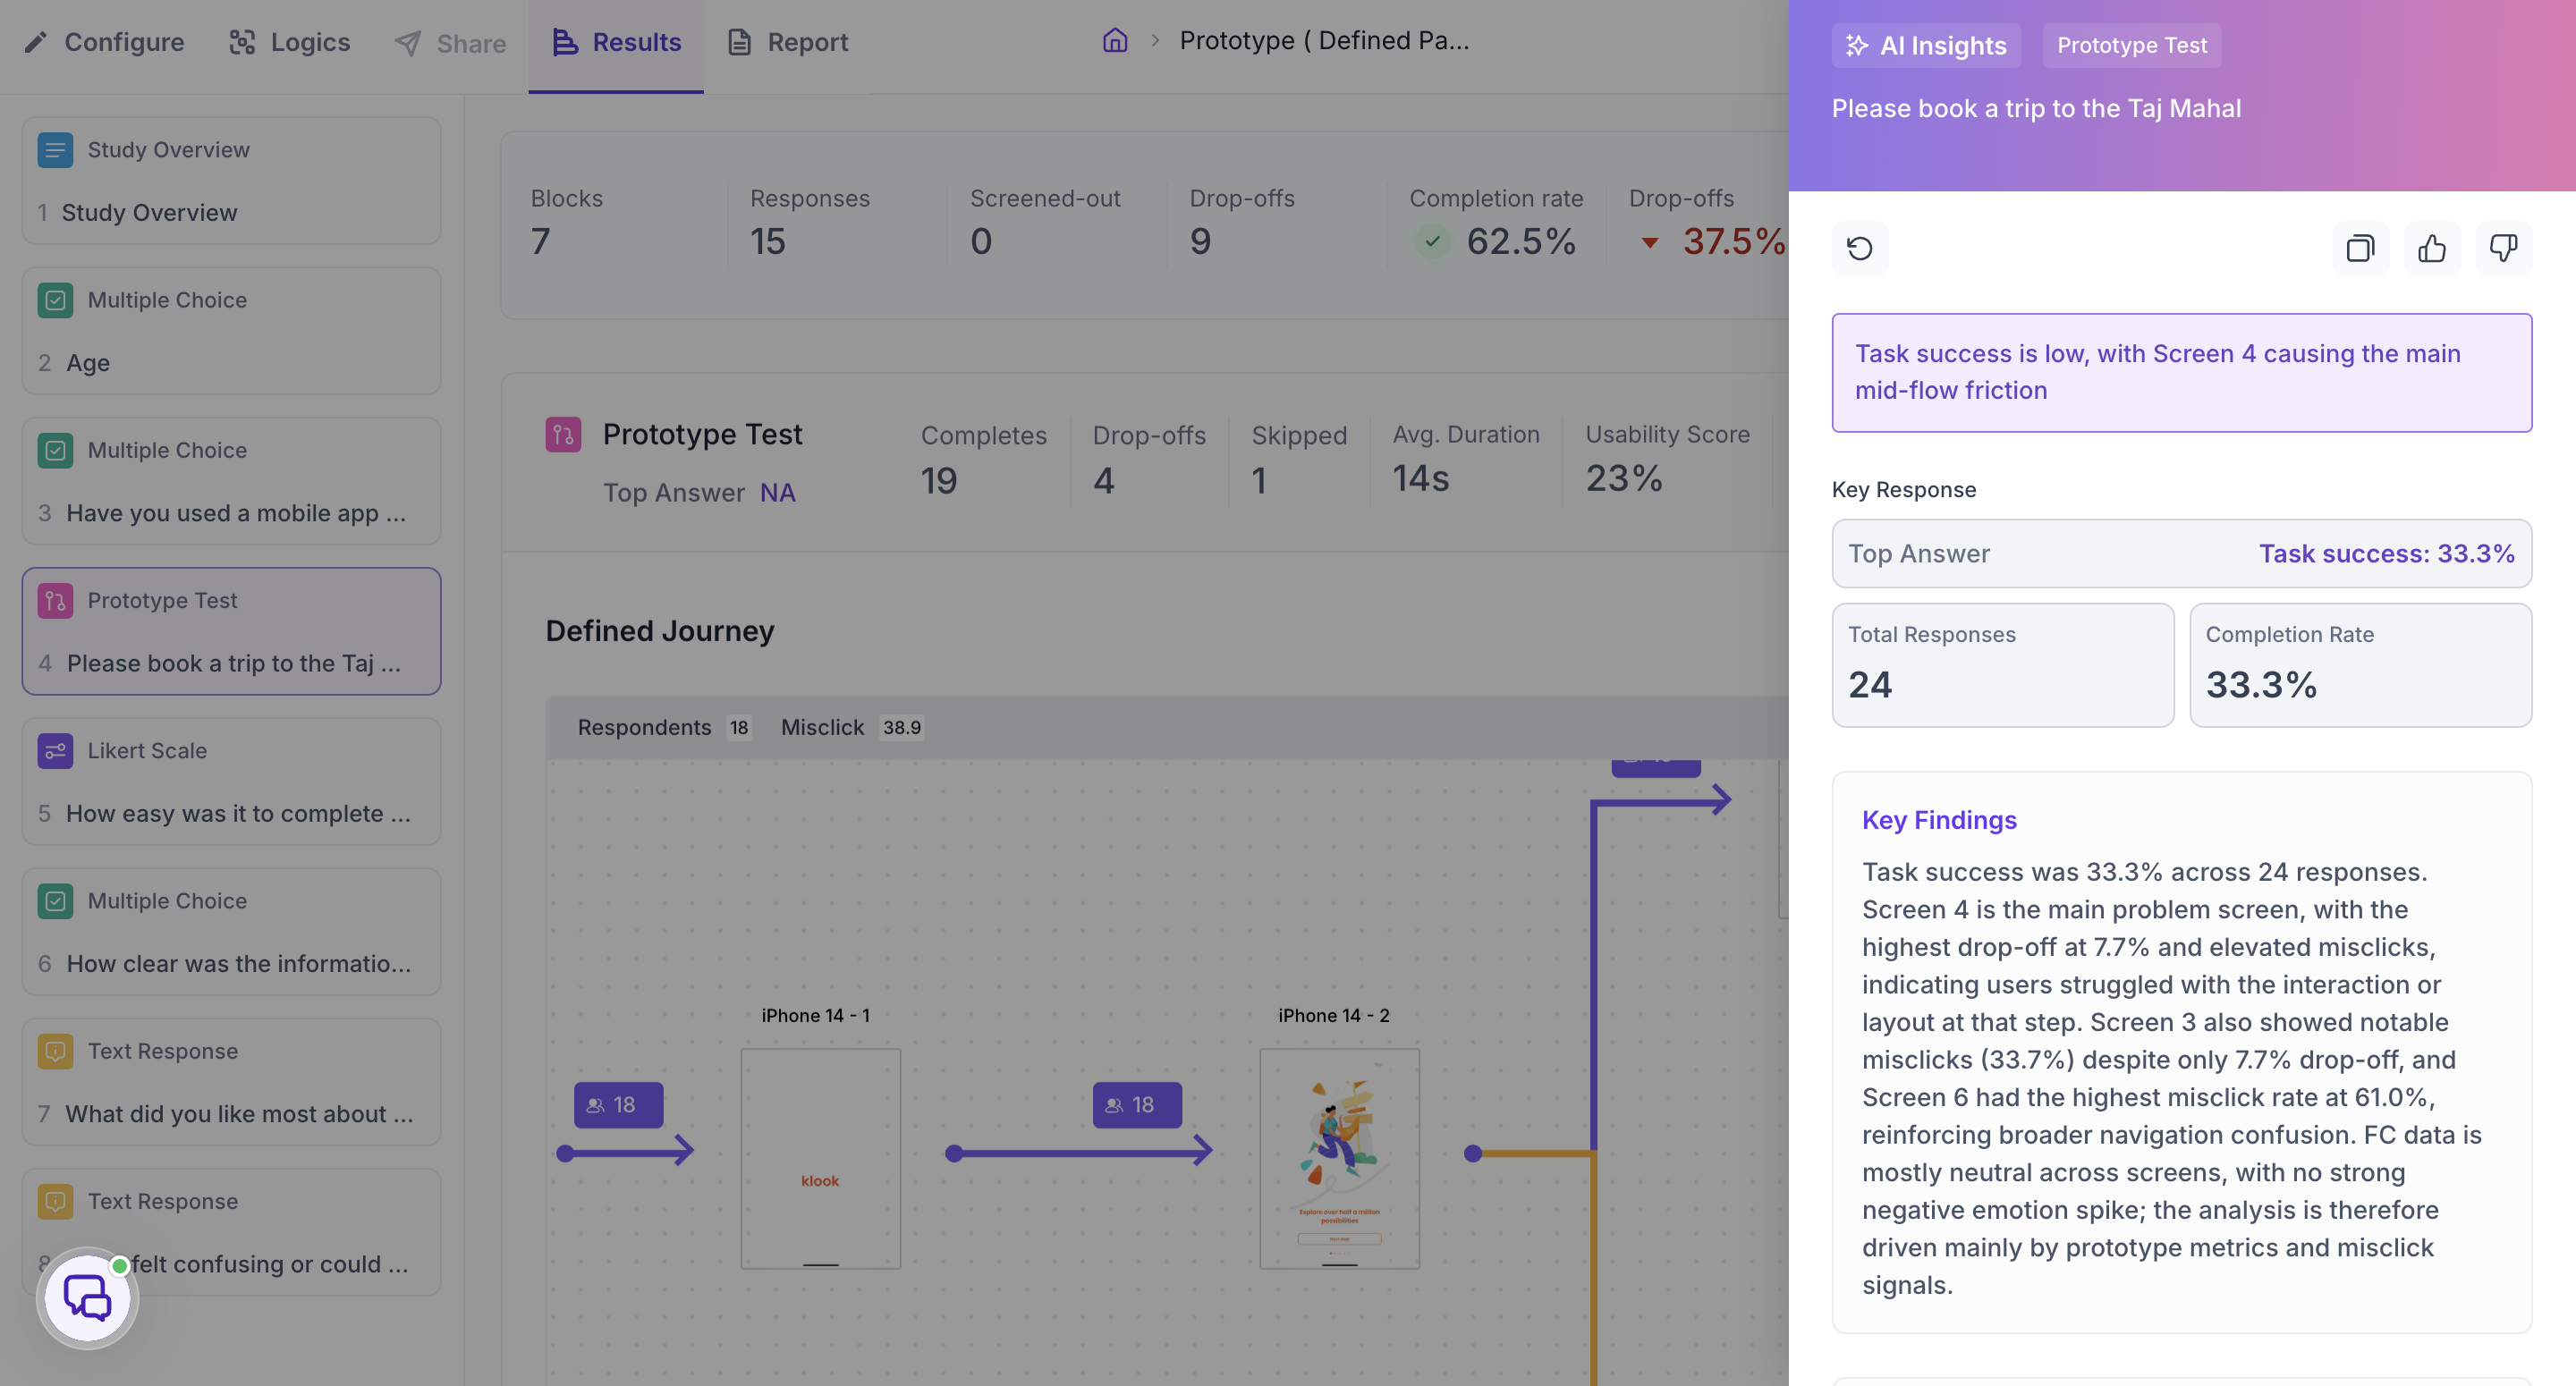
The trends identified across the data in the block, listed individually with the figures behind each one.
Each entry is marked as a positive or negative trend. A positive trend is where the data held up, such as a set of screens that all reached full completion with no drop-off. A negative trend is where it broke down, such as a screen carrying both the highest drop-off rate and elevated misclicks.
Each entry also states where in the data the trend sits, naming the screen, question or measure it relates to, so you can go back to that part of the results and check it yourself.
Read this section to see which parts of the block are working and which need attention. The headline tells you the overall finding, and this tells you where in the data that finding comes from.
SUGGESTED
The recommended next step based on everything the block shows.
This covers what to change and how, which parts of the data to examine further before deciding, and which parts to keep as they are. Where a problem has been identified, the suggestion names the specific element to address rather than the general area.
It also indicates how much confidence to place in the result, such as recommending a re-test where the finding rests on a small number of responses.
Use this as a starting point for what to do next. The suggestion is drawn from this block alone, so read it alongside the rest of your study results before acting on it.
PANEL CONTROLS
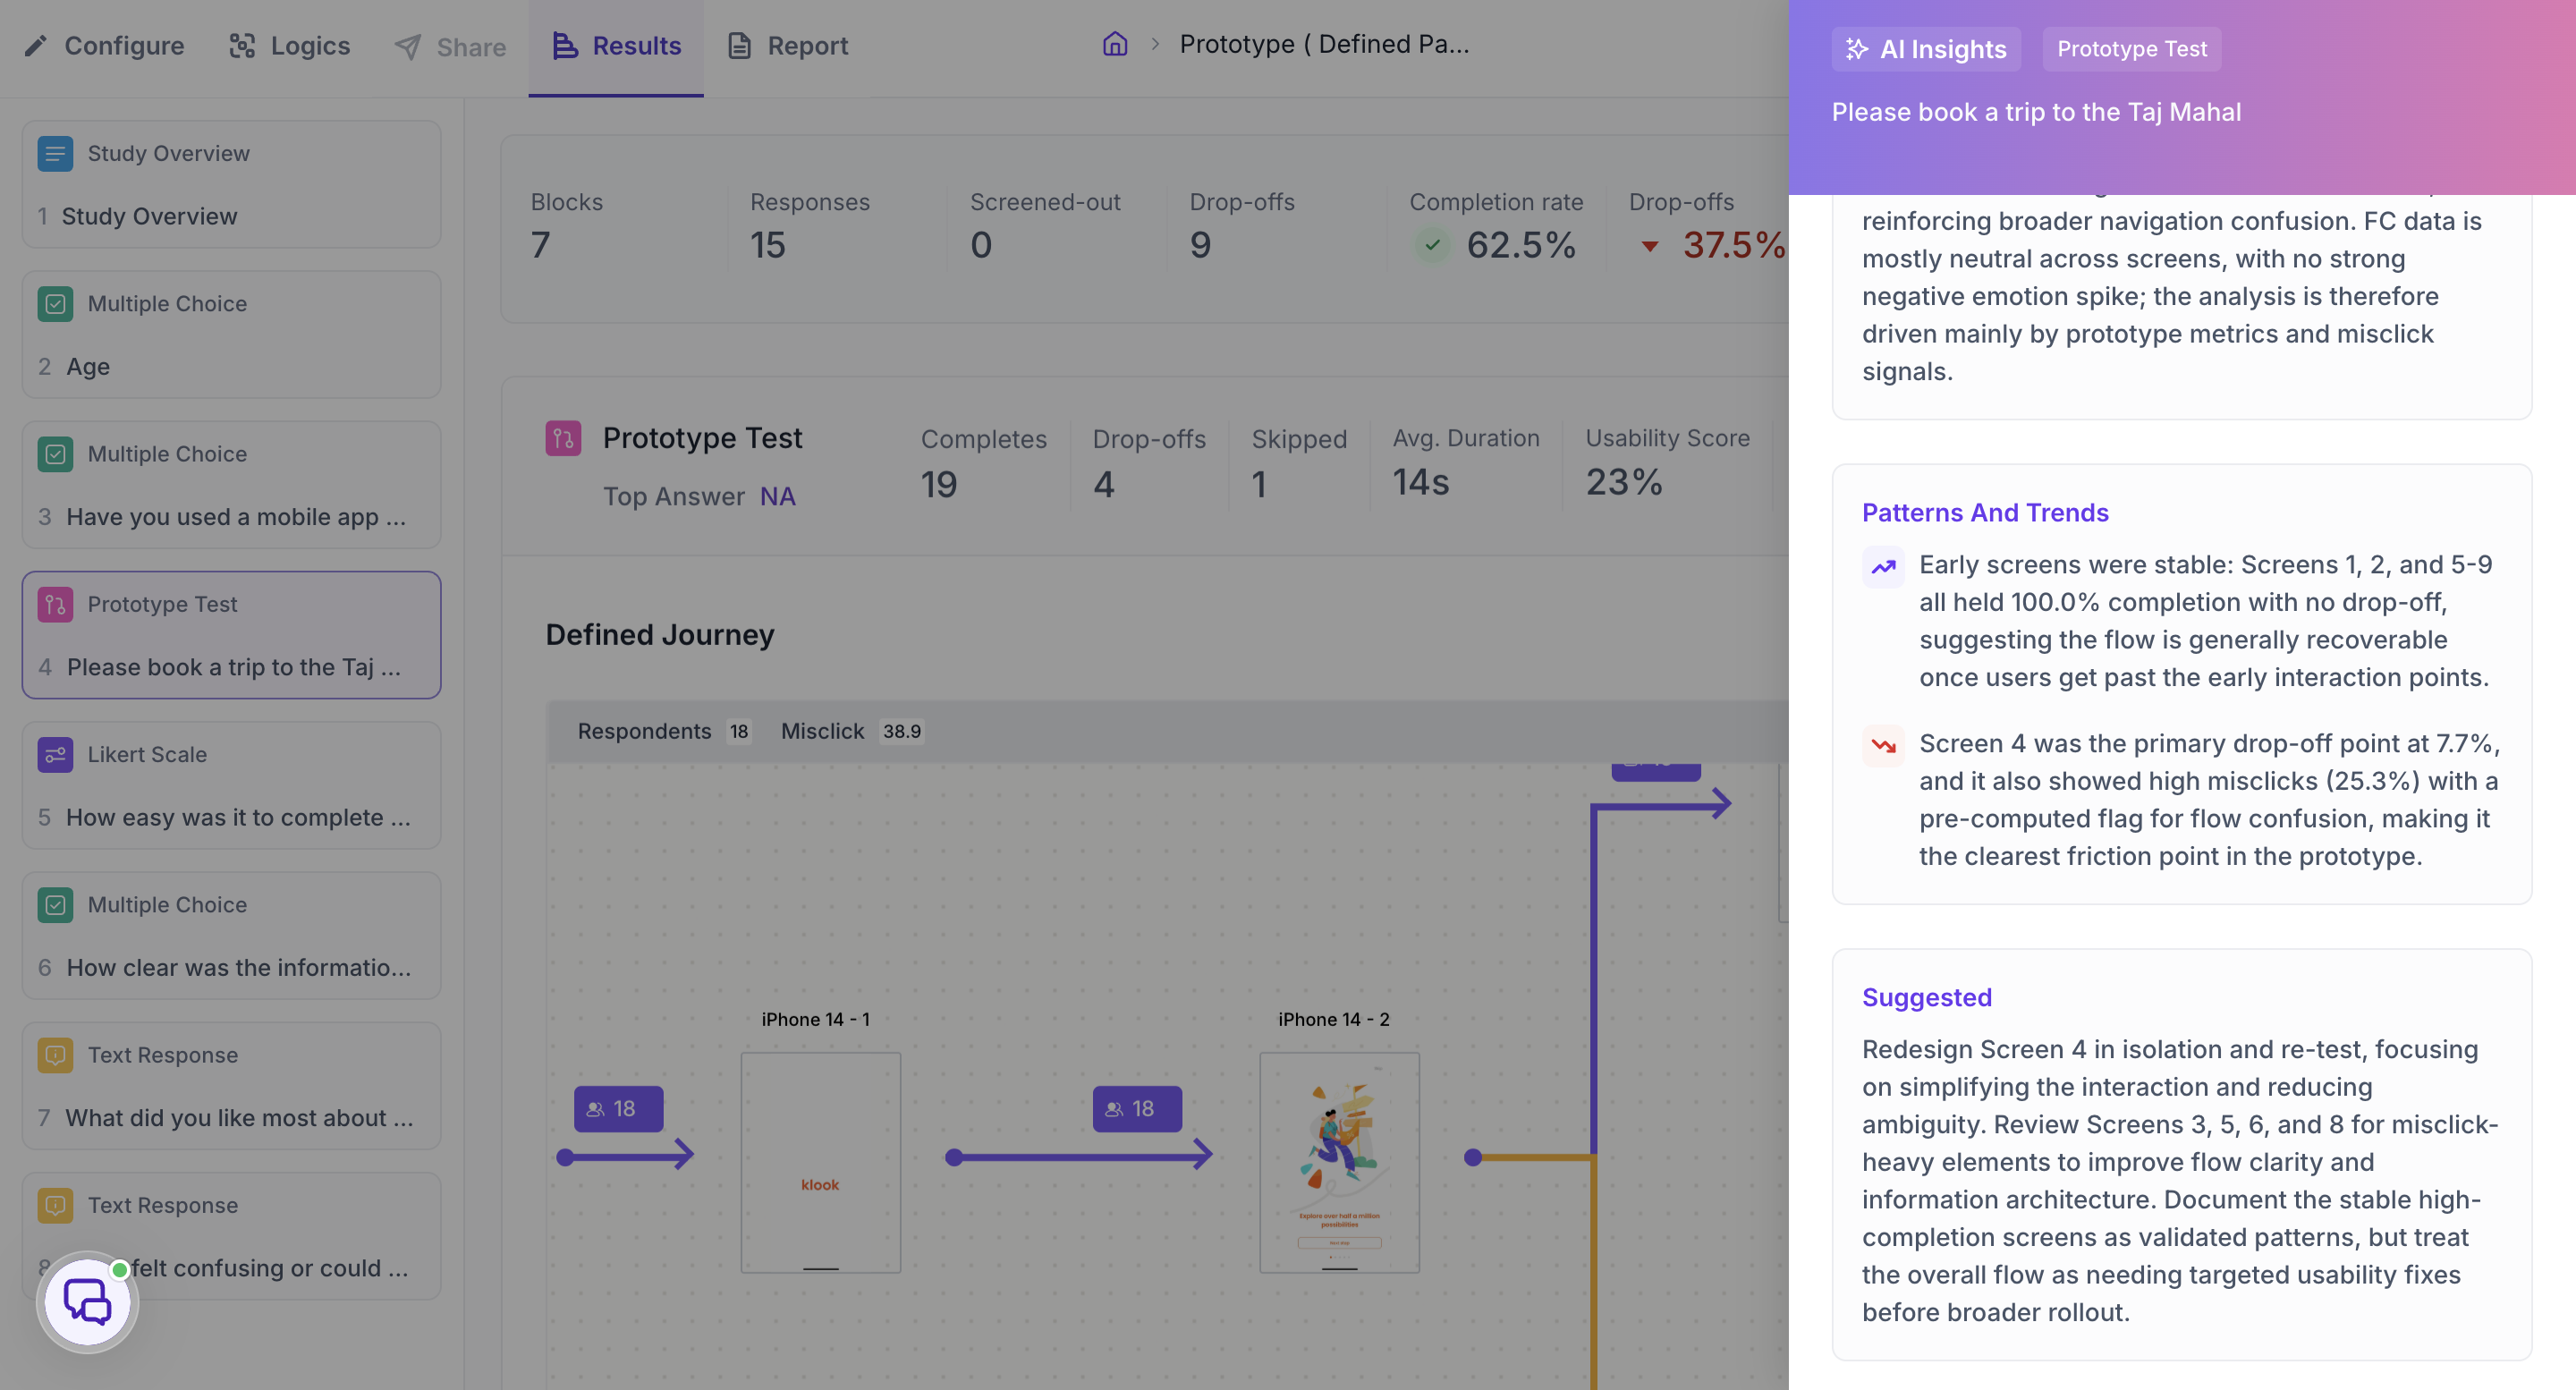
Three controls sit at the top of the panel.
Regenerate. Runs the analysis again on the same block.
Copy. Copies the insight for use in a write-up or to share with your team.
Thumbs up and thumbs down. Records whether the insight was useful. This feedback is used to improve the quality of insights over time