
Area of Interest (AOI) setup on creatives
Area of Interest lets you mark specific regions of the creative and measure how much attention each one receives. Use it when you want precise data on a particular element rather than reading the overall heatmap. This article explains how to set areas up and how to read the values.
ADDING AN AREA OF INTEREST
Click Add AOI, draw a region on the creative, give it a name, and select the AOI type that best describes the element. The available types are Branding, Product, CTA, Headline and Body Text.
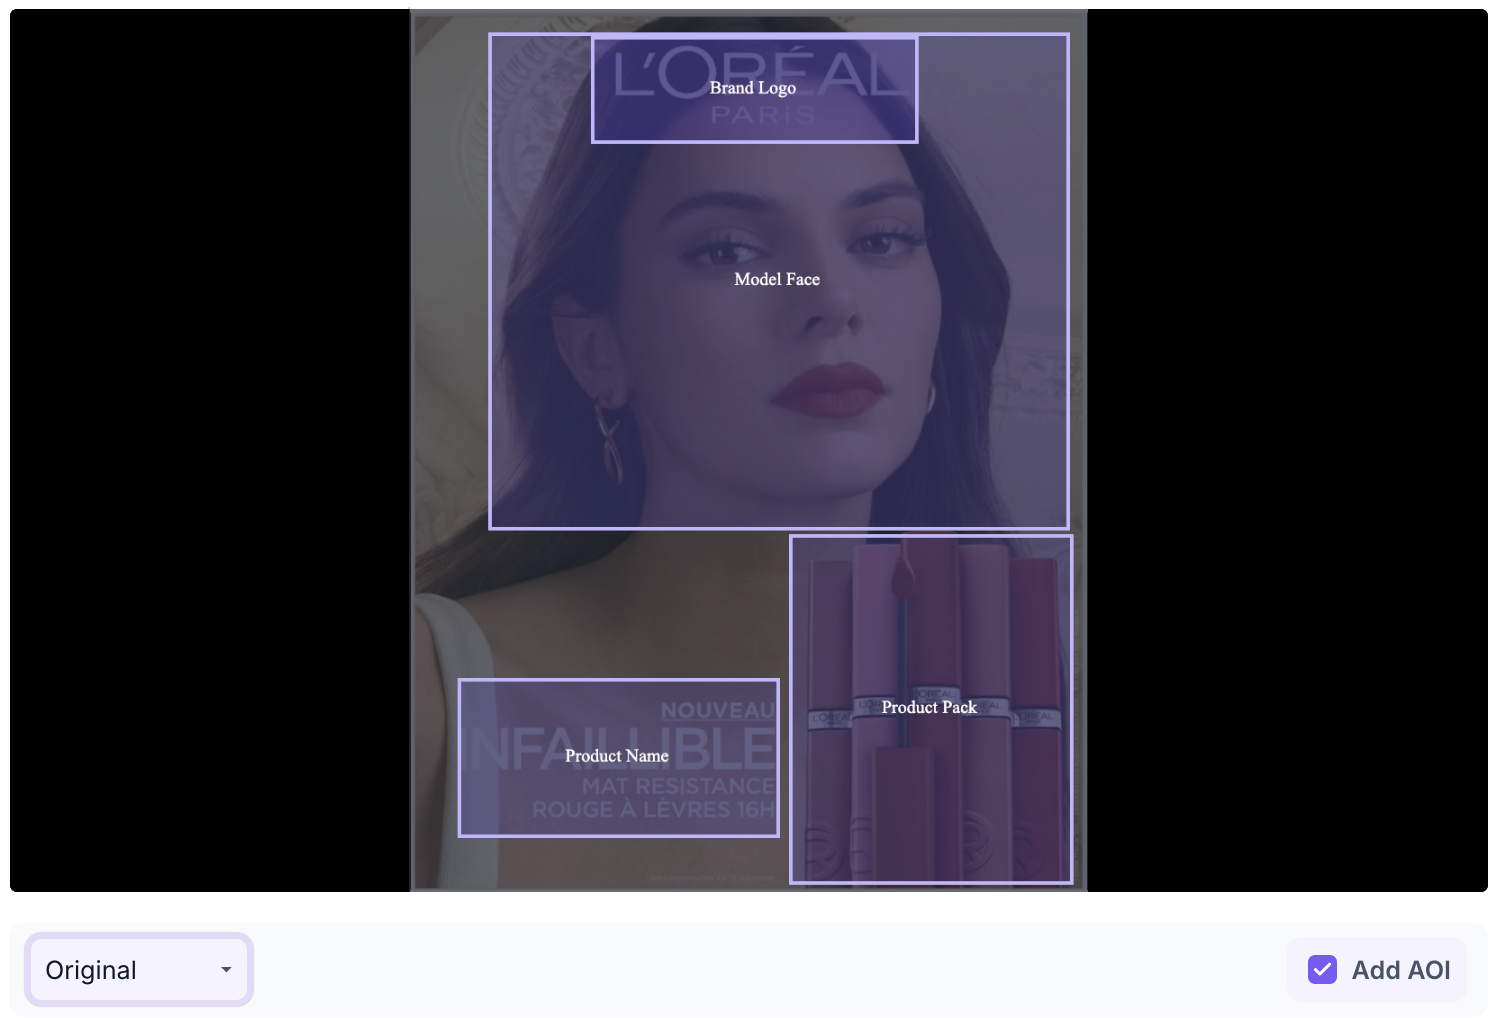
Mark one element per region. A region drawn around a logo and a headline together returns a single set of values covering both, and the two cannot be separated afterwards. Keep each region close to the element, since a generous box around a small logo pulls in the space around it and weakens the reading. When you are comparing versions of a creative, mark the same elements with the same types on each one so the values line up.
HOW TO READ IT
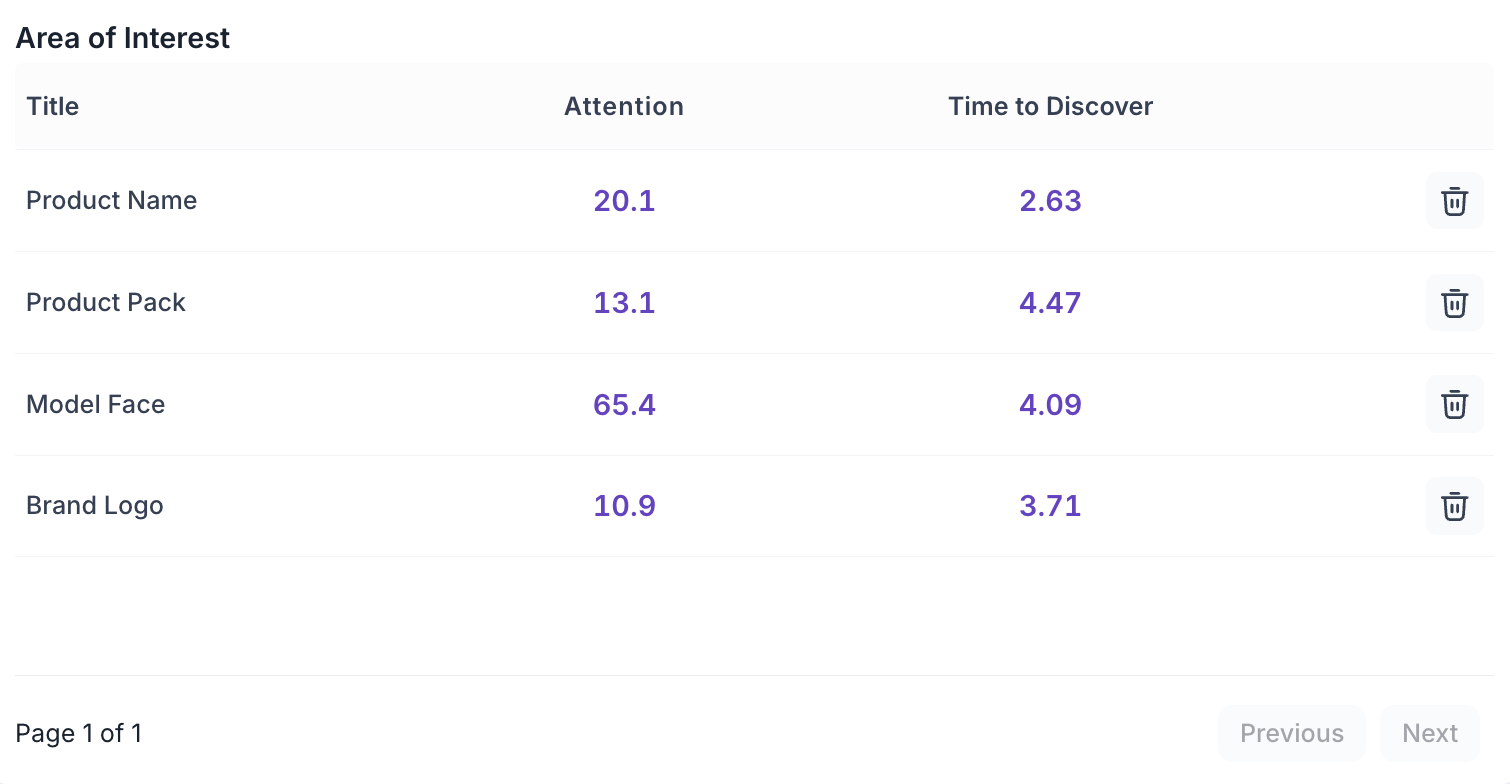
Each area you add shows two values. Time to Discover is how many seconds it takes for a viewer to first notice that area. Attention is the percentage of total viewing time spent looking at that area after it has been noticed.
Read the two together. An area can hold a high share of attention once it has been noticed and still take a long time to be discovered, which points to where the element sits in the layout rather than how it is designed.
READ IT WITH THE HEATMAP AND FOGMAP
The maps show the pattern across the whole creative. Area of Interest gives you the figures for one element.
Use the maps first to see where attention is concentrated and which elements are noticed, then mark the elements you need certainty on. This matters most when two elements sit in similar colour on the heatmap and you need to know which one is actually performing, or when an element sits in a clear area of the fogmap and you need to know how long it took to be found.
WHAT TO USE IT FOR
Use Area of Interest when you need a specific answer rather than a general impression. Common examples are checking how quickly viewers reach the discount offer, or what share of total attention the brand logo is receiving.