
Image creative analysis
Image creative analysis predicts where attention will land on a static creative. It works on any flat visual, including display ads, social posts, posters, pack designs, shelf images, and page screenshots. This article explains how to run the analysis and what each part of the output shows.
RUNNING THE ANALYSIS
Open AI Creative Insights and upload a .jpg or .png file. The analysis runs and opens the results when it completes.
WHAT THE ANALYSIS RETURNS
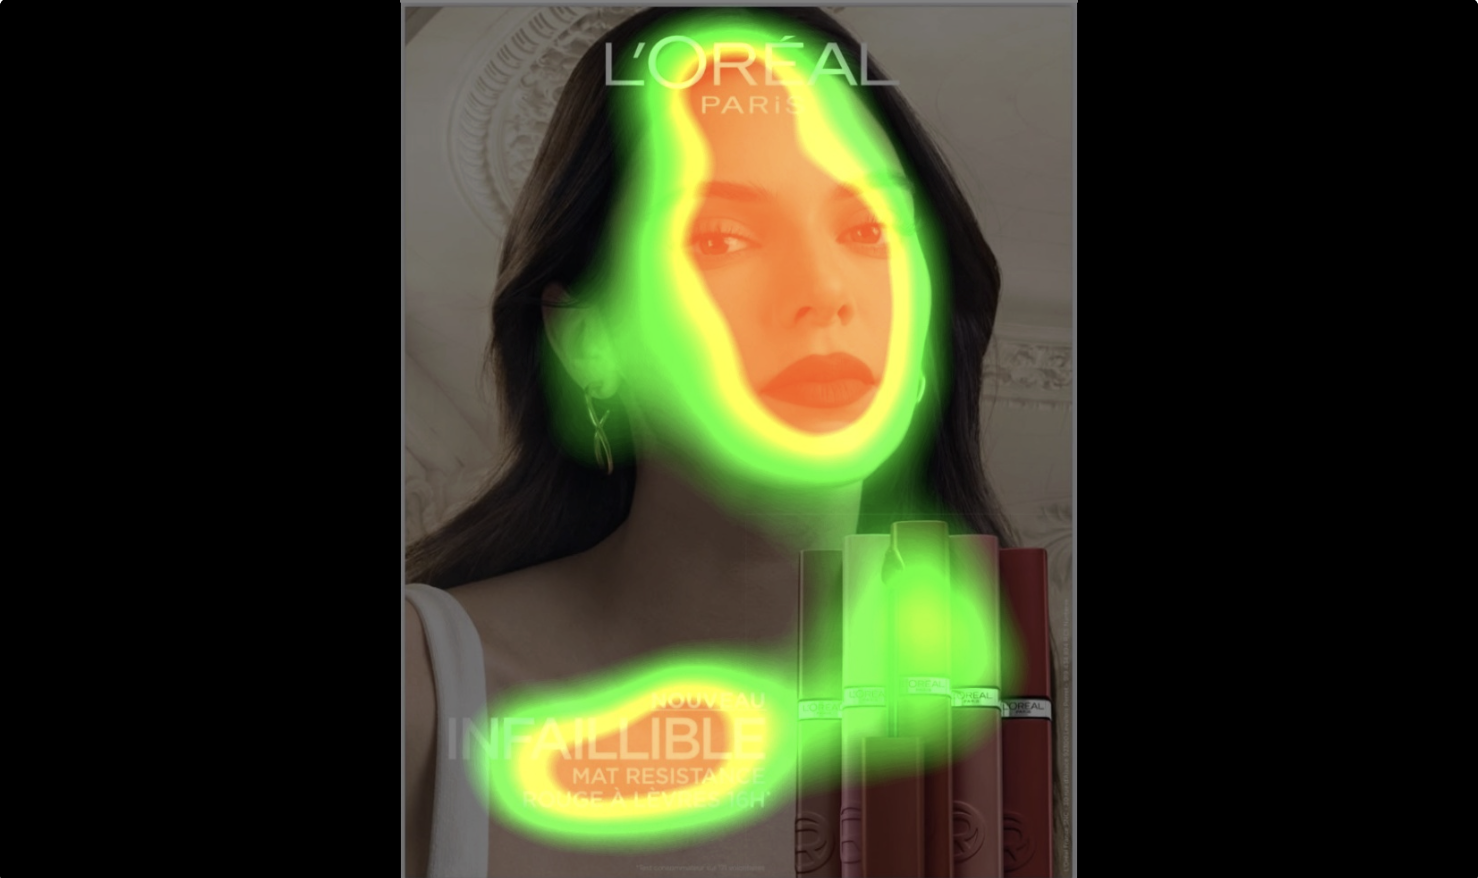
Heatmap
The heatmap shows where people pay attention on your creative, built from predicted gaze points. Each point marks a place the eye is predicted to land, and the points collect together into a map across the creative. Areas drawing the most gaze appear in warm colours, with red at the strongest concentration, running through to cooler colours where attention is lighter.
Use the heatmap to check that attention is landing on the parts the creative depends on, such as the product, the offer, or the logo. If the strongest concentration sits on a background image while the message sits in a cool area, the creative is being looked at but not read. See Heatmap interpretation.
Fogmap
The fogmap shows which parts of your creative are noticed and which are missed. It applies a visibility threshold to the gaze prediction: elements that draw enough attention to register stay clear, and elements that fall below the threshold are faded out.
What stays clear is what your creative communicates in a short exposure. Use the fogmap to check that the brand and the message both clear the threshold. If the imagery clears it and the logo does not, the creative will be seen without being attributed. See Fogmap interpretation.

Area of Interest scores
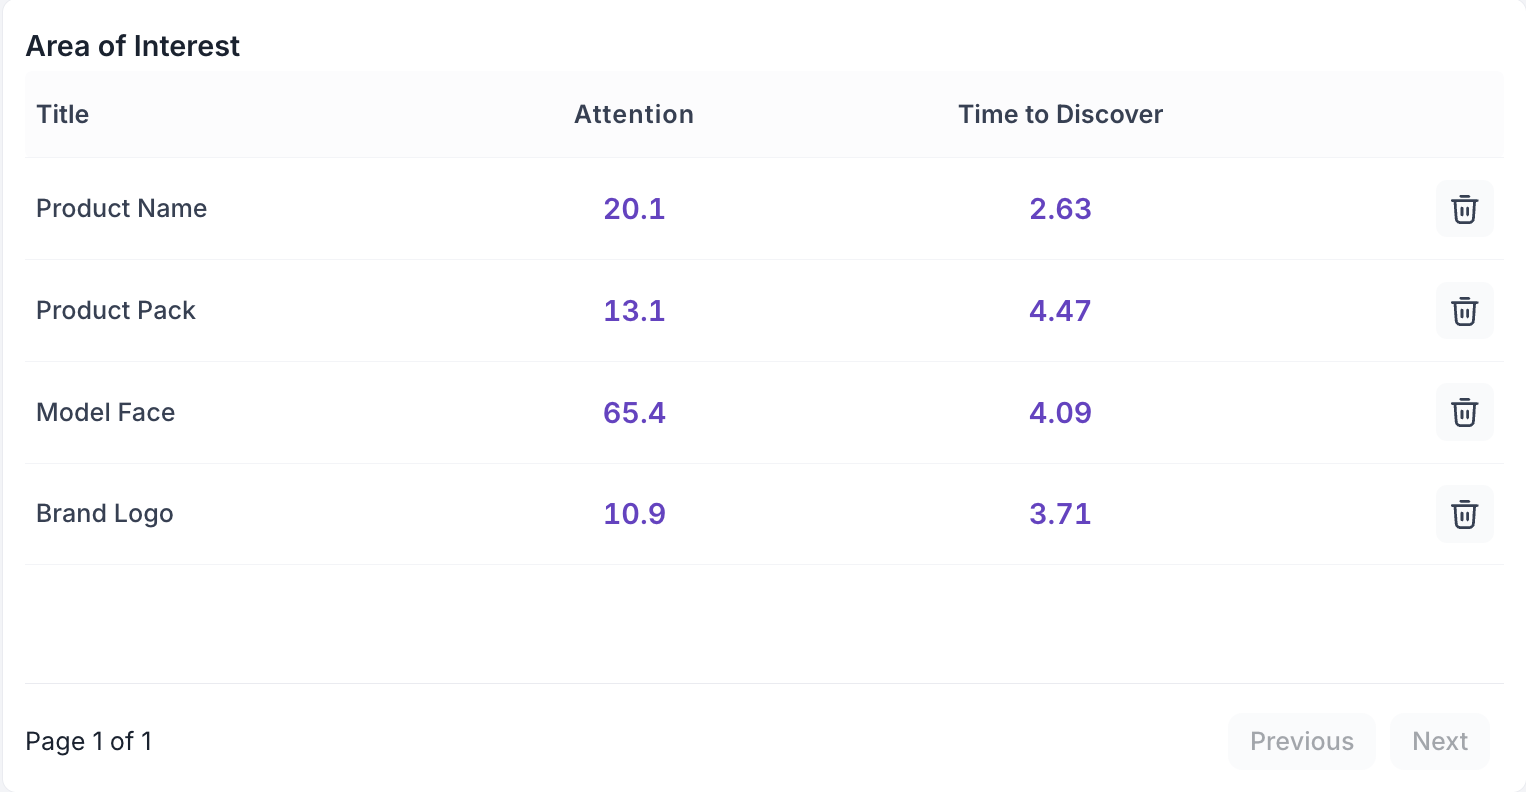
Marking an area of interest gives you scores for a specific element instead of an overall impression of the creative. Mark the logo, the price, the claim, or the call to action, and Decode returns two scores for each one.
Attention: the percentage of total viewing time spent looking at that element once it has been noticed. It measures how well the element holds someone after they reach it. A high value means they stay on it. A low value means they look at it and move on.
Time to Discover: how long it takes before the element is noticed for the first time. It measures how quickly the element is found, and it is the score that tells you the order elements are reached in. A low value means it is found early. A high value means it is found after other parts of the creative.
Read the two together. An element can hold attention well once it is found and still be found late in the viewing, which points to where it sits in the layout rather than how it is designed. See Area of Interest (AOI) setup on creatives and Time to Discover.
Design Analysis Report
The Design Analysis Report is a written summary of what the analysis found in the creative. Use it to read the finding directly rather than working it out from the maps, and as a starting point when writing up results for your team.
Design Improvement Report
The Design Improvement Report lists the specific changes the analysis recommends, based on the objective the creative is assessed against. This is the part you act on when you revise the creative. Check the objective shown alongside it first, because the same creative assessed against a different objective produces different recommendations. See Prescriptive guidance.
Persona results
If a synthetic audience is applied to the analysis, the results also show how the creative performs for each persona rather than for a general viewer, through Persona Fit, Persona Insights, and the Personas tab. Use this to check the creative works for the audience you are targeting. See Using a Synthetic Audience in AI Creative Insights.
RE-RUNNING AN ANALYSIS
Regenerate Insights runs the analysis again on the file already uploaded and replaces the existing output. A revised creative goes in as a new upload, which lets you compare the two versions against each other. See A/B creative testing using predictive AI.